The study involved four major activities in estimating the current size of the biopesticides market. Exhaustive secondary research was done to collect information on the market, peer market, and parent market. The next step was to validate these findings, assumptions, and sizing with industry experts across the value chain through primary research. Both top-down and bottom-up approaches were employed to estimate the complete market size. After that, market breakdown and data triangulation were used to estimate the market size of segments and subsegments.
Secondary Research
This research study involved the extensive use of secondary sources—directories and databases such as Bloomberg Businessweek and Factiva—to identify and collect information useful for a technical, market-oriented, and commercial study of the biopesticides market.
In the secondary research process, various sources such as annual reports, press releases & investor presentations of companies, white papers, certified publications, articles from recognized authors, gold & silver standard websites, directories, and databases were referred to identify and collect information. This research study involved the extensive use of secondary sources—directories and databases such as Bloomberg Businessweek and Factiva—to identify and collect information useful for a technical, market-oriented, and commercial study of the biopesticides market.
Secondary research was mainly used to obtain key information about the industry’s supply chain, the total pool of key players, and market classification and segmentation as per the industry trends to the bottom-most level, regional markets, and key developments from both market- and technology-oriented perspectives.
Primary Research
Extensive primary research was conducted after obtaining information regarding the biopesticides market scenario through secondary research. Several primary interviews were conducted with market experts from both the demand and supply sides across major countries of North America, Europe, Asia Pacific, the Middle East & Africa, and South America. Primary data was collected through questionnaires, emails, and telephonic interviews. The primary sources from the supply side included various industry experts, such as Chief X Officers (CXOs), Vice Presidents (VPs), Directors from business development, marketing, research, and development teams, and related key executives from distributors and key opinion leaders. Primary interviews were conducted to gather insights such as market statistics, data on revenue collected from the products and services, market breakdowns, market size estimations, market forecasting, and data triangulation. Primary research also helped in understanding the various trends related to type, crop type, mode of application, source, formulation, and region.
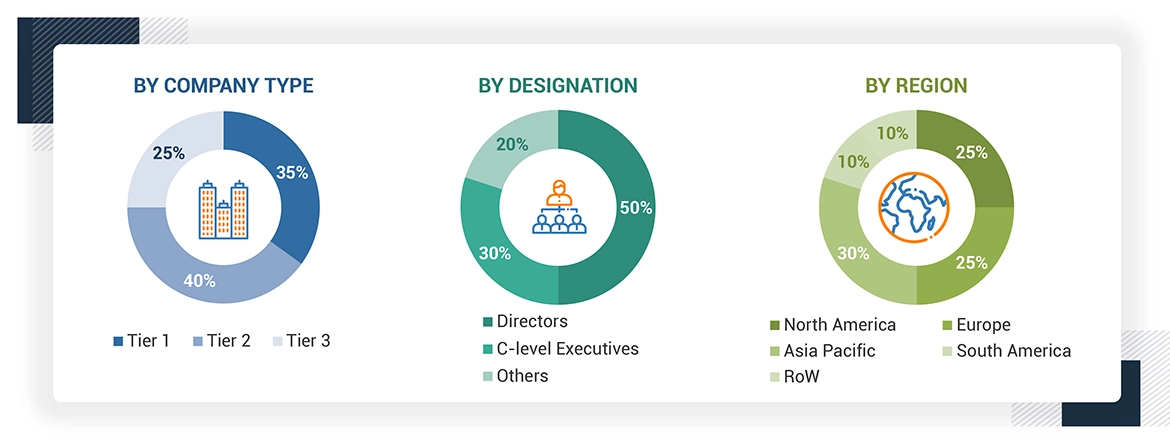
Note: “Others” includes marketing managers, sales managers, and product managers
To know about the assumptions considered for the study, download the pdf brochure
Market Size Estimation
Both the top-down and bottom-up approaches were used to estimate and validate the total size of the biopesticides market. These approaches were also used extensively to estimate the size of various dependent submarkets. The research methodology used to estimate the market size includes the following:
-
Key players were identified through extensive secondary research.
-
The industry’s value chain and market size were determined through primary and secondary research.
-
All percentage share splits and breakdowns were determined using secondary sources and verified through primary sources.
-
All the possible parameters that affect the markets covered in this research study were accounted for, viewed in extensive detail, verified through primary research, and analyzed to obtain the final quantitative and qualitative data.
-
The following figure provides an illustrative representation of the complete market size estimation process implemented in this research study for an overall estimation of the biopesticides market in a consolidated format.
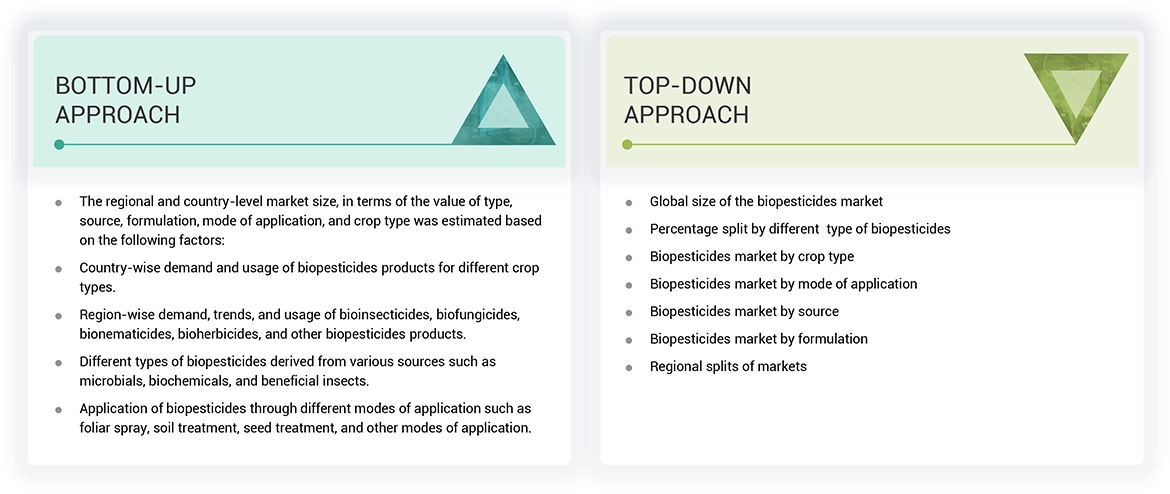
The following sections (bottom-up & top-down) depict the overall market size estimation process employed for the purpose of this study.
Biopesticides Market : Top-Down and Bottom-Up Approach
Data Triangulation
After arriving at the overall market size from the estimation process explained above, the total market was split into several segments and subsegments. Data triangulation and market breakdown procedures were employed, wherever applicable, to estimate the overall biopesticides market and arrive at the exact statistics for all segments and subsegments. The data was triangulated by studying various factors and trends from the demand and supply sides. Along with this, the market size was validated using both the top-down and bottom-up approaches.
Market Definition
Biopesticides have pesticide properties originating from natural living organisms, including microorganisms, plants, and animals. Biopesticides are gaining prominence due to their safer and ecofriendly nature.
The Environmental Protection Agency has defined biopesticides as follows:
“Biopesticides include naturally occurring substances that control pests (biochemical pesticides), microorganisms that control pests (microbial pesticides), and pesticidal substances produced by plants containing added genetic material (plant-incorporated protectants) or PIPs.“
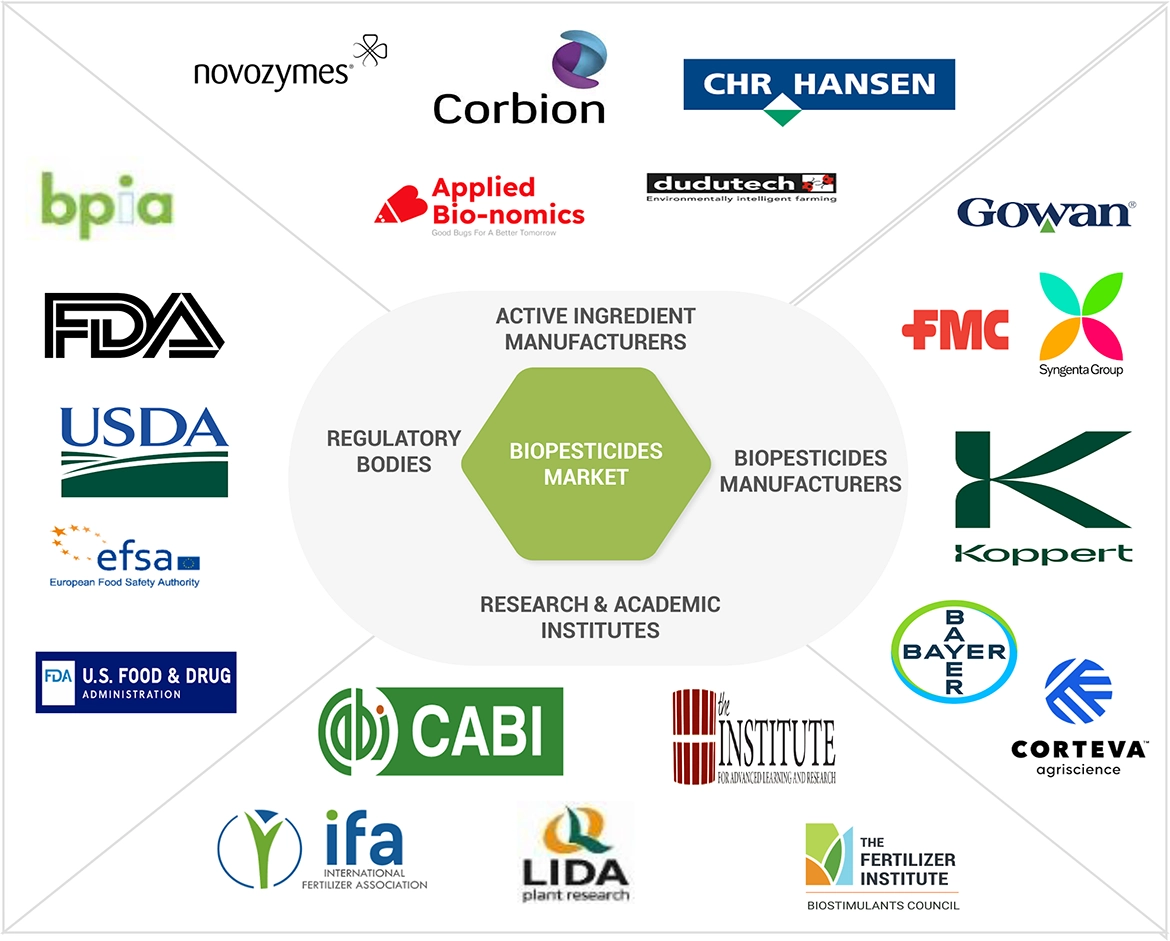
Stakeholders
-
Agriculture pesticide manufacturers & suppliers
-
Associations and industry bodies
-
Biopesticide manufacturers & suppliers
-
Biopesticide traders, retailers, and distributors
-
Commercial research & development (R&D) institutions
-
Venture capitalists and investors
-
Government, regulatory bodies, and research organizations
-
Technology providers to biopesticide & microbial companies
-
Public hygiene organizations, government regulatory institutions, and food safety agencies
-
Associations and industry bodies:
-
Food and Agriculture Organization (FAO)
-
European Food Safety Authority (EFSA)
-
British Pest Control Association (BPCA)
-
National Pest Management Association (NPMA)
-
National Pest Technicians Association
-
Confederation of Europe Pest Management Association (CEPA)
-
International associations and industry bodies such as Biopesticide Industry Alliance (BPIA) and the International Biocontrol Manufacturers Association (IBMA)
-
Organization for Economic Co-operation and Development (OECD)
Report Objectives
COMPETITIVE INTELLIGENCE
-
Identifying and profiling the key players in the biopesticides market
-
Providing a comparative analysis of market leaders based on the following:
-
Product offerings
-
Business strategies
-
Strengths and weaknesses
-
Key financials
-
Understanding the competitive landscape and identifying the major growth strategies adopted by players across the country
-
Providing insights on key product innovations and investments in the biopesticides market
-
This research report categorizes the biopesticides market based on type, crop type, mode of application, source, formulation, and region.
Target Audience
-
Biopesticides traders, retailers, and distributors
-
Biopesticides manufacturers & suppliers
-
Related government authorities, commercial research & development (R&D) institutions.
-
Regulatory bodies, including government agencies and NGOs.
-
Commercial research & development (R&D) institutions and financial institutions.
-
Government and research organizations.
-
Venture capitalists and investors.
-
Technology providers to Biopesticides companies.
-
Associations and industry bodies.
Available Customizations
With the given market data, MarketsandMarkets offers customizations according to company-specific scientific needs.
The following customization options are available for the report:
PRODUCT ANALYSIS
-
Product Matrix, which gives a detailed comparison of the product portfolio of each company.
GEOGRAPHIC ANALYSIS
With the given market data, MarketsandMarkets offers customizations according to company-specific scientific needs.
-
Further breakdown of the Rest of Europe into Netherlands, Greece, and Poland.
-
Further breakdown of the Rest of Asia Pacific into New Zealand and Vietnam.
-
Further breakdown of the Rest of South America into Chile, Peru, Colombia, and Paraguay.
COMPANY INFORMATION
-
Detailed analyses and profiling of additional market players (up to five)


 LARGEST CAGR (2024–2029)
 US FASTEST-GROWING MARKET IN REGION
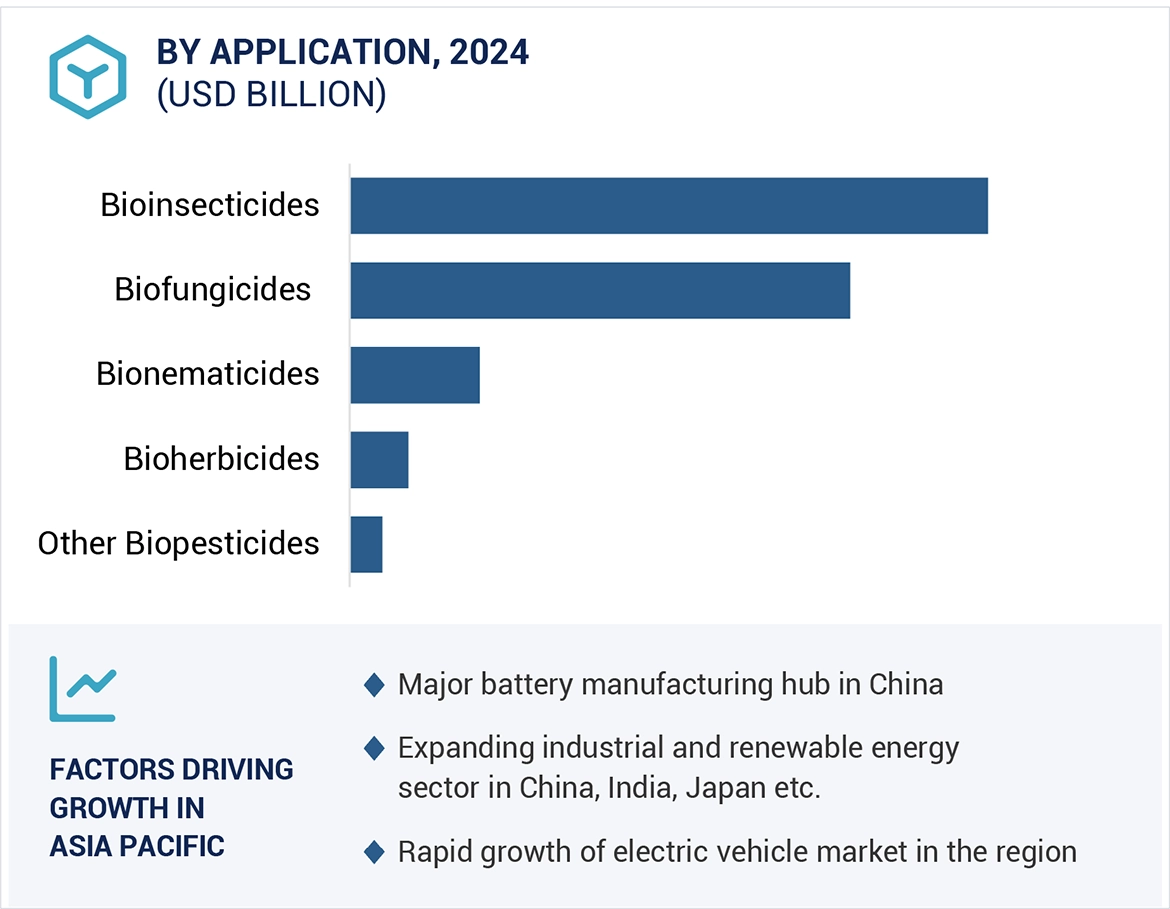


KORANGI
Jul, 2019
Looking for global biopesticides market and African share in consumption of biopesticides..
Giacomo
May, 2019
Want to develop an understanding regarding the global trend of Biopesticide - especially bacteria and microbials..
HyeGin
Aug, 2018
In addition to the sample report, I would like to know if you can provide the integrated table showing the market size of Beauveria Bassiana by soil treatment to berries in US..
User
Nov, 2019
Interested in the global biopesticide market.
Maitrayee
Jun, 2018
Want to know a detailed information about bio-insecticide..
Ricardo
Jun, 2019
By 2013/2014 Brazilian crop season a great amount of Dipel biospesticide was used against Helicoverpa armigera outbreaks. This represents a significant increase in Bacillus thuringiensis based biopesticides worldwide. I would like to know how important was this event to the whole biopesticide market..
David
Jan, 2019
Need information on the availability, mode of action and application of biopesticides in the UK..
David
Jan, 2019
Need information on the availability, mode of action and application of biopesticides in the UK..
Nguya
Feb, 2019
I would like to know the market outlook of microbial-based pesticides. .
MUJEEB
Nov, 2019
Looking for information regarding growth of global biopesticides market. .
Chen
Nov, 2019
Interested in the global biopesticide market.
Md
Oct, 2016
Looking for the bio pesticides (Bio-herbicides, Bio-insecticides, Bio-fungicides and others) details falong with bio pesticides list, explaining the active ingredient, doses, targeted crop, and targeted pest, mode of action, using methodology and price. .
Taufik
Sep, 2019
Interested in knowing the market potential for bio-oil from tobacco stem as biopesticide. .
Domenico
Jun, 2020
Very useful and interesting information. Thank you for your effort!.