Bifacial Solar Market by Cell Technology (Passivated Emitter Rear Contact, Heterojunction, Tunnel Oxide Passivated Contact (TOPCon)), Frame Type (Framed, Frameless), Type (Dual-Glass, Glass-Backsheet), Application, and Region - Global Forecast to 2029
[325 Pages Report] The global bifacial solar market in terms of revenue was estimated to be worth $18.5 billion in 2024 and is poised to reach $37.6 billion by 2029, growing at a CAGR of 15.2% from 2024 to 2029. Cutting-edge innovations in materials, manufacturing techniques, and panel design are significantly enhancing the performance and lowering the costs of bifacial solar panels. Advanced materials increase energy absorption efficiency, while streamlined manufacturing processes reduce production expenses. Additionally, innovative panel designs maximize energy capture from both sides, further boosting overall output. These technological breakthroughs not only make bifacial solar panels more efficient and cost-effective but also expand their applicability in various settings, driving wider adoption and bifacial solar panel market growth.
To know about the assumptions considered for the study, Request for Free Sample Report
To know about the assumptions considered for the study, download the pdf brochure
Bifacial Solar Market Dynamics
Driver: Higher Efficiency and Durability
Bifacial solar panels are notably more durable than traditional monofacial panels, primarily due to their double-glass construction, which provides exceptional resistance to environmental challenges like hail, strong winds, and heavy snow. This sturdy design not only extends the panels' operational lifespan but also ensures consistent performance over time, making them an excellent choice for those seeking a secure, long-term investment in solar energy.
Additionally, bifacial solar panels significantly enhance efficiency compared to conventional panels. By capturing sunlight on both the front and back sides, these panels can generate up to 30% more energy under optimal conditions. This considerable boost in energy production is particularly advantageous in high-reflectivity environments, such as snow-covered fields, sandy deserts, and reflective rooftops. The dual-sided energy capture maximizes the energy output from a given installation area, making bifacial solar panels an appealing option for those looking to optimize their solar energy systems.
Restraint: Dependence on Albedo
The performance of bifacial solar panels heavily depends on the albedo, or reflectivity, of the surface beneath them, which enhances their energy production by capturing reflected sunlight. However, high-albedo surfaces are not always available, leading to potential reduced returns on investment in areas with low reflectivity. This reliance on albedo introduces a significant limitation for bifacial technology.
Additionally, the ideal placement of bifacial panels requires large, unobstructed areas with high reflectivity. However, limited land availability, especially in urbanized and densely populated regions, makes it challenging to find suitable locations for these installations. These constraints highlight the complexities in adopting bifacial solar technology broadly, as its benefits are dependent on specific environmental conditions and sufficient space. Addressing these challenges is essential to fully leverage the potential of bifacial solar energy in the renewable energy landscape..
Opportunities: Rise in government initiatives for bifacial solar technology
Governments worldwide are actively encouraging the adoption of bifacial solar technology through various incentive programs to address its slightly higher upfront costs compared to traditional monofacial panels. Key incentive structures include Feed-in Tariffs (FITs), which provide guaranteed payments for electricity generated. Some countries, such as China, offer higher rates for bifacial panels due to their increased output. Additionally, tax credits like the 30% US federal Investment Tax Credit (ITC) for solar installations in 2024 significantly lower initial costs, making bifacial panels more competitive. Grants, such as India's Production Linked Incentive (PLI) Scheme, provide financial incentives specifically for high-efficiency solar module manufacturers, further promoting the adoption of bifacial technology.
As the bifacial solar panel market evolves and becomes more cost-competitive, additional government incentives are anticipated to emerge, accelerating its widespread adoption. These developing policies, along with the inherent advantages of bifacial panels, will be crucial in transitioning to a cleaner and more sustainable energy future. Keeping up-to-date with the latest incentive programs in various regions is essential for maximizing the benefits of bifacial solar projects.
Challenges: Competition from traditional and other energy sources
In the evolving field of energy production, bifacial solar panels are emerging as a formidable competitor against the long-standing dominance of coal and natural gas. However, this transition faces significant obstacles, particularly the price volatility of traditional energy sources, which presents a major challenge to the adoption of bifacial solar technology. The fluctuating costs of coal and natural gas not only affect consumer choices but also shape governmental policies and industry investments, creating a substantial barrier to the widespread integration of bifacial solar panels into the energy market.
Despite these challenges, there is a promising opportunity for bifacial solar panels to demonstrate their resilience and potential. By utilizing technological advancements and taking advantage of economies of scale, the solar industry can work to lessen the impact of traditional energy price fluctuations. Moreover, proactive strategies such as innovative pricing models, government incentives, and targeted marketing campaigns can enhance the competitiveness of bifacial solar panels, paving the way for a sustainable energy future that surpasses the limitations of fossil fuels.
Bifacial Solar Market Ecosystem
In this market, prominent companies stand out as well-established and financially stable providers of bifacial solar. With years of experience, these companies boast a diverse product portfolio, cutting-edge technologies, and robust global sales and marketing networks. Their proven track record in the industry positions them as reliable and trusted partners for customers seeking bifacial solar. These companies have demonstrated their ability to adapt to bifacial solar panel market dynamics and consistently deliver high-quality products and services, making them leaders in meeting the demands of the energy and power sector. Prominent companies in this market LONGi (China), Trinasolar (China), Canadian Solar (Canada), JA SOLAR Technology Co., Ltd. (China), and SHARP CORPORATION (Japan).
The residential segment, by application, is expected to be the fastest growing market during the forecast period.
The rising awareness of environmental issues and the urgent need to combat climate change are prompting more homeowners to consider renewable energy solutions. As people become more conscious of their carbon footprints, there is a stronger push towards adopting sustainable practices. Bifacial solar panels, which offer higher efficiency and better utilization of sunlight, are increasingly seen as an attractive option for residential energy needs. Homeowners are motivated by the dual benefits of contributing to environmental conservation and achieving greater energy independence, leading to a significant rise in the demand for these advanced solar technologies.
Asia Pacific: The fastest growing region in the bifacial solar market.
Asia Pacific is expected to be the fastest growing region in the bifacial solar market between 2024–2029. Regional market dynamics have a significant impact on the adoption of bifacial solar technologies in the Asia-Pacific region. High solar irradiance levels, diverse climate conditions, and varying stages of economic development are key factors. The plentiful sunlight in many areas creates ideal conditions for bifacial solar panels to maximize energy production. Moreover, the region's varied climates, ranging from tropical to temperate, require durable and adaptable solar technologies that bifacial panels provide. Economic growth across Asia-Pacific, with numerous countries experiencing rapid industrialization and urbanization, further drives the demand for advanced renewable energy solutions. These regional factors collectively shape the bifacial solar cells market, making bifacial solar technologies a well-suited and promising energy solution for the Asia-Pacific region.
Key Market Players
The market is dominated by a few major players that have a wide regional presence. The major players in the bifacial solar market include LONGi (China), Trinasolar (China), Canadian Solar (Canada), JA SOLAR Technology Co., Ltd. (China), and SHARP CORPORATION (Japan). Between 2020 and 2024, Strategies such as new product launches, contracts, agreements, partnerships, collaborations, acquisitions, and expansions are followed by these companies to capture a larger share of the solar market.
Want to explore hidden markets that can drive new revenue in Bifacial Solar Market?
Scope of the Report
Want to explore hidden markets that can drive new revenue in Bifacial Solar Market?
Report Metric |
Details |
Market size available for years |
2019–2029 |
Base year considered |
2023 |
Forecast period |
2024–2029 |
Forecast units |
Value (USD Million)/ Volume (Units) |
Segments Covered |
Bifacial Solar Market by type, frame type, cell technology, application and region. |
Geographies covered |
North America, Europe, Asia Pacific, and RoW. |
Companies covered |
LONGi (China), Trinasolar (China), Canadian Solar (Canada), JA SOLAR Technology Co., Ltd. (China), SHARP CORPORATION (Japan), Tata Power Solar Systems Ltd. (India), First Solar (US), Talesun Solar Co., Ltd (China), Adani Group (India), Wuxi Suntech Power Co., Ltd (China), are Yingli Solar (China), Jinko Solar (China), Hanwha Qcells (Korea), RenewSys India Pvt. Ltd (India), AUXIN SOLAR INC (US), CHINT Group (China), SolarEdge (Israel), SoliTek (Lithuania), SILFAB SOLAR INC. (Canada), SEG Solar (US), Saatvik Solar (India), Neosun Inc (China), ZNSHINE PV- TECH Co., Ltd (China), CROSSROADS SOLAR (US), and HD Hyundai Energy Solutions., Ltd (Korea). |
This research report categorizes the bifacial solar market based on type, frame type, cell technology, application and region.
On the basis of type, the bifacial solar market has been segmented as follows:
- Dual-Glass Bifacial Solar
- Glass-backsheet Bifacial Solar
On the basis of frame type, the bifacial solar market has been segmented as follows:
- Framed Bifacial Solar
- Framless Bifacial Solar
On the basis of cell technology, the bifacial solar market has been segmented as follows:
- Passivated Emitter Rear Contact (PERC)
- TOPCon
- Heterojunction (HJT)
On the basis of application, the bifacial solar market has been segmented as follows:
- Residential
- Commercial & Industrial
- Utilities
Based on region, the bifacial solar market has been segmented as follows:
- North America
- Europe
- Asia Pacific
- RoW
Recent Developments
- In June 2024, Canadian Solar has signed a 20-year Power Purchase Agreement (PPA) with Toyota Tsusho Corporation for a project development venture in Japan, encompassing 240 MWp of solar capacity and 1.675 GWh of energy storage. This agreement signifies our dedication to assisting Japanese businesses in fulfilling their renewable energy requirements, both domestically and internationally. The projects utilize CS7N-660W bifacial modules to deliver sustainable energy solutions.
- In June 2024, ACWA Power and LONGi have inked a framework agreement. ACWA Power has over 4000 employees and 84 projects in operation, construction, or development across 13 countries in the Middle East, Africa, Central Asia, and Southeast Asia, totaling over $87.9 billion in asset investment, 57.071GW of installed power capacity, and 8.044 million tons/day of seawater desalination capacity. LONGi focuses on technological innovation and aims to expand its company into five areas: monocrystalline wafers, cells and modules, distributed generation solar solutions, utility plant system solutions, and hydrogen equipment solutions.
- In May 2024, LONGi has announced the launch of its latest product, the Hi-MO X6 Max series, at its cutting-edge Jiaxing facility. The Hi-MO X6 Max series marks a key milestone for the corporation, coming after nine manufacturers secured an industry-wide consensus on module size standards and six manufacturers later agreed on wafer size requirements in July and August 2023, respectively. The launch marks LONGi's first large-scale switch to rectangular silicon wafers.
Frequently Asked Questions (FAQ):
What is the current size of the bifacial solar market?
The current market size of the bifacial solar market is USD 18.57 million in 2024.
What are the major drivers for the bifacial solar market?
The global demand for electricity is rising, driven by population growth and economic development. This is creating a need for new sources of clean energy, such as bifacial solar.
Which is the largest region during the forecasted period in the bifacial solar market?
Asia Pacific is expected to dominate the bifacial solar market between 2024–2029, followed by North America and Europe.
Which is the largest segment, by application, during the forecasted period in bifacial solar market?
The utilities segment is expected to be the largest market during the forecast period owing to its relatively mature and cost-effective.
Which is the largest segment, by type, during the forecasted period in the bifacial solar market?
Dual-Glass Bifacial Solar segment is expected to be the largest market during the forecast period by type. .
To speak to our analyst for a discussion on the above findings, click Speak to Analyst
Exclusive indicates content/data unique to MarketsandMarkets and not available with any competitors.
- 5.1 INTRODUCTION
-
5.2 MARKET DYNAMICSDRIVERS- Declining costs of bifacial solar panels- Higher efficiency and durabilityRESTRAINTS- Complexity of installations- Dependence on albedoOPPORTUNITIES- Government initiatives on bifacial solar technology- Emergence of advanced technologies such as TOPCon and IBCCHALLENGES- Grid injection challenges- Competition from other energy sources
- 5.3 TRENDS/DISRUPTIONS IMPACTING CUSTOMERS' BUSINESSES
-
5.4 PRICING ANALYSISAVERAGE PRICE TREND OF BIFACIAL SOLAR, BY REGIONINDICATIVE PRICE TREND OF BIFACIAL SOLAR, BY CELL TECHNOLOGY
-
5.5 SUPPLY CHAIN ANALYSISRAW MATERIAL PROVIDERSBIFACIAL SOLAR MANUFACTURERSBIFACIAL SOLAR SUPPLIERSEND USERS
- 5.6 ECOSYSTEM ANALYSIS
-
5.7 TECHNOLOGY ANALYSISKEY TECHNOLOGIES- Monocrystalline- Polycrystalline- NanocrystallineCOMPLEMENTARY TECHNOLOGIES- P–Type solar panels- N–Type solar panels- P-N Type solar panelsADJACENT TECHNOLOGIES- Monofacial solar panel- Perovskite solar cells
-
5.8 CASE STUDY ANALYSISSHARP HELPED BIG C SUPERMARKET (THAILAND) IN INSTALLATION OF ROOFTOP SOLAR PANELSHEWLETT PACKARD (HP) INSTALLED SOLAR PANELS ON ITS ROOFTOPS WITH HELP OF SHARP (JAPAN)ASHOK TEXTILES' STRATEGIES FOR TERRAIN-DRIVEN EFFICIENCY
-
5.9 PATENT ANALYSISLIST OF MAJOR PATENTS
-
5.10 TRADE ANALYSISHS CODE 854143- Export scenario- Import scenarioHS CODE 854142- Export scenario- Import scenario
- 5.11 KEY CONFERENCES AND EVENTS
-
5.12 REGULATORY LANDSCAPEREGULATORY BODIES, GOVERNMENT AGENCIES, AND OTHER ORGANIZATIONSBIFACIAL SOLAR MARKET: REGULATORY FRAMEWORK
-
5.13 PORTER'S FIVE FORCES ANALYSISTHREAT OF SUBSTITUTESBARGAINING POWER OF SUPPLIERSBARGAINING POWER OF BUYERSTHREAT OF NEW ENTRANTSINTENSITY OF COMPETITIVE RIVALRY
-
5.14 KEY STAKEHOLDERS AND BUYING CRITERIAKEY STAKEHOLDERS IN BUYING PROCESSBUYING CRITERIA
- 5.15 INVESTMENT AND FUNDING SCENARIO
- 6.1 INTRODUCTION
- 6.2 UPTO 200 WP
- 6.3 200−400 WP
- 6.4 ABOVE 400 WP
- 7.1 INTRODUCTION
-
7.2 MONOCRYSTALLINELONGEVITY AND EFFICIENCY OF MONOCRYSTALLINE SOLAR PANELS T0 DRIVE MARKET
-
7.3 POLYCRYSTALLINELOWERING INVESTMENT BARRIERS IN POLYSILICON MANUFACTURING TO FUEL MARKET GROWTH
- 8.1 INTRODUCTION
-
8.2 FRAMED BIFACIAL SOLARASIA PACIFIC TO BE FASTEST-GROWING MARKET FOR FRAMED BIFACIAL SOLAR
-
8.3 FRAMELESS BIFACIAL SOLARLOWER MAINTENANCE REQUIREMENTS IN EXTREME WEATHER CONDITIONS TO FUEL MARKET
- 9.1 INTRODUCTION
-
9.2 PASSIVATED EMITTER AND REAR CONTACT (PERC)STRENGTHENING GRID STABILITY WITH COMMUNITY SOLAR AND PERC PANELS TO DRIVE MARKET
-
9.3 HETEROJUNCTION (HJT)INNOVATIONS IN LID RESISTANCE WITH HJT SOLAR CELLS TO FUEL MARKET GROWTH
-
9.4 TOPCONOPTIMAL PERFORMANCE OF TOPCON CELLS IN FREEZING CLIMATES TO SUPPORT MARKET GROWTH
-
9.5 OTHER CELL TECHNOLOGIESPASSIVATED EMITTER REAR LOCALLY-DIFFUSED (PERL)INTERDIGITATED BACK CONTACT (IBC)PASSIVATED EMITTER REAR TOTALLY DIFFUSED (PERT)
- 10.1 INTRODUCTION
-
10.2 RESIDENTIALASIA PACIFIC TO BE LARGEST MARKET FOR BIFACIAL SOLAR IN RESIDENTIAL SECTOR
-
10.3 COMMERCIAL & INDUSTRIALRISING ELECTRICITY COSTS AND SHIFT TOWARDS SOLAR POWER TECHNOLOGY TO FUEL MARKET
-
10.4 UTILITIESENVIRONMENTAL BENEFITS OF SOLAR POWER PLANTS TO SUPPORT MARKET GROWTH
- 11.1 INTRODUCTION
-
11.2 ASIA PACIFICRECESSION IMPACT: ASIA PACIFICBY TYPEBY FRAME TYPEBY CELL TECHNOLOGYBY APPLICATIONBY COUNTRY- China- Japan- South Korea- Australia- India- Rest of Asia Pacific
-
11.3 NORTH AMERICARECESSION IMPACT: NORTH AMERICABY TYPEBY FRAME TYPEBY CELL TECHNOLOGYBY APPLICATIONBY COUNTRY- US- Canada- Mexico
-
11.4 EUROPERECESSION IMPACT: EUROPEBY TYPEBY FRAME TYPEBY CELL TECHNOLOGYBY APPLICATIONBY COUNTRY- Germany- Italy- Netherlands- Spain- France- Rest of Europe
-
11.5 REST OF THE WORLDRECESSION IMPACT: NORTH AMERICABY TYPEBY FRAME TYPEBY CELL TECHNOLOGYBY APPLICATIONBY COUNTRY- Middle East & Africa- South America
- 12.1 OVERVIEW
- 12.2 STRATEGIES ADOPTED BY KEY PLAYERS
- 12.3 MARKET SHARE ANALYSIS
- 12.4 MARKET EVALUATION FRAMEWORK
- 12.5 SEGMENTAL REVENUE ANALYSIS OF TOP MARKET PLAYERS
- 12.6 COMPANY VALUATION AND FINANCIAL METRICS
- 12.7 BRAND/PRODUCT COMPARISON
-
12.8 COMPANY EVALUATION MATRIX: KEY PLAYERS, 2023STARSEMERGING LEADERSPERVASIVE PLAYERSPARTICIPANTSCOMPANY FOOTPRINT, KEY PLAYERS- Overall footprint- Region footprint- Type footprint- Frame type footprint- Cell technology footprint- Panel type footprint- Application footprint
-
12.9 COMPANY EVALUATION MATRIX: STARTUPS/SMES, 2023PROGRESSIVE COMPANIESRESPONSIVE COMPANIESDYNAMIC COMPANIESSTARTING BLOCKSCOMPETITIVE BENCHMARKING: STARTUPS/SMES, 2023- List of key startups/SMEs- Competitive benchmarking of key startups/SMEs
-
12.10 COMPETITIVE SCENARIO AND TRENDSPRODUCT LAUNCHESDEALSEXPANSIONSOTHERS
-
13.1 KEY PLAYERSLONGI- Business overview- Products/Solutions/Services offered- Recent developments- MnM ViewCANADIAN SOLAR- Business overview- Products/Solutions/Services offered- Recent developments- MnM ViewTRINASOLAR- Business overview- Products/Solutions/Services offered- Recent developments- MnM viewSHARP CORPORATION- Business overview- Products/Solutions/Services offered- Recent developments- MnM viewJA SOLAR TECHNOLOGY CO., LTD.- Business overview- Products/Solutions/Services offered- Recent developments- MnM ViewJINKO SOLAR- Business overview- Products/Solutions/Services offered- Recent developmentsADANI GROUP- Business overview- Products/Solutions/Services offeredFIRST SOLAR- Business overview- Products/Solutions/Services offered- Recent developmentsRENEWSYS INDIA PVT. LTD.- Business overview- Products/Solutions/Services offered- Recent developmentsHANWHA QCELLS- Business overview- Products/Services/Solutions offered- Recent developmentsTALESUN SOLAR CO., LTD.- Business overview- Products/Solutions/Services offered- Recent developmentsHD HYUNDAI ENERGY SOLUTIONS., LTD.- Business overview- Products/Solutions/Services offered- Recent developmentsCHINT GROUP- Business overview- Products/Services/Solutions offered- Recent developmentsSOLAREDGE- Business overview- Products/Services/Solutions offeredTATA POWER SOLAR SYSTEMS LTD.- Business overview- Products/Services/Solutions offered- Recent developments
-
13.2 OTHER PLAYERSZNSHINE PV-TECH CO., LTD.YINGLI SOLARWUXI SUNTECH POWER CO., LTD.CROSSROADS SOLARSEG SOLARNEOSUN INC.AUXIN SOLAR INC.SOLITEKSAATVIK SOLARSILFAB SOLAR INC.
- 14.1 INSIGHTS FROM INDUSTRY EXPERTS
- 14.2 DISCUSSION GUIDE
- 14.3 KNOWLEDGESTORE: MARKETSANDMARKETS' SUBSCRIPTION PORTAL
- 14.4 CUSTOMIZATION OPTIONS
- 14.5 RELATED REPORTS
- 14.6 AUTHOR DETAILS
- TABLE 1 BIFACIAL SOLAR MARKET SNAPSHOT
- TABLE 2 AVERAGE PRICE TREND OF BIFACIAL SOLAR, BY REGION, 2023–2029 (USD/WP)
- TABLE 3 INDICATIVE PRICE TREND OF BIFACIAL SOLAR, BY CELL TECHNOLOGY, 2023–2029 (USD/WP)
- TABLE 4 MARKET: COMPANIES AND THEIR ROLES IN ECOSYSTEM
- TABLE 5 MARKET: INNOVATIONS AND PATENT REGISTRATIONS, 2019–2023
- TABLE 6 EXPORT DATA FOR HS CODE 854143, BY COUNTRY, 2022–2023 (USD THOUSAND)
- TABLE 7 IMPORT SCENARIO FOR HS CODE 854143, BY COUNTRY, 2022–2023 (USD THOUSAND)
- TABLE 8 EXPORT DATA FOR HS CODE 854142, BY COUNTRY, 2022–2023 (USD THOUSAND)
- TABLE 9 IMPORT SCENARIO FOR HS CODE 854142, BY COUNTRY, 2022–2023 (USD THOUSAND)
- TABLE 10 MARKET: LIST OF KEY CONFERENCES AND EVENTS, 2023–2024
- TABLE 11 ASIA PACIFIC: LIST OF REGULATORY BODIES, GOVERNMENT AGENCIES, AND OTHER ORGANIZATIONS
- TABLE 12 NORTH AMERICA: LIST OF REGULATORY BODIES, GOVERNMENT AGENCIES, AND OTHER ORGANIZATIONS
- TABLE 13 EUROPE: LIST OF REGULATORY BODIES, GOVERNMENT AGENCIES, AND OTHER ORGANIZATIONS
- TABLE 14 ROW: LIST OF REGULATORY BODIES, GOVERNMENT AGENCIES, AND OTHER ORGANIZATIONS
- TABLE 15 MARKET: REGULATIONS
- TABLE 16 BIFACIAL SOLAR MARKET: PORTER'S FIVE FORCES ANALYSIS
- TABLE 17 INFLUENCE OF STAKEHOLDERS ON BUYING PROCESS, BY TYPE
- TABLE 18 KEY BUYING CRITERIA IN TOP 3 APPLICATIONS
- TABLE 19 COMPANIES OFFERING BIFACIAL MODULES UP TO 200 WP
- TABLE 20 COMPANIES OFFERING 200−400 WP BIFACIAL MODULES
- TABLE 21 COMPANIES OFFERING ABOVE 400 WP BIFACIAL MODULES
- TABLE 22 BIFACIAL SOLAR MARKET, BY FRAME TYPE, 2019–2023 (USD MILLION)
- TABLE 23 MARKET, BY FRAME TYPE, 2024–2029 (USD MILLION)
- TABLE 24 FRAMED SOLAR MARKET, BY REGION, 2019–2023 (USD MILLION)
- TABLE 25 FRAMED SOLAR MARKET, BY REGION, 2024–2029 (USD MILLION)
- TABLE 26 FRAMELESS SOLAR MARKET, BY REGION, 2019–2023 (USD MILLION)
- TABLE 27 FRAMELESS SOLAR MARKET, BY REGION, 2024–2029 (USD MILLION)
- TABLE 28 BIFACIAL SOLAR MARKET, BY CELL TECHNOLOGY, 2019–2023 (USD MILLION)
- TABLE 29 MARKET, BY CELL TECHNOLOGY, 2024–2029 (USD MILLION)
- TABLE 30 PASSIVATED EMITTER AND REAR CELL (PERC): SOLAR MARKET, BY REGION, 2019–2023 (USD MILLION)
- TABLE 31 PASSIVATED EMITTER AND REAR CELL (PERC): SOLAR MARKET, BY REGION, 2024–2029 (USD MILLION)
- TABLE 32 HETEROJUNCTION (HJT): SOLAR MARKET, BY REGION, 2019–2023 (USD MILLION)
- TABLE 33 HETEROJUNCTION (HJT): SOLAR MARKET, BY REGION, 2024–2029 (USD MILLION)
- TABLE 34 TOPCON: SOLAR MARKET, BY REGION, 2019–2023 (USD MILLION)
- TABLE 35 TOPCON: SOLAR MARKET, BY REGION, 2024–2029 (USD MILLION)
- TABLE 36 BIFACIAL SOLAR MARKET, BY APPLICATION, 2019–2023 (USD MILLION)
- TABLE 37 SOLAR MARKET, BY APPLICATION, 2024–2029 (USD MILLION)
- TABLE 38 RESIDENTIAL: BIFACIAL SOLAR MARKET, BY REGION, 2019–2023 (USD MILLION)
- TABLE 39 RESIDENTIAL: SOLAR MARKET, BY REGION, 2024–2029 (USD MILLION)
- TABLE 40 COMMERCIAL & INDUSTRIAL: SOLAR MARKET, BY REGION, 2019–2023 (USD MILLION)
- TABLE 41 COMMERCIAL & INDUSTRIAL: SOLAR MARKET, BY REGION, 2024–2029 (USD MILLION)
- TABLE 42 UTILITIES: BIFACIAL SOLAR MARKET, BY REGION, 2019–2023 (USD MILLION)
- TABLE 43 UTILITIES: SOLAR MARKET, BY REGION, 2024–2029 (USD MILLION)
- TABLE 44 BIFACIAL SOLAR MARKET, BY REGION, 2019–2023 (USD MILLION)
- TABLE 45 MARKET, BY REGION, 2024–2029 (USD MILLION)
- TABLE 46 MARKET, BY REGION, 2019–2023 (MW)
- TABLE 47 MARKET, BY REGION, 2024–2029 (MW)
- TABLE 48 ASIA PACIFIC: BIFACIAL SOLAR MARKET, BY TYPE, 2019–2023 (USD MILLION)
- TABLE 49 ASIA PACIFIC: MARKET, BY TYPE, 2024–2029 (USD MILLION)
- TABLE 50 ASIA PACIFIC: MARKET, BY FRAME TYPE, 2019–2023 (USD MILLION)
- TABLE 51 ASIA PACIFIC: MARKET, BY FRAME TYPE, 2024–2029 (USD MILLION)
- TABLE 52 ASIA PACIFIC: MARKET, BY CELL TECHNOLOGY, 2019–2023 (USD MILLION)
- TABLE 53 ASIA PACIFIC: MARKET, BY CELL TECHNOLOGY, 2024–2029 (USD MILLION)
- TABLE 54 ASIA PACIFIC: MARKET, BY APPLICATION, 2019–2023 (USD MILLION)
- TABLE 55 ASIA PACIFIC: MARKET, BY APPLICATION, 2024–2029 (USD MILLION)
- TABLE 56 ASIA PACIFIC: MARKET, BY COUNTRY, 2019–2023 (USD MILLION)
- TABLE 57 ASIA PACIFIC: MARKET, BY COUNTRY, 2024–2029 (USD MILLION)
- TABLE 58 ASIA PACIFIC: MARKET, BY COUNTRY, 2019–2023 (MW)
- TABLE 59 ASIA PACIFIC: MARKET, BY COUNTRY, 2024–2029 (MW)
- TABLE 60 CHINA: MARKET, BY APPLICATION, 2019–2023 (USD MILLION)
- TABLE 61 CHINA: MARKET, BY APPLICATION, 2024–2029 (USD MILLION)
- TABLE 62 JAPAN: MARKET, BY APPLICATION, 2019–2023 (USD MILLION)
- TABLE 63 JAPAN: MARKET, BY APPLICATION, 2024–2029 (USD MILLION)
- TABLE 64 SOUTH KOREA: BIFACIAL SOLAR MARKET, BY APPLICATION, 2019–2023 (USD MILLION)
- TABLE 65 SOUTH KOREA: MARKET, BY APPLICATION, 2024–2029 (USD MILLION)
- TABLE 66 AUSTRALIA: MARKET, BY APPLICATION, 2019–2023 (USD MILLION)
- TABLE 67 AUSTRALIA: MARKET, BY APPLICATION, 2024–2029 (USD MILLION)
- TABLE 68 INDIA: MARKET, BY APPLICATION, 2019–2023 (USD MILLION)
- TABLE 69 INDIA: MARKET, BY APPLICATION, 2024–2029 (USD MILLION)
- TABLE 70 REST OF ASIA PACIFIC: MARKET, BY APPLICATION, 2019–2023 (USD MILLION)
- TABLE 71 REST OF ASIA PACIFIC: MARKET, BY APPLICATION, 2024–2029 (USD MILLION)
- TABLE 72 NORTH AMERICA: BIFACIAL SOLAR MARKET, BY TYPE, 2019–2023 (USD MILLION)
- TABLE 73 NORTH AMERICA: MARKET, BY TYPE, 2024–2029 (USD MILLION)
- TABLE 74 NORTH AMERICA: MARKET, BY FRAME TYPE, 2019–2023 (USD MILLION)
- TABLE 75 NORTH AMERICA: MARKET, BY FRAME TYPE, 2024–2029 (USD MILLION)
- TABLE 76 NORTH AMERICA: MARKET, BY CELL TECHNOLOGY, 2019–2023 (USD MILLION)
- TABLE 77 NORTH AMERICA: MARKET, BY CELL TECHNOLOGY, 2024–2029 (USD MILLION)
- TABLE 78 NORTH AMERICA: MARKET, BY APPLICATION, 2019–2023 (USD MILLION)
- TABLE 79 NORTH AMERICA: MARKET, BY APPLICATION, 2024–2029 (USD MILLION)
- TABLE 80 NORTH AMERICA: MARKET, BY COUNTRY, 2019–2023 (USD MILLION)
- TABLE 81 NORTH AMERICA: MARKET, BY COUNTRY, 2024–2029 (USD MILLION)
- TABLE 82 NORTH AMERICA: MARKET, BY COUNTRY, 2019–2023 (MW)
- TABLE 83 NORTH AMERICA: MARKET, BY COUNTRY, 2024–2029 (MW)
- TABLE 84 US: MARKET, BY APPLICATION, 2019–2023 (USD MILLION)
- TABLE 85 US: BIFACIAL SOLAR MARKET, BY APPLICATION, 2024–2029 (USD MILLION)
- TABLE 86 CANADA: MARKET, BY APPLICATION, 2019–2023 (USD MILLION)
- TABLE 87 CANADA: MARKET, BY APPLICATION, 2024–2029 (USD MILLION)
- TABLE 88 MEXICO: MARKET, BY APPLICATION, 2019–2023 (USD MILLION)
- TABLE 89 MEXICO: MARKET, BY APPLICATION, 2024–2029 (USD MILLION)
- TABLE 90 EUROPE: MARKET, BY TYPE, 2019–2023 (USD MILLION)
- TABLE 91 EUROPE: BIFACIAL SOLAR MARKET, BY TYPE, 2024–2029 (USD MILLION)
- TABLE 92 EUROPE: MARKET, BY FRAME TYPE, 2019–2023 (USD MILLION)
- TABLE 93 EUROPE: MARKET, BY FRAME TYPE, 2024–2029 (USD MILLION)
- TABLE 94 EUROPE: MARKET, BY CELL TECHNOLOGY, 2019–2023 (USD MILLION)
- TABLE 95 EUROPE: MARKET, BY CELL TECHNOLOGY, 2024–2029 (USD MILLION)
- TABLE 96 EUROPE: MARKET, BY APPLICATION, 2019–2023 (USD MILLION)
- TABLE 97 EUROPE: MARKET, BY APPLICATION, 2024–2029 (USD MILLION)
- TABLE 98 EUROPE: MARKET, BY COUNTRY, 2019–2023 (USD MILLION)
- TABLE 99 EUROPE: MARKET, BY COUNTRY, 2024–2029 (USD MILLION)
- TABLE 100 EUROPE: MARKET, BY COUNTRY, 2019–2023 (MW)
- TABLE 101 EUROPE: MARKET, BY COUNTRY, 2024–2029 (MW)
- TABLE 102 GERMANY: MARKET, BY APPLICATION, 2019–2023 (USD MILLION)
- TABLE 103 GERMANY: MARKET, BY APPLICATION, 2024–2029 (USD MILLION)
- TABLE 104 ITALY: MARKET, BY APPLICATION, 2019–2023 (USD MILLION)
- TABLE 105 ITALY: MARKET, BY APPLICATION, 2024–2029 (USD MILLION)
- TABLE 106 NETHERLANDS: MARKET, BY APPLICATION, 2019–2023 (USD MILLION)
- TABLE 107 NETHERLANDS: MARKET, BY APPLICATION, 2024–2029 (USD MILLION)
- TABLE 108 SPAIN: MARKET, BY APPLICATION, 2019–2023 (USD MILLION)
- TABLE 109 SPAIN: MARKET, BY APPLICATION, 2024–2029 (USD MILLION)
- TABLE 110 FRANCE: MARKET, BY APPLICATION, 2019–2023 (USD MILLION)
- TABLE 111 FRANCE: MARKET, BY APPLICATION, 2024–2029 (USD MILLION)
- TABLE 112 REST OF EUROPE: MARKET, BY APPLICATION, 2019–2023 (USD MILLION)
- TABLE 113 REST OF EUROPE: MARKET, BY APPLICATION, 2024–2029 (USD MILLION)
- TABLE 114 REST OF THE WORLD: BIFACIAL SOLAR MARKET, BY TYPE, 2019–2023 (USD MILLION)
- TABLE 115 REST OF THE WORLD: MARKET, BY TYPE, 2024–2029 (USD MILLION)
- TABLE 116 REST OF THE WORLD: MARKET, BY FRAME TYPE, 2019–2023 (USD MILLION)
- TABLE 117 REST OF THE WORLD: MARKET, BY FRAME TYPE, 2024–2029 (USD MILLION)
- TABLE 118 REST OF THE WORLD: MARKET, BY CELL TECHNOLOGY, 2019–2023 (USD MILLION)
- TABLE 119 REST OF THE WORLD: MARKET, BY CELL TECHNOLOGY, 2024–2029 (USD MILLION)
- TABLE 120 REST OF THE WORLD: MARKET, BY APPLICATION, 2019–2023 (USD MILLION)
- TABLE 121 REST OF THE WORLD: MARKET, BY APPLICATION, 2024–2029 (USD MILLION)
- TABLE 122 REST OF THE WORLD: MARKET, BY COUNTRY, 2019–2023 (USD MILLION)
- TABLE 123 REST OF THE WORLD: MARKET, BY COUNTRY, 2024–2029 (USD MILLION)
- TABLE 124 REST OF THE WORLD: MARKET, BY COUNTRY, 2019–2023 (MW)
- TABLE 125 REST OF THE WORLD: MARKET, BY COUNTRY, 2024–2029 (MW)
- TABLE 126 MARKET: OVERVIEW OF STRATEGIES ADOPTED BY KEY PLAYERS, 2019–2024
- TABLE 127 BIFACIAL SOLAR MARKET: DEGREE OF COMPETITION, 2023
- TABLE 128 MARKET EVALUATION FRAMEWORK, 2019–2023
- TABLE 129 MARKET: REGIONAL FOOTPRINT, 2023
- TABLE 130 MARKET: TYPE FOOTPRINT, 2023
- TABLE 131 MARKET: FRAME TYPE FOOTPRINT, 2023
- TABLE 132 MARKET: CELL TECHNOLOGY FOOTPRINT
- TABLE 133 MARKET: PANEL TYPE FOOTPRINT
- TABLE 134 MARKET: APPLICATION FOOTPRINT
- TABLE 135 MARKET: LIST OF KEY STARTUPS/SMES
- TABLE 136 MARKET: COMPETITIVE BENCHMARKING OF STARTUPS/SMES
- TABLE 137 MARKET: PRODUCT LAUNCHES, JANUARY 2019–MARCH 2024
- TABLE 138 MARKET: DEALS, JANUARY 2019–MARCH 2024
- TABLE 139 MARKET: EXPANSIONS, JANUARY 2019–MARCH 2024
- TABLE 140 MARKET: OTHERS, JANUARY 2019–MARCH 2024
- TABLE 141 LONGI: COMPANY OVERVIEW
- TABLE 142 LONGI: PRODUCTS/SOLUTIONS/SERVICES OFFERED
- TABLE 143 LONGI: PRODUCT LAUNCHES
- TABLE 144 LONGI: DEALS
- TABLE 145 LONGI: OTHERS
- TABLE 146 CANADIAN SOLAR: COMPANY OVERVIEW
- TABLE 147 CANADIAN SOLAR: PRODUCTS/SOLUTIONS/SERVICES OFFERED
- TABLE 148 CANADIAN SOLAR: PRODUCT LAUNCHES
- TABLE 149 CANADIAN SOLAR: DEALS
- TABLE 150 CANADIAN SOLAR: EXPANSIONS
- TABLE 151 CANADIAN SOLAR: OTHERS
- TABLE 152 TRINASOLAR: COMPANY OVERVIEW
- TABLE 153 TRINASOLAR: PRODUCTS/SOLUTIONS/SERVICES OFFERED
- TABLE 154 TRINASOLAR: PRODUCT LAUNCHES
- TABLE 155 TRINASOLAR: DEALS
- TABLE 156 TRINASOLAR: EXPANSIONS
- TABLE 157 TRINASOLAR: OTHERS
- TABLE 158 SHARP CORPORATION: COMPANY OVERVIEW
- TABLE 159 SHARP CORPORATION: PRODUCTS/SOLUTIONS/SERVICES OFFERED
- TABLE 160 SHARP CORPORATION: PRODUCT LAUNCHES
- TABLE 161 SHARP CORPORATION: DEALS
- TABLE 162 SHARP CORPORATION: OTHERS
- TABLE 163 JA SOLAR TECHNOLOGY CO., LTD.: COMPANY OVERVIEW
- TABLE 164 JA SOLAR TECHNOLOGY CO., LTD.: PRODUCTS/SOLUTIONS/SERVICES OFFERED
- TABLE 165 JA SOLAR TECHNOLOGY CO., LTD.: PRODUCT LAUNCHES
- TABLE 166 JA SOLAR TECHNOLOGY CO., LTD.: DEALS
- TABLE 167 JA SOLAR TECHNOLOGY CO., LTD.: OTHERS
- TABLE 168 JINKO SOLAR: COMPANY OVERVIEW
- TABLE 169 JINKO SOLAR: PRODUCTS/SOLUTIONS/SERVICES OFFERED
- TABLE 170 JINKO SOLAR: PRODUCT LAUNCHES
- TABLE 171 JINKO SOLAR: DEALS
- TABLE 172 JINKO SOLAR: EXPANSIONS
- TABLE 173 JINKO SOLAR: OTHERS
- TABLE 174 ADANI GROUP: COMPANY OVERVIEW
- TABLE 175 ADANI GROUP: PRODUCTS/SOLUTIONS/SERVICES OFFERED
- TABLE 176 ADANI GROUP: PRODUCT LAUNCHES
- TABLE 177 ADANI GROUP: DEALS
- TABLE 178 FIRST SOLAR: COMPANY OVERVIEW
- TABLE 179 FIRST SOLAR: PRODUCTS/SOLUTIONS/SERVICES OFFERED
- TABLE 180 FIRST SOLAR: DEALS
- TABLE 181 FIRST SOLAR: EXPANSIONS
- TABLE 182 FIRST SOLAR: OTHERS
- TABLE 183 RENEWSYS INDIA PVT. LTD.: BUSINESS OVERVIEW
- TABLE 184 RENEWSYS INDIA PVT. LTD.: PRODUCTS/SOLUTIONS/SERVICES OFFERED
- TABLE 185 RENEWSYS INDIA PVT. LTD.: PRODUCT LAUNCHES
- TABLE 186 RENEWSYS INDIA PVT. LTD.: DEALS
- TABLE 187 RENEWSYS INDIA PVT. LTD.: EXPANSIONS
- TABLE 188 HANWHA QCELLS: COMPANY OVERVIEW
- TABLE 189 HANWHA QCELLS: PRODUCTS/SOLUTIONS/SERVICES OFFERED
- TABLE 190 HANWHA QCELLS: DEALS
- TABLE 191 HANWHA QCELLS: EXPANSIONS
- TABLE 192 HANWHA QCELLS: OTHERS
- TABLE 193 TALESUN SOLAR CO., LTD.: COMPANY OVERVIEW
- TABLE 194 TALESUN SOLAR CO., LTD.: PRODUCTS/SOLUTIONS/SERVICES OFFERED
- TABLE 195 TALESUN SOLAR CO., LTD.: DEALS
- TABLE 196 TALESUN SOLAR CO., LTD.: EXPANSIONS
- TABLE 197 TALESUN SOLAR CO., LTD.: OTHERS
- TABLE 198 HD HYUNDAI ENERGY SOLUTIONS., LTD.: COMPANY OVERVIEW
- TABLE 199 HYUNDAI ENERGY SOLUTIONS., LTD.: PRODUCTS/SOLUTIONS/SERVICES OFFERED
- TABLE 200 HD HYUNDAI ENERGY SSOLUTIONS., LTD.: EXPANSIONS
- TABLE 201 CHINT GROUP: COMPANY OVERVIEW
- TABLE 202 CHINT GROUP: PRODUCTS/SOLUTIONS/SERVICES OFFERED
- TABLE 203 CHINT GROUP: DEALS
- TABLE 204 CHINT GROUP: OTHERS
- TABLE 205 SOLAREDGE: COMPANY OVERVIEW
- TABLE 206 SOLAREDGE: PRODUCTS/SOLUTIONS/SERVICES OFFERED
- TABLE 207 TATA POWER SOLAR SYSTEMS LTD.: COMPANY OVERVIEW
- TABLE 208 TATA POWER SOLAR SYSTEMS LTD.: PRODUCTS/SOLUTIONS/SERVICES OFFERED
- TABLE 209 TATA POWER SOLAR SYSTEMS LTD.: PRODUCT LAUNCHES
- TABLE 210 TATA POWER SOLAR SYSTEMS LTD.: DEALS
- TABLE 211 TATA POWER SOLAR SYSTEMS LTD.: EXPANSIONS
- TABLE 212 TATA POWER SOLAR SYSTEMS LTD.: OTHERS
- FIGURE 1 BIFACIAL SOLAR MARKET: RESEARCH DESIGN
- FIGURE 2 SOLAR MARKET: DATA TRIANGULATION
- FIGURE 3 BIFACIAL SOLAR MARKET: BOTTOM-UP APPROACH
- FIGURE 4 SOLAR MARKET: TOP-DOWN APPROACH
- FIGURE 5 SOLAR MARKET: DEMAND-SIDE ANALYSIS
- FIGURE 6 KEY METRICS CONSIDERED FOR ASSESSING SUPPLY OF BIFACIAL SOLAR PANELS
- FIGURE 7 SOLAR MARKET: SUPPLY-SIDE ANALYSIS
- FIGURE 8 MARKET SHARE ANALYSIS OF BIFACIAL SOLAR MARKET, 2023
- FIGURE 9 ASIA PACIFIC ACCOUNTED FOR LARGEST SHARE IN SOLAR MARKET IN 2023
- FIGURE 10 DUAL-GLASS SEGMENT TO LEAD MARKET DURING FORECAST PERIOD
- FIGURE 11 FRAMED SEGMENT TO REGISTER HIGHER GROWTH IN MARKET DURING FORECAST PERIOD
- FIGURE 12 PASSIVATED EMITTER REAR CONTACT (PERC) SEGMENT TO DOMINATE MARKET
- FIGURE 13 UTILITIES SEGMENT TO BE LARGEST APPLICATION OF BIFACIAL SOLAR DURING FORECAST PERIOD
- FIGURE 14 DECREASING COST OF SOLAR SYSTEMS TO BOOST MARKET GROWTH BETWEEN 2023 AND 2029
- FIGURE 15 ASIA PACIFIC TO WITNESS HIGHEST GROWTH DURING FORECAST PERIOD
- FIGURE 16 DUAL-GLASS SEGMENT TO ACCOUNT FOR LARGER MARKET SHARE
- FIGURE 17 FRAMED SEGMENT TO ACCOUNT FOR DOMINANT SHARE DURING FORECAST PERIOD
- FIGURE 18 PASSIVATED EMITTER REAR CONTACT (PERC) SEGMENT TO ACCOUNT FOR LARGEST SHARE IN MARKET
- FIGURE 19 UTILITIES SEGMENT TO BE LARGEST APPLICATION OF BIFACIAL SOLAR
- FIGURE 20 BIFACIAL SOLAR MARKET: DRIVERS, RESTRAINTS, OPPORTUNITIES, AND CHALLENGES
- FIGURE 21 REMUNERATION SETTINGS FOR UTILITY-SCALE RENEWABLE PROJECTS
- FIGURE 22 RENEWABLE ELECTRICITY CAPACITY ADDITION
- FIGURE 23 TRENDS/DISRUPTIONS IMPACTING CUSTOMERS' BUSINESSES
- FIGURE 24 AVERAGE PRICE TREND OF BIFACIAL SOLAR, BY REGION, 2023–2029 (USD/WP)
- FIGURE 25 INDICATIVE PRICE TREND OF BIFACIAL SOLAR, BY CELL TECHNOLOGY, 2023–2029 (USD/WP)
- FIGURE 26 SOLAR MARKET: SUPPLY CHAIN ANALYSIS
- FIGURE 27 ECOSYSTEM MAP
- FIGURE 28 MARKET: INNOVATIONS AND PATENT REGISTRATIONS, 2013–2023
- FIGURE 29 EXPORT DATA FOR HS CODE 854143 FOR TOP FIVE COUNTRIES, 2022–2023 (USD THOUSAND)
- FIGURE 30 IMPORT DATA FOR HS CODE 854143 FOR TOP FIVE COUNTRIES, 2022–2023 (USD THOUSAND)
- FIGURE 31 EXPORT DATA FOR HS CODE 854142 FOR TOP FIVE COUNTRIES, 2022–2023 (USD THOUSAND)
- FIGURE 32 IMPORT DATA FOR HS CODE 854142 FOR TOP FIVE COUNTRIES, 2022–2023 (USD THOUSAND)
- FIGURE 33 BIFACIAL SOLAR MARKET: PORTER'S FIVE FORCES ANALYSIS
- FIGURE 34 INFLUENCE OF KEY STAKEHOLDERS ON BUYING PROCESS, BY TYPE
- FIGURE 35 KEY BUYING CRITERIA FOR BIFACIAL SOLAR
- FIGURE 36 INVESTMENT AND FUNDING SCENARIO (USD MILLION)
- FIGURE 37 BIFACIAL SOLAR MARKET, BY FRAME TYPE (2023)
- FIGURE 38 SOLAR MARKET, BY CELL TECHNOLOGY (2023)
- FIGURE 39 SOLAR MARKET, BY APPLICATION (2023)
- FIGURE 40 ASIA PACIFIC TO REGISTER HIGHEST CAGR IN MARKET DURING FORECAST PERIOD
- FIGURE 41 BIFACIAL SOLAR MARKET SHARE, BY REGION (2023)
- FIGURE 42 ASIA PACIFIC: SOLAR MARKET SNAPSHOT
- FIGURE 43 NORTH AMERICA: SOLAR MARKET SNAPSHOT
- FIGURE 44 BIFACIAL SOLAR MARKET SHARE ANALYSIS, 2023
- FIGURE 45 MARKET: SEGMENTAL REVENUE ANALYSIS, 2019–2023
- FIGURE 46 MARKET: COMPANY VALUATION, 2024
- FIGURE 47 SOLAR MARKET: FINANCIAL METRICS, 2024
- FIGURE 48 BIFACIAL SOLAR MARKET: COMPARATIVE ANALYSIS OF BRAND/PRODUCT
- FIGURE 49 SOLAR MARKET: COMPANY EVALUATION MATRIX (KEY PLAYERS), 2023
- FIGURE 50 SOLAR MARKET: PRODUCT FOOTPRINT, 2023
- FIGURE 51 MARKET: MARKET FOOTPRINT, 2023
- FIGURE 52 MARKET: COMPANY EVALUATION MATRIX (STARTUPS/SMES), 2023
- FIGURE 53 LONGI: COMPANY SNAPSHOT
- FIGURE 54 CANDIAN SOLAR: COMPANY SNAPSHOT
- FIGURE 55 TRINASOLAR: COMPANY SNAPSHOT
- FIGURE 56 SHARP CORPORATION: COMPANY SNAPSHOT
- FIGURE 57 JA SOLAR TECHNOLOGY CO., LTD.: COMPANY SNAPSHOT
- FIGURE 58 JINKO SOLAR: COMPANY SNAPSHOT
- FIGURE 59 ADANI GROUP: COMPANY SNAPSHOT
- FIGURE 60 FIRST SOLAR: COMPANY SNAPSHOT
- FIGURE 61 SOLAR EDGE: COMPANY SNAPSHOT
The study involved major activities in estimating the current size of the bifacial solar market. Exhaustive secondary research was done to collect information on the peer and parent markets. The next step was to validate these findings, assumptions, and sizing with industry experts across the value chain through primary research. Both top-down and bottom-up approaches were employed to estimate the total market size. Thereafter, market breakdown and data triangulation were used to estimate the market size of the segments and subsegments.
Secondary Research
This research study on the market involved the use of extensive secondary sources, directories, and databases, such as Hoover’s, Bloomberg, Factiva, IRENA, International Energy Agency, and Statista Industry Journal, to collect and identify information useful for a technical, market-oriented, and commercial study of the market. The other secondary sources included annual reports, press releases & investor presentations of companies, white papers, certified publications, articles by recognized authors, manufacturer associations, trade directories, and databases.
Primary Research
The bifacial solar market comprises several stakeholders, such as bifacial solar manufacturers, technology providers, and technical support providers in the supply chain. The demand side of this market is characterized by the rising demand for storage solutions in various applications such as energy, mobility, industrial, and transportation. The supply side is characterized by rising demand for contracts from the industrial sector and mergers & acquisitions among big players. Various primary sources from both the supply and demand sides of the market were interviewed to obtain qualitative and quantitative information. Following is the breakdown of primary respondents:
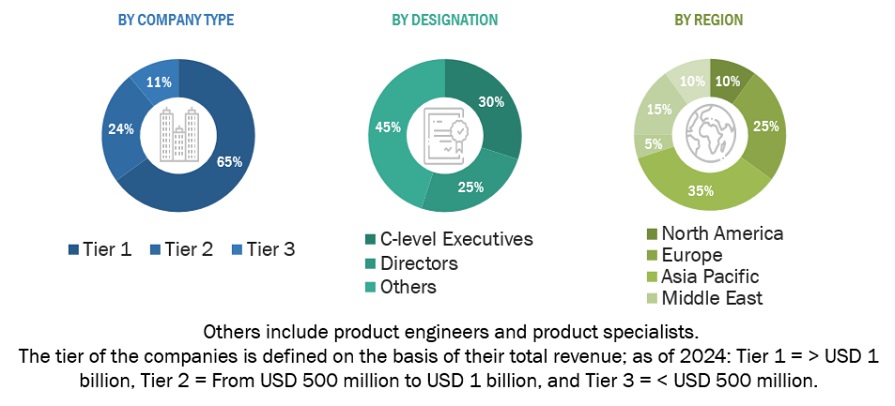
To know about the assumptions considered for the study, download the pdf brochure
Market Size Estimation
Both top-down and bottom-up approaches were used to estimate and validate the total size of the market. These methods were also used extensively to estimate the size of various subsegments in the market. The research methodology used to estimate the market size includes the following:
- The key players in the industry and market have been identified through extensive secondary research, and their market share has been determined through primary and secondary research.
- The industry’s value chain and market size, in terms of value, have been determined through both primary and secondary research processes.
- All percentage shares, splits, and breakdowns have been determined using secondary sources and verified through primary sources.
Bifacial Solar Market Size: Top-Down Approach
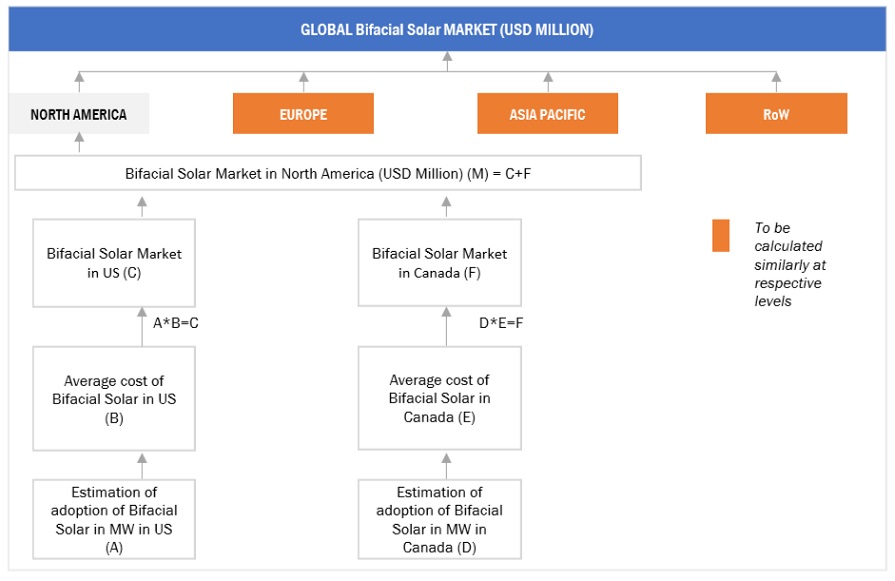
To know about the assumptions considered for the study, Request for Free Sample Report
Bifacial Solar Market Size: Bottom-Up Approach
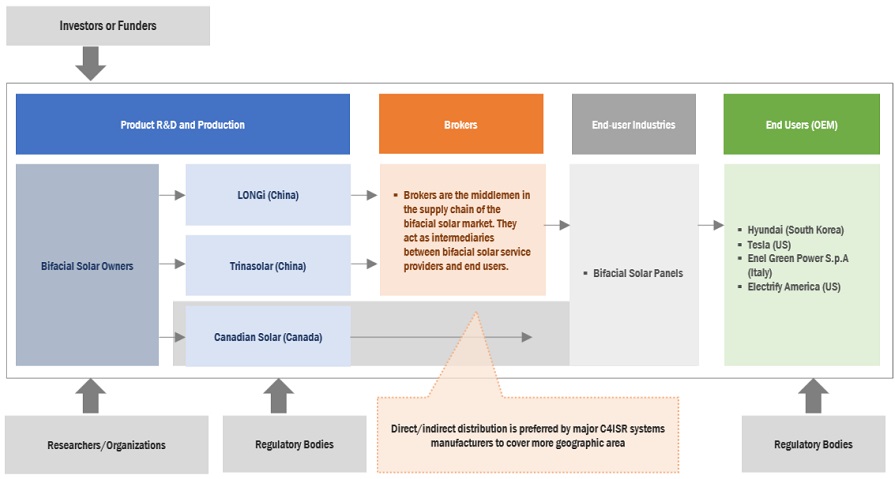
Data Triangulation
After arriving at the overall market size from the above estimation process, the total market has been split into several segments and subsegments. Data triangulation and market breakdown processes have been employed to complete the overall market engineering process and arrive at the exact statistics for all the segments and sub-segments, wherever applicable. The data has been triangulated by studying various factors and trends from both the demand- and supply sides. Along with this, the market has been validated using both the top-down and bottom-up approaches.
Market Definition
The bifacial solar market is a leading segment of the solar energy sector, focusing on the design, manufacturing, and use of bifacial solar panels. These panels are engineered to capture sunlight on both their front and back surfaces, significantly increasing energy production compared to traditional monofacial panels. By utilizing both direct sunlight and light reflected from the ground and nearby surfaces, bifacial panels offer enhanced efficiency and output. This dual-sided capability is particularly advantageous for installations over reflective surfaces such as snow, sand, or concrete, making them ideal for various applications, including large-scale solar farms, commercial rooftops, and residential setups. As global demand for efficient and cost-effective renewable energy solutions grows, bifacial solar technology is emerging as a key driver of industry progress.
Key Stakeholders
- Bifacial solar Dealers and Suppliers
- Government and Research Organizations
- Power and Energy Associations
- Repairs and Maintenance Service Providers
- State and National Regulatory Authorities
- Research And Consulting Companies in the Clean Energy Generation Sector
- Organizations, Forums, Alliances, And Associations
- Industrial Authorities and Association
State and National Regulatory Authorities Objectives of the Study
- To forecast the bifacial solar Market based on type, frame type, cell technology, application and region in terms of value
- To describe the market for four key regions: Asia Pacific, North America, Europe, and Rest of the World, along with their country-level market sizes in terms of value
- To provide detailed information regarding key drivers, restraints, opportunities, and challenges influencing the growth of the market
- To strategically analyze the micromarkets with respect to individual growth trends, prospects, and contributions to the overall market size
- To provide the supply chain analysis, trends/disruptions impacting customers’ businesses, market map, ecosystem analysis, tariffs and regulations, pricing analysis, patent analysis, case study analysis, technology analysis, key conferences and events, trade analysis, Porter’s five forces analysis, key stakeholders and buying criteria, and regulatory analysis of Market
- To analyze opportunities for stakeholders in the bifacial solar and draw a competitive landscape of the market
- To benchmark market players using the company evaluation matrix, which analyzes market players on broad categories of business and product strategies adopted by them
- To compare key market players with respect to product specifications and utility
- To strategically profile key players and comprehensively analyze their market rankings and core competencies
- To analyze competitive developments, such as contracts & agreements, investments & expansions, mergers & acquisitions, new product launches, partnerships, joint ventures & collaborations, in the Market.
Available Customizations:
With the given market data, MarketsandMarkets offers customizations according to the specific requirements of companies. The following customization options are available for the report:
Product Analysis
- Product Matrix, which provides a detailed comparison of the product portfolio of each company
Company Information
- Detailed analyses and profiling of additional market players
Growth opportunities and latent adjacency in Bifacial Solar Market