Autonomous Enterprise Market

Autonomous Enterprise Market by Solutions (Robotic Process Automation, Autonomous Networks, Accounts Automation, Security Automation), Business Functions (IT, Sales & Marketing, Supply Chain & Operations, Accounting & Finance) - Global Forecast to 2029

Report Code: TC 9161 Sep, 2024, by marketsandmarkets.com

[276 Pages Report] The autonomous enterprise market is projected to expand from USD 50.5 billion in 2024 to USD 114.0 billion by 2029, at a CAGR of 17.6% from 2024 to 2029.

The constant growth and development of AI and ML are the primary reasons fueling the autonomous enterprise market. AI and ML technologies present in modern business applications have evolved, and companies can now automate complex processes that used to require input from the system. Most of these technologies not only automate actions but also perform predictive analytics, make decisions, and learn from events. This is especially true for new AI or ML models with enhanced accuracy and better handling of big data. The more enterprises can automate complex processes, the more they can enhance efficiency and accuracy. This technological advancement assists corporations in making independent decisions and taking actions without significant human interference.

Autonomous Enterprise Market

To know about the assumptions considered for the study, Request for Free Sample Report

Autonomous Enterprise Market Opportunities

To know about the assumptions considered for the study, download the pdf brochure

IMPACT OF AI/GEN AI ON AUTONOMOUS ENTERPRISE MARKET

The incorporation of generative Al in autonomous enterprises is a major step toward enhancing functionality and empowering innovation. Generative Al applies to the creation of brand-new content, designs, models, and solutions, providing a cognitive boost to the decision-making power of autonomous systems. By adopting generative Al, several activities that demand creativity can be accomplished through machine intervention; these include product design, business process redesign, and specific marketing campaigns. This integration enables autonomous enterprises to perform at a level beyond the simple automation of existing processes, helping them work more innovatively and be more predictive and responsive to change than before. Additionally, generative Al can apply sophisticated business models for various scenarios. It can aid businesses in gaining more insights into an enterprise and help them make accurate decisions based on data.

Autonomous Enterprise Market Impact

AUTONOMOUS ENTERPRISE MARKET DYNAMICS

Driver: Convergence of cloud, data, and IoT infrastructures

The integration of cloud, data, IoT, and AI applications has been enhancing the idea of automated systems across different sectors. This is where convergence takes place, leading to the emergence of a wholly new environment where physical environments, business processes, and IT operations are being revolutionized. In the physical world, autonomy systems are set to transform sectors such as logistics, manufacturing, and mining with enhanced performance, lowered risk, and improved value creation. At the same time, a digital transformation is taking place within business organizations. Robotic process automation or RPA, when underpinned by Al-based intelligent process automation, automates repetitive activities and responds to changes in business conditions. Sophisticated automation, aided by process intelligence tools, will lead the way toward establishing autonomous enterprises.

In aggregate, the outcomes of these technological developments lay the groundwork for creating self-sustaining organizations where intelligent systems can operate on their own and self-optimize in a range of fields.

Restraint: Concerns related to data privacy

Personal data protection is a critical consideration in management within autonomous enterprises. The tremendous amount of data that is gathered for Al-powered processes gives rise to concerns about data minimization and its retention. Engaging with third-party providers and transferring information to them generates more risk of a breach. In addition, many Al algorithms are black-box models, making it hard to track how an individual’s personal data is used. Some unique and significant tasks include the protection of data and safeguarding them against any forms of access from unauthorized personnel, in addition to the difficult and cumbersome reality of meeting rigorous and stringent data protection regulations. Solving such problems is a complex task that involves the use of good data management practices, proper ethical frameworks for the creation of Al, and ongoing risk evaluation.

Opportunity: Generative Al revolution creating next phase of autonomous enterprises

Generative AI is a relatively new technology that has received a lot of funding, with over USD 2 billion capital outlay in 2022. The valuation of OpenAl at USD 29 billion proved its worth and indicated how much investors and companies spend on this type of innovation. With advancements in technology and automation, organizations are seeking new applications of generative Al to develop fully automated self-sustainable enterprises that can interact with humans seamlessly. Businesses are increasingly implementing generative Al in marketing, customer service, sales, and client relationships. Generative Al can create marketing messages, sales proposals, product concepts, and new advertisements to increase conversion and profitability. Its uses extend beyond business and consumer contexts, encompassing customer relationship management systems, health informatics, and software development. Thus, as generative Al becomes a reality, the prospects of autonomous enterprises are significant and immeasurable.

Challenge: Ethical and legal constraints

As the concept of autonomous enterprise evolves and spreads in society, a number of ethical issues have emerged. The issue of liability or who is to blame when an accident happens in relation to the use of revolutionized systems generates legal concerns. In case something goes wrong with regard to non-adherence to sustainable principles, the guidelines concerning accountability and responsibility must be clearly outlined. Other ethical dilemmas present in this concept include privacy and data security. A rising awareness of data harvesting and analysis outcomes increases the phobias concerning the protection of personal data and their improper use. To address these problems, firms have to employ proper data protections and declare policies for managing data. Ethical decision-making should, therefore, not be restricted to main managerial decisions but also include decision-making logic in intelligent systems. On the one hand, there are problems with the transparency and fairness of the algorithms, and on the other, there are problems with their accountability. These have not lost their relevance as far as the requirements for maintaining public trust in autonomous enterprise systems are concerned.

MARKET ECOSYSTEM

The autonomous enterprise market is highly competitive and comprises many vendors who offer solutions to a specific segment or a niche segment of the market. In recent years, several changes have occurred in the autonomous enterprise market. Currently, the vendors are involved in various partnerships and collaborations to develop comprehensive solutions that address a wide range of requirements. Microsoft (US), IBM (US), PTC (US), AWS (US), SAP (Germany), Cisco (US), HPE (US), and Oracle (US) are some of the major players operating in this ecosystem.

Top Companies in Autonomous Enterprise Market

The process automation application is estimated to lead the autonomous enterprise market during the forecast period.

Process automation refers to the use of technology to automate complex business processes and tasks within an organization. It entails the use of systems and tools, including Robotic Process Automation(RPA), Artificial Intelligence(AI), and Machine Learning(ML) through the automation of combined tasks with little or no human interconnection. Business process automation is also not limited to workflow automation but also applies to the subsequent automation of the processes that occur in different departments of the company. This can range from accounting and staff management to inventory and sales-related services. The integration of AI & ML facilitates these automated procedures to become more refined and efficient over a period of time. When it comes to the application of autonomous enterprises, process automation is critical for improving efficiency, decreasing costs, and maintaining quality.

By region, North America is expected to account for the largest share of the autonomous enterprise market during the forecast period

North America holds the largest revenue share in the autonomous enterprise market. Enterprises in this region are the early adopters of technologies, and most of the North American industry verticals have already gone through digital transformation. This rapid adoption of technologies has led to the generation of huge amounts of data by North American companies, presenting an opportunity for the deployment of autonomous enterprise solutions to maintain and manage such data. The automation of business processes results in less need for manpower and saves a lot of time and cost, enabling companies to focus on business-critical decisions. Industries such as BFSI, telecommunications & IT, transportation & logistics, manufacturing, and media & entertainment are at the forefront of adopting autonomous enterprise solutions. The presence of key players in North America, such as Microsoft, IBM, NICE, and Pegasystems, is also one of the key factors driving the adoption of autonomous enterprise solutions in the region.

Autonomous Enterprise Market Size, and Share

Market Players:

The major players in the autonomous enterprise market include Microsoft (US), IBM (US), Pegasystems (US), Cisco (US), SAP (Germany), and HPE (US). These players have adopted various growth strategies, such as partnerships, agreements, and new product launches & enhancements, to expand their footprint in the autonomous enterprise market.

Get online access to the report on the World's First Market Intelligence Cloud

  • Easy to Download Historical Data & Forecast Numbers
  • Company Analysis Dashboard for high growth potential opportunities
  • Research Analyst Access for customization & queries
  • Competitor Analysis with Interactive dashboard
  • Latest News, Updates & Trend analysis
Request Sample

Scope of the Report

Report Metrics

Details

Market size available for years

2019-2029

Base year considered

2023

Forecast period

2024–2029

Forecast units

Value (USD) Million/Billion

Segments covered

By Offering, Business Function, Application, Vertical, and Region

Regions covered

North America, Europe, Asia Pacific, Middle East & Africa, and Latin America

Companies covered

Microsoft (US), IBM (US), Check Point (US), Pegasystems (US), Cisco (US), SAP (Germany), Atos (France), AWS (US), Oracle (US), HPE (US), Sage (UK), NICE (Israel), Palo Alto Networks (US), Blue Prism (UK), UiPath (New York), Appian (US), Automation Anywhere (US), Tangentia (Canada), Drivenets (Israel), Nintex (US), Synder (US), Fetch.ai (England), AutomationEdge (US), Rocketbot (Chile), Rossum (UK), Digitate (US), and Mendix (US).

This research report categorizes the autonomous enterprise market to forecast revenues and analyze trends in each of the following submarkets:

Based on Offering:
  • Solutions
    • Robotic Process Automation
    • Autonomous Networks
    • Accounts Automation
    • Security Automation
    • Autonomous Agents 
    • Other Solutions
  • Services
    • Professional Services
    • Managed Services
Based On Business Functions:
  • Accounting and Finance
  • IT
  • Human Resource
  • Sales and Marketing
  • Supply Chain and Operations
Based On Applications:
  • Process Automation
  • Customer and Employee Engagement
  • Order Management
  • Credit Evaluation and Management 
  • Predictive Maintenance
  • Other Applications
Based On Vertical:
  • BFSI
  • IT & ITeS
  • Telecom
  • Retail & Ecommerce
  • Media & Entertainment
  • Healthcare
  • Transportation & Logistics
  • Manufacturing
  • Government & Defence
  • Other Verticals
By Region:
  • North America
    • United States (US)
    • Canada
  • Europe
    • United Kingdom (UK)
    • Germany
    • France
    • Italy
    • Spain
    • Nordics
    • Rest of Europe
  • Asia Pacific
    • China
    • Japan
    • India
    • Australia & New Zealand
    • South Korea
    • Rest of Asia Pacific
  • Middle East and Africa
    • Middle East
      • UAE
      • KSA
      • Bahrain
      • Kuwait
      • Rest of Middle East
    • Africa
  • Latin America
    • Brazil
    • Mexico
    • Rest of Latin America

Recent Developments

  • In June 2024, Telefónica Tech and IBM signed a new collaboration agreement to drive the development of AI, analytics, and data management solutions for enterprises.
  • In April 2024, Cloud Software Group and Microsoft signed an eight-year strategic partnership agreement. The agreement will strengthen the go-to-market collaboration for the Citrix virtual application and desktop platform and support the development of new cloud and AI solutions with an integrated product roadmap.
  • In April 2024, Cisco acquired Isovalent, a leader in open-source cloud-native networking and security. Isovalent’s innovative technologies will become a cornerstone of the Cisco Security Cloud vision, an AI-driven, cloud-delivered, integrated security platform designed to accommodate organizations of any size, offering cutting-edge protection against threats in a multi-cloud world.
  • In November 2023, Atos announced the extension of its long-standing partnership with Microsoft to help clients unlock and scale their Microsoft 365 Copilot and generative AI deployments.

Frequently Asked Questions (FAQ):

To speak to our analyst for a discussion on the above findings, click Speak to Analyst

TABLE OF CONTENTS
 
1 INTRODUCTION (Page No. - 30)
    1.1 STUDY OBJECTIVES 
    1.2 MARKET DEFINITION 
    1.3 STUDY SCOPE 
           1.3.1 MARKET SEGMENTATION
           1.3.2 INCLUSIONS AND EXCLUSIONS
           1.3.3 YEARS CONSIDERED
    1.4 CURRENCY CONSIDERED 
    1.5 STAKEHOLDERS 
 
2 RESEARCH METHODOLOGY (Page No. - 34)
    2.1 RESEARCH DATA 
           2.1.1 SECONDARY DATA
                    2.1.1.1 Key data from secondary sources
           2.1.2 PRIMARY DATA
                    2.1.2.1 Breakup of primary interviews
                    2.1.2.2 Key primary interview participants
                    2.1.2.3 Key insights from industry experts
    2.2 MARKET BREAKUP AND DATA TRIANGULATION 
    2.3 MARKET SIZE ESTIMATION METHODOLOGY 
           2.3.1 TOP-DOWN APPROACH
                    2.3.1.1 Supply-side analysis
           2.3.2 BOTTOM-UP APPROACH
           2.3.3 AUTONOMOUS ENTERPRISE MARKET ESTIMATION: DEMAND-SIDE ANALYSIS
    2.4 RESEARCH ASSUMPTIONS 
    2.5 RESEARCH LIMITATIONS 
    2.6 RISK ASSESSMENT 
 
3 EXECUTIVE SUMMARY (Page No. - 43)
 
4 PREMIUM INSIGHTS (Page No. - 46)
    4.1 ATTRACTIVE OPPORTUNITIES FOR PLAYERS IN AUTONOMOUS ENTERPRISE MARKET 
    4.2 MARKET, BY OFFERING, 2024 
    4.3 MARKET, BY SOLUTION, 2024 
    4.4 MARKET, BY SERVICE, 2024 
    4.5 MARKET, BY BUSINESS FUNCTION, 2024 
    4.6 MARKET, BY VERTICAL, 2024 
    4.7 NORTH AMERICA: AUTONOMOUS ENTERPRISE MARKET, BY APPLICATION AND OFFERING, 2024 
 
5 MARKET OVERVIEW AND INDUSTRY TRENDS (Page No. - 50)
    5.1 INTRODUCTION 
    5.2 MARKET DYNAMICS 
           5.2.1 DRIVERS
                    5.2.1.1 Convergence of cloud, data, and IoT infrastructures
                    5.2.1.2 Rising adoption of RPA
           5.2.2 RESTRAINTS
                    5.2.2.1 Concerns related to data privacy
                    5.2.2.2 Discrepancies between expectations and operational capabilities
                    5.2.2.3 High investment costs
           5.2.3 OPPORTUNITIES
                    5.2.3.1 Emergence of generative AI
           5.2.4 CHALLENGES
                    5.2.4.1 Ethical and legal constraints
                    5.2.4.2 Mitigating ethical and practical concerns in autonomous AI enterprise deployment
    5.3 EVOLUTION OF AUTONOMOUS ENTERPRISE 
    5.4 ECOSYSTEM ANALYSIS 
    5.5 CASE STUDY ANALYSIS 
           5.5.1 CASE STUDY 1: KOMATSU AUSTRALIA ACHIEVES END-TO-END AUTOMATION WITH MICROSOFT POWER AUTOMATE
           5.5.2 CASE STUDY 2: SOFTBANK OVERCOMING AUTOMATION BOTTLENECKS AND PIONEERING COMPREHENSIVE PROCESS AUTOMATION
           5.5.3 CASE STUDY 3: AGCO ENHANCES EFFICIENCY AND REDUCES COSTS WITH INTELLIGENT RPA FOR SAP JOURNALING
           5.5.4 CASE STUDY 4: SUN LIFE FINANCIAL STREAMLINING OPERATIONS AND MAXIMIZING ROI WITH PEGASYSTEMS
    5.6 VALUE CHAIN ANALYSIS 
    5.7 REGULATORY LANDSCAPE 
           5.7.1 REGULATORY BODIES, GOVERNMENT AGENCIES, AND OTHER ORGANIZATIONS
    5.8 PATENT ANALYSIS 
           5.8.1 METHODOLOGY
                    5.8.1.1 List of major patents
    5.9 TECHNOLOGY ANALYSIS 
           5.9.1 KEY TECHNOLOGIES
                    5.9.1.1 5G
                    5.9.1.2 Cloud computing
           5.9.2 COMPLEMENTARY TECHNOLOGIES
                    5.9.2.1 Edge computing
                    5.9.2.2 Blockchain
                    5.9.2.3 Artificial intelligence (AI) and machine learning (ML)
           5.9.3 ADJACENT TECHNOLOGIES
                    5.9.3.1 Augmented reality (AR) and virtual reality (VR)
                    5.9.3.2 Big data analytics
                    5.9.3.3 Cybersecurity solutions
    5.1 PRICING ANALYSIS 
           5.10.1 AVERAGE SELLING PRICE TREND OF KEY PLAYERS, BY RPA SOLUTION PER MONTH
           5.10.2 INDICATIVE PRICING ANALYSIS FOR AUTONOMOUS ENTERPRISE ACCOUNT AUTOMATION SOLUTIONS (PER MONTH)
    5.11 PORTER’S FIVE FORCES MODEL 
           5.11.1 THREAT OF NEW ENTRANTS
           5.11.2 THREAT OF SUBSTITUTES
           5.11.3 BARGAINING POWER OF BUYERS
           5.11.4 BARGAINING POWER OF SUPPLIERS
           5.11.5 INTENSITY OF COMPETITIVE RIVALRY
    5.12 TRENDS/DISRUPTIONS IMPACTING CUSTOMER BUSINESS 
    5.13 KEY STAKEHOLDERS AND BUYING CRITERIA 
           5.13.1 KEY STAKEHOLDERS IN BUYING PROCESS
           5.13.2 BUYING CRITERIA
    5.14 CURRENT AND EMERGING BUSINESS MODELS 
    5.15 KEY CONFERENCES AND EVENTS, 2024–2025 
    5.16 TECHNOLOGY ROADMAP FOR AUTONOMOUS ENTERPRISE MARKET 
           5.16.1 AUTONOMOUS ENTERPRISE TECHNOLOGY ROADMAP TILL 2030
                    5.16.1.1 Short-term roadmap (2023–2025)
                    5.16.1.2 Mid-term roadmap (2026–2028)
                    5.16.1.3 Long-term roadmap (2028–2030)
    5.17 BEST PRACTICES FOR AUTONOMOUS ENTERPRISE SOLUTIONS 
    5.18 INVESTMENT AND FUNDING SCENARIO 
    5.19 IMPACT OF AI/GENERATIVE AI ON AUTONOMOUS ENTERPRISE MARKET 
           5.19.1 INTEGRATING GENERATIVE AI IN AUTONOMOUS ENTERPRISE
           5.19.2 USE CASES OF GENERATIVE AI IN AUTONOMOUS ENTERPRISE
           5.19.3 BEST PRACTICES TO LEVERAGE GENERATIVE AI FOR AUTONOMOUS ENTERPRISE
           5.19.4 TREND OF GENERATIVE AI IN AUTONOMOUS ENTERPRISE
           5.19.5 FUTURE OF GENERATIVE AI IN AUTONOMOUS ENTERPRISE
 
6 AUTONOMOUS ENTERPRISE MARKET, BY OFFERING (Page No. - 80)
    6.1 INTRODUCTION 
           6.1.1 OFFERING: AUTONOMOUS ENTERPRISE MARKET DRIVERS
    6.2 SOLUTIONS 
           6.2.1 ROBOTIC PROCESS AUTOMATION (RPA)
                    6.2.1.1 RPA makes enterprises much more responsive and agile
           6.2.2 AUTONOMOUS NETWORKS
                    6.2.2.1 Autonomous networks ensure seamless operation by connecting and optimizing cloud, edge, and IoT system performances
           6.2.3 ACCOUNTS AUTOMATION
                    6.2.3.1 Accounts automation decreases time, labor, and costs and enhances efficiency and accuracy
           6.2.4 SECURITY AUTOMATION
                    6.2.4.1 Security automation uses technology for automated detection, analysis, and response to threats without manual intervention
           6.2.5 AUTONOMOUS AGENTS
                    6.2.5.1 Autonomous agents break down intricate problems into manageable subtasks with minimal or no human intervention
           6.2.6 OTHER SOLUTIONS
    6.3 SERVICES 
           6.3.1 PROFESSIONAL SERVICES
                    6.3.1.1 Expert consulting and implementation for seamless autonomous technology adoption
           6.3.2 MANAGED SERVICES
                    6.3.2.1 Ongoing support and management for optimal autonomous enterprise performance
 
7 AUTONOMOUS ENTERPRISE MARKET, BY BUSINESS FUNCTION (Page No. - 94)
    7.1 INTRODUCTION 
           7.1.1 BUSINESS FUNCTION: AUTONOMOUS ENTERPRISE MARKET DRIVERS
    7.2 ACCOUNTING & FINANCE 
           7.2.1 IMPROVING FORECASTING AND FINANCIAL PLANNING MECHANISMS WITH AUTOMATION
    7.3 IT 
           7.3.1 ENHANCING IT INFRASTRUCTURE WITH INTELLIGENT AUTOMATION
    7.4 HUMAN RESOURCE 
           7.4.1 MANAGING HUMAN CAPITAL TO MAXIMIZE ORGANIZATIONAL OUTCOMES WITH AUTOMATION
    7.5 SALES & MARKETING 
           7.5.1 HELPING IDENTIFY CUSTOMER PREFERENCES AND PREDICT BUYING BEHAVIORS WITH AUTOMATION
    7.6 SUPPLY CHAIN & OPERATIONS 
           7.6.1 PREDICTING DEMAND, MANAGING INVENTORY LEVELS, REDUCING COSTS, AND IMPROVING EFFICIENCY WITH AUTOMATION
 
8 AUTONOMOUS ENTERPRISE MARKET, BY APPLICATION (Page No. - 101)
    8.1 INTRODUCTION 
           8.1.1 APPLICATION: AUTONOMOUS ENTERPRISE MARKET DRIVERS
    8.2 PROCESS AUTOMATION 
           8.2.1 HELPS AUTOMATE COMPLEX BUSINESS PROCESSES AND TASKS
    8.3 CUSTOMER & EMPLOYEE ENGAGEMENT 
           8.3.1 PROVIDES IMPROVED INTERACTIONS DUE TO VIRTUAL ASSISTANCE
    8.4 ORDER MANAGEMENT 
           8.4.1 HELPS AVOID MISTAKES AND DELAYS BY RECEIVING ORDERS FASTER AND ACCURATELY
    8.5 CREDIT EVALUATION & MANAGEMENT 
           8.5.1 ANALYZES VAST AMOUNTS OF FINANCIAL DATA AND PROVIDES ACCURATE CREDIT SCORES AND RISK ASSESSMENTS
    8.6 PREDICTIVE MAINTENANCE 
           8.6.1 HELPS PREVENT PRODUCTION FAILURES AND RELATED EXPENSES
    8.7 OTHER APPLICATIONS 
 
9 AUTONOMOUS ENTERPRISE MARKET, BY VERTICAL (Page No. - 109)
    9.1 INTRODUCTION 
           9.1.1 VERTICAL: AUTONOMOUS ENTERPRISE MARKET DRIVERS
    9.2 BFSI 
           9.2.1 ENHANCING EFFICIENCY AND SECURITY IN BFSI
           9.2.2 BFSI: USE CASES
    9.3 IT & ITES 
           9.3.1 REVOLUTIONIZING IT OPERATIONS AND SERVICE DELIVERY
           9.3.2 IT & ITES: USE CASES
    9.4 TELECOM 
           9.4.1 DRIVING INNOVATION AND RESILIENCE IN TELECOM INDUSTRY
           9.4.2 TELECOM: USE CASES
    9.5 RETAIL & E-COMMERCE 
           9.5.1 TRANSFORMING RETAIL OPERATIONS AND CUSTOMER EXPERIENCES
           9.5.2 RETAIL & E-COMMERCE: USE CASES
    9.6 MEDIA & ENTERTAINMENT 
           9.6.1 PERSONALIZING CONTENT AND OPTIMIZING MEDIA OPERATIONS
           9.6.2 MEDIA & ENTERTAINMENT: USE CASES
    9.7 TRANSPORTATION & LOGISTICS 
           9.7.1 OPTIMIZING LOGISTICS AND ENSURING TIMELY DELIVERIES
           9.7.2 TRANSPORTATION & LOGISTICS: USE CASES
    9.8 HEALTHCARE 
           9.8.1 ENHANCING PATIENT CARE AND OPERATIONAL EFFICIENCY IN HEALTHCARE
           9.8.2 HEALTHCARE: USE CASES
    9.9 MANUFACTURING 
           9.9.1 DRIVING EFFICIENCY AND INNOVATION IN MANUFACTURING
           9.9.2 MANUFACTURING: USE CASES
    9.10 GOVERNMENT & DEFENSE 
           9.10.1 ENHANCING SECURITY AND EFFICIENCY IN GOVERNMENT OPERATIONS
           9.10.2 GOVERNMENT & DEFENSE: USE CASES
    9.11 OTHER VERTICALS 
 
10 AUTONOMOUS ENTERPRISE MARKET, BY REGION (Page No. - 122)
     10.1 INTRODUCTION 
     10.2 NORTH AMERICA 
             10.2.1 MACROECONOMIC OUTLOOK FOR NORTH AMERICA
             10.2.2 US
                       10.2.2.1 Growing adoption of business intelligence, data analytics, and AI to increase demand for autonomous enterprise solutions
             10.2.3 CANADA
                       10.2.3.1 Growing adoption of automation-based technologies to drive market
     10.3 EUROPE 
             10.3.1 MACROECONOMIC OUTLOOK FOR EUROPE
             10.3.2 UK
                       10.3.2.1 Government support and presence of major vendors to drive market
             10.3.3 GERMANY
                       10.3.3.1 Technological advancements and increased adoption of autonomous enterprise solutions to drive market
             10.3.4 FRANCE
                       10.3.4.1 Increasing demand for automation and efficiency in business operations to drive market
             10.3.5 ITALY
                       10.3.5.1 Increasing adoption of Industry 4.0 technologies and government commitment to fostering innovation to drive market
             10.3.6 SPAIN
                       10.3.6.1 Adoption of autonomous enterprises in various sectors to drive market
             10.3.7 NORDIC COUNTRIES
                       10.3.7.1 Strong focus on digitalization, robust talent pool, and supportive government policies to drive market
             10.3.8 REST OF EUROPE
     10.4 ASIA PACIFIC 
             10.4.1 MACROECONOMIC OUTLOOK FOR ASIA PACIFIC
             10.4.2 CHINA
                       10.4.2.1 Increased government investment in new technologies to drive market
             10.4.3 JAPAN
                       10.4.3.1 Advanced infrastructure and government investments in latest technologies to drive market
             10.4.4 INDIA
                       10.4.4.1 Focus on enhancing connectivity and promoting advanced technology usage to drive market
             10.4.5 AUSTRALIA & NEW ZEALAND
                       10.4.5.1 Increasing adoption of emerging technologies to drive market
             10.4.6 SOUTH KOREA
                       10.4.6.1 Strong focus on developing skilled workforce and enhancing digital technology infrastructure to drive market
             10.4.7 REST OF ASIA PACIFIC
     10.5 MIDDLE EAST & AFRICA 
             10.5.1 MACROECONOMIC OUTLOOK FOR MIDDLE EAST & AFRICA
             10.5.2 MIDDLE EAST
                       10.5.2.1 UAE
                                   10.5.2.1.1 Increasing use of AI in healthcare, manufacturing, security, and automotive industries to drive market
                       10.5.2.2 KSA
                                   10.5.2.2.1 Substantial investments in digital infrastructure to drive market
                       10.5.2.3 Bahrain
                                   10.5.2.3.1 Focus of organizations on utilizing automation to achieve strategic objectives to drive market
                       10.5.2.4 Kuwait
                                   10.5.2.4.1 Focus on knowledge-based economy to drive market
                       10.5.2.5 Rest of Middle East
             10.5.3 AFRICA
                       10.5.3.1 Growing focus on digital transformation and innovation to drive market
     10.6 LATIN AMERICA 
             10.6.1 MACROECONOMIC OUTLOOK FOR LATIN AMERICA
             10.6.2 BRAZIL
                       10.6.2.1 Increasing adoption of digital technology to drive market
             10.6.3 MEXICO
                       10.6.3.1 Focus on advancing digital infrastructure to drive market
             10.6.4 REST OF LATIN AMERICA
 
11 COMPETITIVE LANDSCAPE (Page No. - 195)
     11.1 INTRODUCTION 
     11.2 KEY PLAYER STRATEGIES/RIGHT TO WIN 
             11.2.1 OVERVIEW OF STRATEGIES ADOPTED BY KEY AUTONOMOUS ENTERPRISE MARKET VENDORS
     11.3 REVENUE ANALYSIS 
             11.3.1 MICROSOFT
             11.3.2 IBM
             11.3.3 CISCO
             11.3.4 CHECK POINT SOFTWARE
             11.3.5 PEGASYSTEMS
     11.4 MARKET SHARE ANALYSIS 
             11.4.1 MARKET RANKING ANALYSIS
     11.5 COMPANY EVALUATION MATRIX: KEY PLAYERS, 2023 
             11.5.1 STARS
             11.5.2 EMERGING LEADERS
             11.5.3 PERVASIVE PLAYERS
             11.5.4 PARTICIPANTS
             11.5.5 COMPANY FOOTPRINT: KEY PLAYERS, 2023
     11.6 COMPANY EVALUATION MATRIX: STARTUPS/SMES, 2023 
             11.6.1 PROGRESSIVE COMPANIES
             11.6.2 RESPONSIVE COMPANIES
             11.6.3 DYNAMIC COMPANIES
             11.6.4 STARTING BLOCKS
             11.6.5 COMPETITIVE BENCHMARKING: STARTUPS/SMES, 2023
                       11.6.5.1 Detailed list of key startups/SMEs
                       11.6.5.2 Competitive benchmarking of key startups/SMEs
     11.7 COMPETITIVE SCENARIO AND TRENDS 
             11.7.1 PRODUCT LAUNCHES & ENHANCEMENTS
             11.7.2 DEALS
     11.8 BRAND/PRODUCT COMPARISON 
     11.9 COMPANY VALUATION AND FINANCIAL METRICS OF KEY AUTONOMOUS ENTERPRISE MARKET VENDORS 
 
12 COMPANY PROFILES (Page No. - 211)
     12.1 KEY PLAYERS 
             12.1.1 MICROSOFT
                       12.1.1.1 Business overview
                       12.1.1.2 Products/Solutions/Services offered
                       12.1.1.3 Recent developments
                                   12.1.1.3.1 Product launches & enhancements
                                   12.1.1.3.2 Deals
                       12.1.1.4 MnM view
                                   12.1.1.4.1 Key strengths
                                   12.1.1.4.2 Strategic choices
                                   12.1.1.4.3 Weaknesses and competitive threats
             12.1.2 IBM
                       12.1.2.1 Business overview
                       12.1.2.2 Products/Solutions/Services offered
                       12.1.2.3 Recent developments
                                   12.1.2.3.1 Deals
                       12.1.2.4 MnM view
                                   12.1.2.4.1 Key strengths
                                   12.1.2.4.2 Strategic choices
                                   12.1.2.4.3 Weaknesses and competitive threats
             12.1.3 CHECK POINT SOFTWARE
                       12.1.3.1 Business overview
                       12.1.3.2 Products/Solutions/Services offered
                       12.1.3.3 Recent developments
                                   12.1.3.3.1 Product launches & enhancements
                                   12.1.3.3.2 Deals
                       12.1.3.4 MnM view
                                   12.1.3.4.1 Right to win
                                   12.1.3.4.2 Strategic choices
                                   12.1.3.4.3 Weaknesses and competitive threats
             12.1.4 PEGASYSTEMS
                       12.1.4.1 Business overview
                       12.1.4.2 Products/Solutions/Services offered
                       12.1.4.3 Recent developments
                                   12.1.4.3.1 Product launches & enhancements
                                   12.1.4.3.2 Deals
                       12.1.4.4 MnM view
                                   12.1.4.4.1 Key strengths
                                   12.1.4.4.2 Strategic choices
                                   12.1.4.4.3 Weaknesses and competitive threats
             12.1.5 CISCO SYSTEMS
                       12.1.5.1 Business overview
                       12.1.5.2 Products/Solutions/Services offered
                       12.1.5.3 Recent developments
                                   12.1.5.3.1 Deals
                       12.1.5.4 MnM view
                                   12.1.5.4.1 Key strengths
                                   12.1.5.4.2 Strategic choices
                                   12.1.5.4.3 Weaknesses and competitive threats
             12.1.6 SAP
                       12.1.6.1 Business overview
                       12.1.6.2 Products/Solutions/Services offered
                       12.1.6.3 Recent developments
                                   12.1.6.3.1 Deals
             12.1.7 HPE
                       12.1.7.1 Business overview
                       12.1.7.2 Products/Solutions/Services offered
                       12.1.7.3 Recent developments
                                   12.1.7.3.1 Deals
             12.1.8 ATOS
                       12.1.8.1 Business overview
                       12.1.8.2 Products/Solutions/Services offered
                       12.1.8.3 Recent developments
                                   12.1.8.3.1 Product launches & enhancements
                                   12.1.8.3.2 Deals
             12.1.9 ORACLE
                       12.1.9.1 Business overview
                       12.1.9.2 Products/Solutions/Services offered
                       12.1.9.3 Recent developments
                                   12.1.9.3.1 Deals
               12.1.10 AMAZON WEB SERVICES
            12.1.10.1 Business overview
            12.1.10.2 Products/Solutions/Services offered
            12.1.10.3 Recent developments
                     12.1.10.3.1 Deals
               12.1.11 SAGE
               12.1.12 NICE
               12.1.13 PALO ALTO NETWORKS
               12.1.14 BLUE PRISM
               12.1.15 UIPATH
               12.1.16 APPIAN
               12.1.17 AUTOMATION ANYWHERE
     12.2 STARTUPS/SMES 
             12.2.1 TANGENTIA
             12.2.2 DRIVENETS
             12.2.3 NINTEX
             12.2.4 SYNDER
             12.2.5 FETCH.AI
             12.2.6 ROSSUM
             12.2.7 DIGITATE
             12.2.8 MENDIX
             12.2.9 ROCKETBOT
               12.2.10 AUTOMATIONEDGE
 
13 ADJACENT/RELATED MARKETS (Page No. - 259)
     13.1 INTRODUCTION 
     13.2 RPA AND HYPERAUTOMATION MARKET  – GLOBAL FORECAST TO 2027 
             13.2.1 MARKET DEFINITION
             13.2.2 MARKET OVERVIEW
                       13.2.2.1 RPA and hyperautomation market, by component
                       13.2.2.2 RPA and hyperautomation market, by deployment mode
                       13.2.2.3 RPA and hyperautomation market, by organization size
                       13.2.2.4 RPA and hyperautomation market, by business function
                       13.2.2.5 RPA and hyperautomation market, by vertical
                       13.2.2.6 RPA and hyperautomation market, by region
     13.3 SECURITY AUTOMATION MARKET – GLOBAL FORECAST TO 2028 
             13.3.1 MARKET DEFINITION
             13.3.2 MARKET OVERVIEW
                       13.3.2.1 Security automation market, by offering
                       13.3.2.2 Security automation market, by technology
                       13.3.2.3 Security automation market, by application
                       13.3.2.4 Security automation market, by code type
                       13.3.2.5 Security automation market, by vertical
                       13.3.2.6 Security automation market, by region
 
14 APPENDIX (Page No. - 269)
     14.1 DISCUSSION GUIDE 
     14.2 KNOWLEDGESTORE: MARKETSANDMARKETS’ SUBSCRIPTION PORTAL 
     14.3 CUSTOMIZATION OPTIONS 
     14.4 RELATED REPORTS 
     14.5 AUTHOR DETAILS 
 
 
LIST OF TABLES (337 Tables)
 
TABLE 1 USD EXCHANGE RATES, 2021–2023
TABLE 2 KEY PRIMARY INTERVIEW PARTICIPANTS
TABLE 3 RESEARCH ASSUMPTIONS
TABLE 4 RISK ASSESSMENT
TABLE 5 AUTONOMOUS ENTERPRISE MARKET: ECOSYSTEM
TABLE 6 NORTH AMERICA: REGULATORY BODIES, GOVERNMENT AGENCIES, AND OTHER ORGANIZATIONS
TABLE 7 EUROPE: REGULATORY BODIES, GOVERNMENT AGENCIES, AND OTHER ORGANIZATIONS
TABLE 8 ASIA PACIFIC: LIST OF REGULATORY BODIES, GOVERNMENT AGENCIES, AND OTHER ORGANIZATIONS
TABLE 9 REST OF THE WORLD: REGULATORY BODIES, GOVERNMENT AGENCIES, AND OTHER ORGANIZATIONS
TABLE 10 AVERAGE SELLING PRICE OF AUTONOMOUS ENTERPRISE RPA SOLUTION PER MONTH
TABLE 11 INDICATIVE PRICING RANGES FOR AUTONOMOUS ENTERPRISE ACCOUNT AUTOMATION SOLUTIONS
TABLE 12 IMPACT OF EACH FORCE ON AUTONOMOUS ENTERPRISE MARKET
TABLE 13 INFLUENCE OF STAKEHOLDERS ON BUYING PROCESS FOR TOP 3 VERTICALS
TABLE 14 KEY BUYING CRITERIA FOR TOP 3 VERTICALS
TABLE 15 MARKET: DETAILED LIST OF CONFERENCES AND EVENTS, 2024–2025
TABLE 16 MARKET, BY OFFERING, 2019–2023 (USD MILLION)
TABLE 17 MARKET, BY OFFERING, 2024–2029 (USD MILLION)
TABLE 18 MARKET, BY SOLUTION, 2019–2023 (USD MILLION)
TABLE 19 AUTONOMOUS ENTERPRISE MARKET, BY SOLUTION, 2024–2029 (USD MILLION)
TABLE 20 SOLUTIONS: MARKET, BY REGION, 2019–2023 (USD MILLION)
TABLE 21 SOLUTIONS: MARKET, BY REGION, 2024–2029 (USD MILLION)
TABLE 22 ROBOTIC PROCESS AUTOMATION: MARKET, BY REGION, 2019–2023 (USD MILLION)
TABLE 23 ROBOTIC PROCESS AUTOMATION: MARKET, BY REGION, 2024–2029 (USD MILLION)
TABLE 24 AUTONOMOUS NETWORKS: MARKET, BY REGION, 2019–2023 (USD MILLION)
TABLE 25 AUTONOMOUS NETWORKS: MARKET, BY REGION, 2024–2029 (USD MILLION)
TABLE 26 ACCOUNTS AUTOMATION: MARKET, BY REGION, 2019–2023 (USD MILLION)
TABLE 27 ACCOUNTS AUTOMATION: AUTONOMOUS ENTERPRISEMARKET, BY REGION, 2024–2029 (USD MILLION)
TABLE 28 SECURITY AUTOMATION: MARKET, BY REGION, 2019–2023 (USD MILLION)
TABLE 29 SECURITY AUTOMATION: MARKET, BY REGION, 2024–2029 (USD MILLION)
TABLE 30 AUTONOMOUS AGENTS: MARKET, BY REGION, 2019–2023 (USD MILLION)
TABLE 31 AUTONOMOUS AGENTS: MARKET, BY REGION, 2024–2029 (USD MILLION)
TABLE 32 OTHER SOLUTIONS: MARKET, BY REGION, 2019–2023 (USD MILLION)
TABLE 33 OTHER SOLUTIONS: MARKET, BY REGION, 2024–2029 (USD MILLION)
TABLE 34 MARKET, BY SERVICE, 2019–2023 (USD MILLION)
TABLE 35 MARKET, BY SERVICE, 2024–2029 (USD MILLION)
TABLE 36 SERVICES: MARKET, BY REGION, 2019–2023 (USD MILLION)
TABLE 37 SERVICES: MARKET, BY REGION, 2024–2029 (USD MILLION)
TABLE 38 PROFESSIONAL SERVICES: MARKET, BY REGION, 2019–2023 (USD MILLION)
TABLE 39 PROFESSIONAL SERVICES: AUTONOMOUS ENTERPRISE MARKET, BY REGION, 2024–2029 (USD MILLION)
TABLE 40 MANAGED SERVICES: MARKET, BY REGION, 2019–2023 (USD MILLION)
TABLE 41 MANAGED SERVICES: MARKET, BY REGION, 2024–2029 (USD MILLION)
TABLE 42 MARKET, BY BUSINESS FUNCTION, 2019–2023 (USD MILLION)
TABLE 43 MARKET, BY BUSINESS FUNCTION, 2024–2029 (USD MILLION)
TABLE 44 ACCOUNTING & FINANCE: MARKET, BY REGION, 2019–2023 (USD MILLION)
TABLE 45 ACCOUNTING & FINANCE: MARKET, BY REGION, 2024–2029 (USD MILLION)
TABLE 46 IT: MARKET, BY REGION, 2019–2023 (USD MILLION)
TABLE 47 IT: MARKET, BY REGION, 2024–2029 (USD MILLION)
TABLE 48 HUMAN RESOURCE: MARKET, BY REGION, 2019–2023 (USD MILLION)
TABLE 49 HUMAN RESOURCE: MARKET, BY REGION, 2024–2029 (USD MILLION)
TABLE 50 SALES & MARKETING: MARKET, BY REGION, 2019–2023 (USD MILLION)
TABLE 51 SALES & MARKETING: MARKET, BY REGION, 2024–2029 (USD MILLION)
TABLE 52 SUPPLY CHAIN & OPERATIONS: MARKET, BY REGION, 2019–2023 (USD MILLION)
TABLE 53 SUPPLY CHAIN & OPERATIONS: AUTONOMOUS ENTERPRISE MARKET, BY REGION, 2024–2029 (USD MILLION)
TABLE 54 MARKET, BY APPLICATION, 2019–2023 (USD MILLION)
TABLE 55 MARKET, BY APPLICATION, 2024–2029 (USD MILLION)
TABLE 56 PROCESS AUTOMATION: MARKET, BY REGION, 2019–2023 (USD MILLION)
TABLE 57 PROCESS AUTOMATION: MARKET, BY REGION, 2024–2029 (USD MILLION)
TABLE 58 CUSTOMER & EMPLOYEE ENGAGEMENT: MARKET, BY REGION, 2019–2023 (USD MILLION)
TABLE 59 CUSTOMER & EMPLOYEE ENGAGEMENT: MARKET, BY REGION, 2024–2029 (USD MILLION)
TABLE 60 ORDER MANAGEMENT: MARKET, BY REGION, 2019–2023 (USD MILLION)
TABLE 61 ORDER MANAGEMENT: MARKET, BY REGION, 2024–2029 (USD MILLION)
TABLE 62 CREDIT EVALUATION & MANAGEMENT: MARKET, BY REGION, 2019–2023 (USD MILLION)
TABLE 63 CREDIT EVALUATION & MANAGEMENT: MARKET, BY REGION, 2024–2029 (USD MILLION)
TABLE 64 PREDICTIVE MAINTENANCE: MARKET, BY REGION, 2019–2023 (USD MILLION)
TABLE 65 PREDICTIVE MAINTENANCE: MARKET, BY REGION, 2024–2029 (USD MILLION)
TABLE 66 OTHER APPLICATIONS: MARKET, BY REGION, 2019–2023 (USD MILLION)
TABLE 67 OTHER APPLICATIONS: MARKET, BY REGION, 2024–2029 (USD MILLION)
TABLE 68 MARKET, BY VERTICAL, 2019–2023 (USD MILLION)
TABLE 69 MARKET, BY VERTICAL, 2024–2029 (USD MILLION)
TABLE 70 BFSI: MARKET, BY REGION, 2019–2023 (USD MILLION)
TABLE 71 BFSI: MARKET, BY REGION, 2024–2029 (USD MILLION)
TABLE 72 IT & ITES: MARKET, BY REGION, 2019–2023 (USD MILLION)
TABLE 73 IT & ITES: MARKET, BY REGION, 2024–2029 (USD MILLION)
TABLE 74 TELECOM: MARKET, BY REGION, 2019–2023 (USD MILLION)
TABLE 75 TELECOM: MARKET, BY REGION, 2024–2029 (USD MILLION)
TABLE 76 RETAIL & E-COMMERCE: MARKET, BY REGION, 2019–2023 (USD MILLION)
TABLE 77 RETAIL & E-COMMERCE: AUTONOMOUS ENTERPRISE MARKET, BY REGION, 2024–2029 (USD MILLION)
TABLE 78 MEDIA & ENTERTAINMENT: MARKET, BY REGION, 2019–2023 (USD MILLION)
TABLE 79 MEDIA & ENTERTAINMENT: MARKET, BY REGION, 2024–2029 (USD MILLION)
TABLE 80 TRANSPORTATION & LOGISTICS: MARKET, BY REGION, 2019–2023 (USD MILLION)
TABLE 81 TRANSPORTATION & LOGISTICS: MARKET, BY REGION, 2024–2029 (USD MILLION)
TABLE 82 HEALTHCARE: MARKET, BY REGION, 2019–2023 (USD MILLION)
TABLE 83 HEALTHCARE: MARKET, BY REGION, 2024–2029 (USD MILLION)
TABLE 84 MANUFACTURING: MARKET, BY REGION, 2019–2023 (USD MILLION)
TABLE 85 MANUFACTURING: AUTONOMOUS ENTERPRISE MARKET, BY REGION, 2024–2029 (USD MILLION)
TABLE 86 GOVERNMENT & DEFENSE: MARKET, BY REGION, 2019–2023 (USD MILLION)
TABLE 87 GOVERNMENT & DEFENSE: MARKET, BY REGION, 2024–2029 (USD MILLION)
TABLE 88 OTHER VERTICALS: MARKET, BY REGION, 2019–2023 (USD MILLION)
TABLE 89 OTHER VERTICALS: MARKET, BY REGION, 2024–2029 (USD MILLION)
TABLE 90 MARKET, BY REGION, 2019–2023 (USD MILLION)
TABLE 91 MARKET, BY REGION, 2024–2029 (USD MILLION)
TABLE 92 NORTH AMERICA: MARKET, BY OFFERING, 2019–2023 (USD MILLION)
TABLE 93 NORTH AMERICA: MARKET, BY OFFERING, 2024–2029 (USD MILLION)
TABLE 94 NORTH AMERICA: MARKET, BY SOLUTION, 2019–2023 (USD MILLION)
TABLE 95 NORTH AMERICA: MARKET, BY SOLUTION, 2024–2029 (USD MILLION)
TABLE 96 NORTH AMERICA: MARKET, BY SERVICE, 2019–2023 (USD MILLION)
TABLE 97 NORTH AMERICA: MARKET, BY SERVICE, 2024–2029 (USD MILLION)
TABLE 98 NORTH AMERICA: MARKET, BY BUSINESS FUNCTION, 2019–2023 (USD MILLION)
TABLE 99 NORTH AMERICA: AUTONOMOUS ENTERPRISE MARKET, BY BUSINESS FUNCTION, 2024–2029 (USD MILLION)
TABLE 100 NORTH AMERICA: MARKET, BY APPLICATION, 2019–2023 (USD MILLION)
TABLE 101 NORTH AMERICA: MARKET, BY APPLICATION, 2024–2029 (USD MILLION)
TABLE 102 NORTH AMERICA: MARKET, BY VERTICAL, 2019–2023 (USD MILLION)
TABLE 103 NORTH AMERICA: MARKET, BY VERTICAL, 2024–2029 (USD MILLION)
TABLE 104 NORTH AMERICA: MARKET, BY COUNTRY, 2019–2023 (USD MILLION)
TABLE 105 NORTH AMERICA: MARKET, BY COUNTRY, 2024–2029 (USD MILLION)
TABLE 106 US: AUTONOMOUS ENTERPRISE MARKET, BY OFFERING, 2019–2023 (USD MILLION)
TABLE 107 US: MARKET, BY OFFERING, 2024–2029 (USD MILLION)
TABLE 108 US: MARKET, BY SOLUTION, 2019–2023 (USD MILLION)
TABLE 109 US: MARKET, BY SOLUTION, 2024–2029 (USD MILLION)
TABLE 110 US: MARKET, BY SERVICE, 2019–2023 (USD MILLION)
TABLE 111 US: MARKET, BY SERVICE, 2024–2029 (USD MILLION)
TABLE 112 US: MARKET, BY BUSINESS FUNCTION, 2019–2023 (USD MILLION)
TABLE 113 US: MARKET, BY BUSINESS FUNCTION, 2024–2029 (USD MILLION)
TABLE 114 US: MARKET, BY APPLICATION, 2019–2023 (USD MILLION)
TABLE 115 US: MARKET, BY APPLICATION, 2024–2029 (USD MILLION)
TABLE 116 US: MARKET, BY VERTICAL, 2019–2023 (USD MILLION)
TABLE 117 US: MARKET, BY VERTICAL, 2024–2029 (USD MILLION)
TABLE 118 CANADA: AUTONOMOUS ENTERPRISE MARKET, BY OFFERING, 2019–2023 (USD MILLION)
TABLE 119 CANADA: MARKET, BY OFFERING, 2024–2029 (USD MILLION)
TABLE 120 CANADA: MARKET, BY SOLUTION, 2019–2023 (USD MILLION)
TABLE 121 CANADA: MARKET, BY SOLUTION, 2024–2029 (USD MILLION)
TABLE 122 CANADA: MARKET, BY SERVICE, 2019–2023 (USD MILLION)
TABLE 123 CANADA: MARKET, BY SERVICE, 2024–2029 (USD MILLION)
TABLE 124 CANADA: MARKET, BY BUSINESS FUNCTION, 2019–2023 (USD MILLION)
TABLE 125 CANADA: MARKET, BY BUSINESS FUNCTION, 2024–2029 (USD MILLION)
TABLE 126 CANADA: MARKET, BY APPLICATION, 2019–2023 (USD MILLION)
TABLE 127 CANADA: MARKET, BY APPLICATION, 2024–2029 (USD MILLION)
TABLE 128 CANADA: MARKET, BY VERTICAL, 2019–2023 (USD MILLION)
TABLE 129 CANADA: MARKET, BY VERTICAL, 2024–2029 (USD MILLION)
TABLE 130 EUROPE: AUTONOMOUS ENTERPRISE MARKET, BY OFFERING, 2019–2023 (USD MILLION)
TABLE 131 EUROPE: MARKET, BY OFFERING, 2024–2029 (USD MILLION)
TABLE 132 EUROPE: MARKET, BY SOLUTION, 2019–2023 (USD MILLION)
TABLE 133 EUROPE: MARKET, BY SOLUTION, 2024–2029 (USD MILLION)
TABLE 134 EUROPE: MARKET, BY SERVICE, 2019–2023 (USD MILLION)
TABLE 135 EUROPE: MARKET, BY SERVICE, 2024–2029 (USD MILLION)
TABLE 136 EUROPE: MARKET, BY BUSINESS FUNCTION, 2019–2023 (USD MILLION)
TABLE 137 EUROPE: MARKET, BY BUSINESS FUNCTION, 2024–2029 (USD MILLION)
TABLE 138 EUROPE: MARKET, BY APPLICATION, 2019–2023 (USD MILLION)
TABLE 139 EUROPE: MARKET, BY APPLICATION, 2024–2029 (USD MILLION)
TABLE 140 EUROPE: MARKET, BY VERTICAL, 2019–2023 (USD MILLION)
TABLE 141 EUROPE: MARKET, BY VERTICAL, 2024–2029 (USD MILLION)
TABLE 142 EUROPE: MARKET, BY COUNTRY, 2019–2023 (USD MILLION)
TABLE 143 EUROPE: MARKET, BY COUNTRY, 2024–2029 (USD MILLION)
TABLE 144 UK: AUTONOMOUS ENTERPRISE MARKET, BY OFFERING, 2019–2023 (USD MILLION)
TABLE 145 UK: MARKET, BY OFFERING, 2024–2029 (USD MILLION)
TABLE 146 UK: MARKET, BY SOLUTION, 2019–2023 (USD MILLION)
TABLE 147 UK: MARKET, BY SOLUTION, 2024–2029 (USD MILLION)
TABLE 148 UK: MARKET, BY SERVICE, 2019–2023 (USD MILLION)
TABLE 149 UK: MARKET, BY SERVICE, 2024–2029 (USD MILLION)
TABLE 150 UK: MARKET, BY BUSINESS FUNCTION, 2019–2023 (USD MILLION)
TABLE 151 UK: MARKET, BY BUSINESS FUNCTION, 2024–2029 (USD MILLION)
TABLE 152 UK: MARKET, BY APPLICATION, 2019–2023 (USD MILLION)
TABLE 153 UK: MARKET, BY APPLICATION, 2024–2029 (USD MILLION)
TABLE 154 UK: MARKET, BY VERTICAL, 2019–2023 (USD MILLION)
TABLE 155 UK: MARKET, BY VERTICAL, 2024–2029 (USD MILLION)
TABLE 156 ITALY: AUTONOMOUS ENTERPRISE MARKET, BY OFFERING, 2019–2023 (USD MILLION)
TABLE 157 ITALY: MARKET, BY OFFERING, 2024–2029 (USD MILLION)
TABLE 158 ITALY: MARKET, BY SOLUTION, 2019–2023 (USD MILLION)
TABLE 159 ITALY: MARKET, BY SOLUTION, 2024–2029 (USD MILLION)
TABLE 160 ITALY: MARKET, BY SERVICE, 2019–2023 (USD MILLION)
TABLE 161 ITALY: MARKET, BY SERVICE, 2024–2029 (USD MILLION)
TABLE 162 ITALY: MARKET, BY BUSINESS FUNCTION, 2019–2023 (USD MILLION)
TABLE 163 ITALY: MARKET, BY BUSINESS FUNCTION, 2024–2029 (USD MILLION)
TABLE 164 ITALY: MARKET, BY APPLICATION, 2019–2023 (USD MILLION)
TABLE 165 ITALY: MARKET, BY APPLICATION, 2024–2029 (USD MILLION)
TABLE 166 ITALY: MARKET, BY VERTICAL, 2019–2023 (USD MILLION)
TABLE 167 ITALY: MARKET, BY VERTICAL, 2024–2029 (USD MILLION)
TABLE 168 ASIA PACIFIC: AUTONOMOUS ENTERPRISE MARKET, BY OFFERING, 2019–2023 (USD MILLION)
TABLE 169 ASIA PACIFIC: MARKET, BY OFFERING, 2024–2029 (USD MILLION)
TABLE 170 ASIA PACIFIC: MARKET, BY SOLUTION, 2019–2023 (USD MILLION)
TABLE 171 ASIA PACIFIC: MARKET, BY SOLUTION, 2024–2029 (USD MILLION)
TABLE 172 ASIA PACIFIC: MARKET, BY SERVICE, 2019–2023 (USD MILLION)
TABLE 173 ASIA PACIFIC: MARKET, BY SERVICE, 2024–2029 (USD MILLION)
TABLE 174 ASIA PACIFIC: MARKET, BY BUSINESS FUNCTION, 2019–2023 (USD MILLION)
TABLE 175 ASIA PACIFIC: MARKET, BY BUSINESS FUNCTION, 2024–2029 (USD MILLION)
TABLE 176 ASIA PACIFIC: MARKET, BY APPLICATION, 2019–2023 (USD MILLION)
TABLE 177 ASIA PACIFIC: MARKET, BY APPLICATION, 2024–2029 (USD MILLION)
TABLE 178 ASIA PACIFIC: MARKET, BY VERTICAL, 2019–2023 (USD MILLION)
TABLE 179 ASIA PACIFIC: MARKET, BY VERTICAL, 2024–2029 (USD MILLION)
TABLE 180 ASIA PACIFIC: MARKET, BY COUNTRY, 2019–2023 (USD MILLION)
TABLE 181 ASIA PACIFIC: MARKET, BY COUNTRY, 2024–2029 (USD MILLION)
TABLE 182 CHINA: AUTONOMOUS ENTERPRISE MARKET, BY OFFERING, 2019–2023 (USD MILLION)
TABLE 183 CHINA: MARKET, BY OFFERING, 2024–2029 (USD MILLION)
TABLE 184 CHINA: MARKET, BY SOLUTION, 2019–2023 (USD MILLION)
TABLE 185 CHINA: MARKET, BY SOLUTION, 2024–2029 (USD MILLION)
TABLE 186 CHINA: MARKET, BY SERVICE, 2019–2023 (USD MILLION)
TABLE 187 CHINA: MARKET, BY SERVICE, 2024–2029 (USD MILLION)
TABLE 188 CHINA: MARKET, BY BUSINESS FUNCTION, 2019–2023 (USD MILLION)
TABLE 189 CHINA: MARKET, BY BUSINESS FUNCTION, 2024–2029 (USD MILLION)
TABLE 190 CHINA: MARKET, BY APPLICATION, 2019–2023 (USD MILLION)
TABLE 191 CHINA: MARKET, BY APPLICATION, 2024–2029 (USD MILLION)
TABLE 192 CHINA: MARKET, BY VERTICAL, 2019–2023 (USD MILLION)
TABLE 193 CHINA: MARKET, BY VERTICAL, 2024–2029 (USD MILLION)
TABLE 194 INDIA: AUTONOMOUS ENTERPRISE MARKET, BY OFFERING, 2019–2023 (USD MILLION)
TABLE 195 INDIA: MARKET, BY OFFERING, 2024–2029 (USD MILLION)
TABLE 196 INDIA: MARKET, BY SOLUTION, 2019–2023 (USD MILLION)
TABLE 197 INDIA: MARKET, BY SOLUTION, 2024–2029 (USD MILLION)
TABLE 198 INDIA: MARKET, BY SERVICE, 2019–2023 (USD MILLION)
TABLE 199 INDIA: MARKET, BY SERVICE, 2024–2029 (USD MILLION)
TABLE 200 INDIA: MARKET, BY BUSINESS FUNCTION, 2019–2023 (USD MILLION)
TABLE 201 INDIA: MARKET, BY BUSINESS FUNCTION, 2024–2029 (USD MILLION)
TABLE 202 INDIA: MARKET, BY APPLICATION, 2019–2023 (USD MILLION)
TABLE 203 INDIA: MARKET, BY APPLICATION, 2024–2029 (USD MILLION)
TABLE 204 INDIA: MARKET, BY VERTICAL, 2019–2023 (USD MILLION)
TABLE 205 INDIA: MARKET, BY VERTICAL, 2024–2029 (USD MILLION)
TABLE 206 MIDDLE EAST & AFRICA: AUTONOMOUS ENTERPRISE MARKET, BY OFFERING, 2019–2023 (USD MILLION)
TABLE 207 MIDDLE EAST & AFRICA: MARKET, BY OFFERING, 2024–2029 (USD MILLION)
TABLE 208 MIDDLE EAST & AFRICA: MARKET, BY SOLUTION, 2019–2023 (USD MILLION)
TABLE 209 MIDDLE EAST & AFRICA: MARKET, BY SOLUTION, 2024–2029 (USD MILLION)
TABLE 210 MIDDLE EAST & AFRICA: MARKET, BY SERVICE, 2019–2023 (USD MILLION)
TABLE 211 MIDDLE EAST & AFRICA: MARKET, BY SERVICE, 2024–2029 (USD MILLION)
TABLE 212 MIDDLE EAST & AFRICA: MARKET, BY BUSINESS FUNCTION, 2019–2023 (USD MILLION)
TABLE 213 MIDDLE EAST & AFRICA: MARKET, BY BUSINESS FUNCTION, 2024–2029 (USD MILLION)
TABLE 214 MIDDLE EAST & AFRICA: MARKET, BY APPLICATION, 2019–2023 (USD MILLION)
TABLE 215 MIDDLE EAST & AFRICA: MARKET, BY APPLICATION, 2024–2029 (USD MILLION)
TABLE 216 MIDDLE EAST & AFRICA: MARKET, BY VERTICAL, 2019–2023 (USD MILLION)
TABLE 217 MIDDLE EAST & AFRICA: MARKET, BY VERTICAL, 2024–2029 (USD MILLION)
TABLE 218 MIDDLE EAST & AFRICA: MARKET, BY REGION, 2019–2023 (USD MILLION)
TABLE 219 MIDDLE EAST & AFRICA: MARKET, BY REGION, 2024–2029 (USD MILLION)
TABLE 220 MIDDLE EAST: MARKET, BY OFFERING, 2019–2023 (USD MILLION)
TABLE 221 MIDDLE EAST: MARKET, BY OFFERING, 2024–2029 (USD MILLION)
TABLE 222 MIDDLE EAST: MARKET, BY SOLUTION, 2019–2023 (USD MILLION)
TABLE 223 MIDDLE EAST: MARKET, BY SOLUTION, 2024–2029 (USD MILLION)
TABLE 224 MIDDLE EAST: MARKET, BY SERVICE, 2019–2023 (USD MILLION)
TABLE 225 MIDDLE EAST: MARKET, BY SERVICE, 2024–2029 (USD MILLION)
TABLE 226 MIDDLE EAST: MARKET, BY BUSINESS FUNCTION, 2019–2023 (USD MILLION)
TABLE 227 MIDDLE EAST: MARKET, BY BUSINESS FUNCTION, 2024–2029 (USD MILLION)
TABLE 228 MIDDLE EAST: MARKET, BY APPLICATION, 2019–2023 (USD MILLION)
TABLE 229 MIDDLE EAST: MARKET, BY APPLICATION, 2024–2029 (USD MILLION)
TABLE 230 MIDDLE EAST: MARKET, BY VERTICAL, 2019–2023 (USD MILLION)
TABLE 231 MIDDLE EAST: MARKET, BY VERTICAL, 2024–2029 (USD MILLION)
TABLE 232 MIDDLE EAST: MARKET, BY COUNTRY, 2019–2023 (USD MILLION)
TABLE 233 MIDDLE EAST: MARKET, BY COUNTRY, 2024–2029 (USD MILLION)
TABLE 234 KSA: AUTONOMOUS ENTERPRISE MARKET, BY OFFERING, 2019–2023 (USD MILLION)
TABLE 235 KSA: MARKET, BY OFFERING, 2024–2029 (USD MILLION)
TABLE 236 KSA: MARKET, BY SOLUTION, 2019–2023 (USD MILLION)
TABLE 237 KSA: MARKET, BY SOLUTION, 2024–2029 (USD MILLION)
TABLE 238 KSA: MARKET, BY SERVICE, 2019–2023 (USD MILLION)
TABLE 239 KSA: MARKET, BY SERVICE, 2024–2029 (USD MILLION)
TABLE 240 KSA: MARKET, BY BUSINESS FUNCTION, 2019–2023 (USD MILLION)
TABLE 241 KSA: MARKET, BY BUSINESS FUNCTION, 2024–2029 (USD MILLION)
TABLE 242 KSA: MARKET, BY APPLICATION, 2019–2023 (USD MILLION)
TABLE 243 KSA: MARKET, BY APPLICATION, 2024–2029 (USD MILLION)
TABLE 244 KSA: MARKET, BY VERTICAL, 2019–2023 (USD MILLION)
TABLE 245 KSA: MARKET, BY VERTICAL, 2024–2029 (USD MILLION)
TABLE 246 LATIN AMERICA: AUTONOMOUS ENTERPRISE MARKET, BY OFFERING, 2019–2023 (USD MILLION)
TABLE 247 LATIN AMERICA: MARKET, BY OFFERING, 2024–2029 (USD MILLION)
TABLE 248 LATIN AMERICA: MARKET, BY SOLUTION, 2019–2023 (USD MILLION)
TABLE 249 LATIN AMERICA: MARKET, BY SOLUTION, 2024–2029 (USD MILLION)
TABLE 250 LATIN AMERICA: MARKET, BY SERVICE, 2019–2023 (USD MILLION)
TABLE 251 LATIN AMERICA: MARKET, BY SERVICE, 2024–2029 (USD MILLION)
TABLE 252 LATIN AMERICA: MARKET, BY BUSINESS FUNCTION, 2019–2023 (USD MILLION)
TABLE 253 LATIN AMERICA: MARKET, BY BUSINESS FUNCTION, 2024–2029 (USD MILLION)
TABLE 254 LATIN AMERICA: MARKET, BY APPLICATION, 2019–2023 (USD MILLION)
TABLE 255 LATIN AMERICA: MARKET, BY APPLICATION, 2024–2029 (USD MILLION)
TABLE 256 LATIN AMERICA: MARKET, BY VERTICAL, 2019–2023 (USD MILLION)
TABLE 257 LATIN AMERICA: MARKET, BY VERTICAL, 2024–2029 (USD MILLION)
TABLE 258 LATIN AMERICA: MARKET, BY COUNTRY, 2019–2023 (USD MILLION)
TABLE 259 LATIN AMERICA: MARKET, BY COUNTRY, 2024–2029 (USD MILLION)
TABLE 260 BRAZIL: AUTONOMOUS ENTERPRISE MARKET, BY OFFERING, 2019–2023 (USD MILLION)
TABLE 261 BRAZIL: MARKET, BY OFFERING, 2024–2029 (USD MILLION)
TABLE 262 BRAZIL: MARKET, BY SOLUTION, 2019–2023 (USD MILLION)
TABLE 263 BRAZIL: MARKET, BY SOLUTION, 2024–2029 (USD MILLION)
TABLE 264 BRAZIL: MARKET, BY SERVICE, 2019–2023 (USD MILLION)
TABLE 265 BRAZIL: MARKET, BY SERVICE, 2024–2029 (USD MILLION)
TABLE 266 BRAZIL: MARKET, BY BUSINESS FUNCTION, 2019–2023 (USD MILLION)
TABLE 267 BRAZIL: MARKET, BY BUSINESS FUNCTION, 2024–2029 (USD MILLION)
TABLE 268 BRAZIL: MARKET, BY APPLICATION, 2019–2023 (USD MILLION)
TABLE 269 BRAZIL: MARKET, BY APPLICATION, 2024–2029 (USD MILLION)
TABLE 270 BRAZIL: MARKET, BY VERTICAL, 2019–2023 (USD MILLION)
TABLE 271 BRAZIL: MARKET, BY VERTICAL, 2024–2029 (USD MILLION)
TABLE 272 AUTONOMOUS ENTERPRISE MARKET: DEGREE OF COMPETITION
TABLE 273 MARKET: VERTICAL FOOTPRINT
TABLE 274 MARKET: OFFERING FOOTPRINT
TABLE 275 MARKET: REGIONAL FOOTPRINT
TABLE 276 MARKET: DETAILED LIST OF KEY STARTUPS/SMES
TABLE 277 MARKET: COMPETITIVE BENCHMARKING OF KEY STARTUPS/SMES
TABLE 278 MARKET: PRODUCT LAUNCHES & ENHANCEMENTS, MAY 2022–JULY 2024
TABLE 279 MARKET: DEALS, MAY 2022–JULY 2024
TABLE 280 MICROSOFT: COMPANY OVERVIEW
TABLE 281 MICROSOFT: PRODUCTS/SOLUTIONS/SERVICES OFFERED
TABLE 282 MICROSOFT: PRODUCT LAUNCHES & ENHANCEMENTS
TABLE 283 MICROSOFT: DEALS
TABLE 284 IBM: COMPANY OVERVIEW
TABLE 285 IBM: PRODUCTS/SOLUTIONS/SERVICES OFFERED
TABLE 286 IBM: DEALS
TABLE 287 CHECK POINT SOFTWARE: COMPANY OVERVIEW
TABLE 288 CHECK POINT SOFTWARE: PRODUCTS/SOLUTIONS/SERVICES OFFERED
TABLE 289 CHECK POINT SOFTWARE: PRODUCT LAUNCHES & ENHANCEMENTS
TABLE 290 CHECK POINT SOFTWARE: DEALS
TABLE 291 PEGASYSTEMS: COMPANY OVERVIEW
TABLE 292 PEGASYSTEMS: PRODUCTS/SOLUTIONS/SERVICES OFFERED
TABLE 293 PEGASYSTEMS: PRODUCT LAUNCHES & ENHANCEMENTS
TABLE 294 PEGASYSTEMS: DEALS
TABLE 295 CISCO SYSTEMS: COMPANY OVERVIEW
TABLE 296 CISCO SYSTEMS: PRODUCTS/SOLUTIONS/SERVICES OFFERED
TABLE 297 CISCO SYSTEMS: DEALS
TABLE 298 SAP: COMPANY OVERVIEW
TABLE 299 SAP: PRODUCTS/SOLUTIONS/SERVICES OFFERED
TABLE 300 SAP: DEALS
TABLE 301 HPE: COMPANY OVERVIEW
TABLE 302 HPE: PRODUCTS/SOLUTIONS/SERVICES OFFERED
TABLE 303 HPE: DEALS
TABLE 304 ATOS: COMPANY OVERVIEW
TABLE 305 ATOS: PRODUCTS/SOLUTIONS/SERVICES OFFERED
TABLE 306 ATOS: PRODUCT LAUNCHES & ENHANCEMENTS
TABLE 307 ATOS: DEALS
TABLE 308 ORACLE: COMPANY OVERVIEW
TABLE 309 ORACLE: PRODUCTS/SOLUTIONS/SERVICES OFFERED
TABLE 310 ORACLE: DEALS
TABLE 311 AMAZON WEB SERVICES: COMPANY OVERVIEW
TABLE 312 AMAZON WEB SERVICES: PRODUCTS/SOLUTIONS/SERVICES OFFERED
TABLE 313 AMAZON WEB SERVICES: DEALS
TABLE 314 RPA AND HYPERAUTOMATION MARKET, BY COMPONENT, 2019–2021(USD MILLION)
TABLE 315 RPA AND HYPERAUTOMATION MARKET, BY COMPONENT, 2022–2027(USD MILLION)
TABLE 316 RPA AND HYPERAUTOMATION MARKET, BY DEPLOYMENT MODE, 2019–2021(USD MILLION)
TABLE 317 RPA AND HYPERAUTOMATION MARKET, BY DEPLOYMENT MODE, 2022–2027(USD MILLION)
TABLE 318 RPA AND HYPERAUTOMATION MARKET SIZE, BY ORGANIZATION SIZE, 2019–2021 (USD MILLION)
TABLE 319 RPA AND HYPERAUTOMATION MARKET SIZE, BY ORGANIZATION SIZE, 2022–2027 (USD MILLION)
TABLE 320 RPA AND HYPERAUTOMATION MARKET, BY BUSINESS FUNCTION, 2019–2021 (USD MILLION)
TABLE 321 RPA AND HYPERAUTOMATION MARKET, BY BUSINESS FUNCTION, 2022–2027 (USD MILLION)
TABLE 322 RPA AND HYPERAUTOMATION MARKET, BY VERTICAL, 2019–2021 (USD MILLION)
TABLE 323 RPA AND HYPERAUTOMATION MARKET, BY VERTICAL, 2022–2027 (USD MILLION)
TABLE 324 RPA AND HYPERAUTOMATION MARKET, BY REGION, 2019–2021 (USD MILLION)
TABLE 325 RPA AND HYPERAUTOMATION MARKET, BY REGION, 2022–2027 (USD MILLION)
TABLE 326 SECURITY AUTOMATION MARKET, BY OFFERING, 2017–2022 (USD MILLION)
TABLE 327 SECURITY AUTOMATION MARKET, BY OFFERING, 2023–2028 (USD MILLION)
TABLE 328 SECURITY AUTOMATION MARKET, BY TECHNOLOGY, 2017–2022 (USD MILLION)
TABLE 329 SECURITY AUTOMATION MARKET, BY TECHNOLOGY, 2023–2028 (USD MILLION)
TABLE 330 SECURITY AUTOMATION MARKET, BY APPLICATION, 2017–2022 (USD MILLION)
TABLE 331 SECURITY AUTOMATION MARKET, BY APPLICATION, 2023–2028 (USD MILLION)
TABLE 332 SECURITY AUTOMATION SOFTWARE MARKET, BY CODE TYPE, 2017–2022 (USD MILLION)
TABLE 333 SECURITY AUTOMATION SOFTWARE MARKET, BY CODE TYPE, 2023–2028 (USD MILLION)
TABLE 334 SECURITY AUTOMATION MARKET, BY VERTICAL, 2017–2022 (USD MILLION)
TABLE 335 SECURITY AUTOMATION MARKET, BY VERTICAL, 2023–2028 (USD MILLION)
TABLE 336 SECURITY AUTOMATION MARKET, BY REGION, 2017–2022 (USD MILLION)
TABLE 337 SECURITY AUTOMATION MARKET, BY REGION, 2023–2028 (USD MILLION)
 
LIST OF FIGURES (57 Figures) 
 
FIGURE 1 MARKET: RESEARCH DESIGN
FIGURE 2 BREAKDOWN OF PRIMARY INTERVIEWS: BY COMPANY TYPE, DESIGNATION, AND REGION
FIGURE 3 DATA TRIANGULATION
FIGURE 4 TOP-DOWN APPROACH
FIGURE 5 MARKET SIZE ESTIMATION METHODOLOGY – APPROACH 1 (SUPPLY SIDE): REVENUE OF VENDORS IN AUTONOMOUS ENTERPRISE MARKET
FIGURE 6 BOTTOM-UP APPROACH
FIGURE 7 MARKET SIZE ESTIMATION METHODOLOGY: DEMAND-SIDE ANALYSIS
FIGURE 8 BOTTOM-UP (SUPPLY SIDE) ANALYSIS: COLLECTIVE REVENUE FROM SOLUTIONS/SERVICES OF AUTONOMOUS ENTERPRISE MARKET
FIGURE 9 MARKET, 2022–2029 (USD MILLION)
FIGURE 10 LEADING MARKET SEGMENTS IN MARKET
FIGURE 11 AUTONOMOUS ENTERPRISE MARKET: REGIONAL SNAPSHOT
FIGURE 12 GROWING DEMAND FOR PERSONALIZED AND INTERACTIVE LEARNING TO DRIVE MARKET
FIGURE 13 SOLUTIONS SEGMENT TO ACCOUNT FOR LARGER MARKET SHARE THAN SERVICES SEGMENT IN 2024
FIGURE 14 ROBOTIC PROCESS AUTOMATION SEGMENT TO DOMINATE MARKET IN 2024
FIGURE 15 PROFESSIONAL SERVICES SEGMENT TO HOLD LARGER MARKET SHARE THAN MANAGED SERVICES SEGMENT IN 2024
FIGURE 16 IT SEGMENT TO HOLD LARGEST MARKET SHARE IN 2024
FIGURE 17 BFSI SEGMENT TO HOLD LARGEST MARKET SHARE IN 2024
FIGURE 18 PROCESS AUTOMATION SEGMENT TO ACCOUNT FOR LARGEST SHARE OF NORTH AMERICAN MARKET IN 2024
FIGURE 19 MARKET: DRIVERS, RESTRAINTS, OPPORTUNITIES, AND CHALLENGES
FIGURE 20 EVOLUTION OF AUTONOMOUS ENTERPRISE
FIGURE 21 MARKET: ECOSYSTEM
FIGURE 22 AUTONOMOUS ENTERPRISE MARKET: VALUE CHAIN ANALYSIS
FIGURE 23 LIST OF MAJOR PATENTS FOR AUTONOMOUS ENTERPRISE
FIGURE 24 AVERAGE SELLING PRICE TREND OF KEY PLAYERS, BY RPA SOLUTION (PER MONTH)
FIGURE 25 PORTER’S FIVE FORCES MODEL: MARKET
FIGURE 26 TRENDS/DISRUPTIONS IMPACTING CUSTOMER BUSINESS
FIGURE 27 INFLUENCE OF STAKEHOLDERS ON BUYING PROCESS FOR TOP 3 VERTICALS
FIGURE 28 KEY BUYING CRITERIA FOR TOP 3 VERTICALS
FIGURE 29 TOOLS, FRAMEWORKS, AND TECHNIQUES USED IN AUTONOMOUS ENTERPRISE SOLUTIONS
FIGURE 30 AUTONOMOUS ENTERPRISE MARKET: INVESTMENT AND FUNDING SCENARIO OF MAJOR COMPANIES
FIGURE 31 SERVICES SEGMENT TO REGISTER HIGHER CAGR THAN SOLUTIONS SEGMENT DURING FORECAST PERIOD
FIGURE 32 ROBOTIC PROCESS AUTOMATION SEGMENT TO LEAD MARKET DURING FORECAST PERIOD
FIGURE 33 PROFESSIONAL SERVICES SEGMENT TO DOMINATE MARKET DURING FORECAST PERIOD
FIGURE 34 HUMAN RESOURCE SEGMENT TO REGISTER HIGHEST CAGR DURING FORECAST PERIOD
FIGURE 35 PREDICTIVE MAINTENANCE SEGMENT TO REGISTER HIGHEST CAGR DURING FORECAST PERIOD
FIGURE 36 TELECOM SEGMENT TO REGISTER HIGHEST CAGR DURING FORECAST PERIOD
FIGURE 37 NORTH AMERICA: AUTONOMOUS ENTERPRISE MARKET SNAPSHOT
FIGURE 38 ASIA PACIFIC: MARKET SNAPSHOT
FIGURE 39 REVENUE ANALYSIS FOR KEY COMPANIES IN PAST 5 YEARS
FIGURE 40 SHARE OF LEADING COMPANIES IN AUTONOMOUS ENTERPRISE MARKET, 2023
FIGURE 41 MARKET RANKING ANALYSIS OF TOP 5 PLAYERS
FIGURE 42 MARKET: COMPANY EVALUATION MATRIX (KEY PLAYERS), 2023
FIGURE 43 MARKET: COMPANY FOOTPRINT
FIGURE 44 MARKET: COMPANY EVALUATION MATRIX (STARTUPS/SMES), 2023
FIGURE 45 BRAND/PRODUCT COMPARISON
FIGURE 46 FINANCIAL METRICS OF KEY MARKET VENDORS
FIGURE 47 COMPANY VALUATION OF KEY AUTONOMOUS ENTERPRISE MARKET VENDORS
FIGURE 48 MICROSOFT: COMPANY SNAPSHOT
FIGURE 49 IBM: COMPANY SNAPSHOT
FIGURE 50 CHECK POINT SOFTWARE: COMPANY SNAPSHOT
FIGURE 51 PEGASYSTEMS: COMPANY SNAPSHOT
FIGURE 52 CISCO SYSTEMS: COMPANY SNAPSHOT
FIGURE 53 SAP: COMPANY SNAPSHOT
FIGURE 54 HPE: COMPANY SNAPSHOT
FIGURE 55 ATOS: COMPANY SNAPSHOT
FIGURE 56 ORACLE: COMPANY SNAPSHOT
FIGURE 57 AMAZON WEB SERVICES: COMPANY SNAPSHOT

The research study involved four major activities in estimating the autonomous enterprise market size. Exhaustive secondary research has been done to collect important information about the market and peer markets. The next step has been to validate these findings and assumptions and size them with the help of primary research with industry experts across the value chain. Both top-down and bottom-up approaches have been used to estimate the market size. Post which the market breakdown and data triangulation have been adopted to estimate the market sizes of segments and sub-segments.

Secondary Research

The market size of the companies offering autonomous enterprise solutions to various end users was arrived at based on the secondary data available through paid and unpaid sources and by analyzing the product portfolios of major companies in the ecosystem and rating the companies based on their performance and quality. In the secondary research process, various sources were referred to identify and collect information for the study. The secondary sources included annual reports, press releases, investor presentations of companies, white papers, journals, certified publications, and articles from recognized authors, directories, and databases.

Secondary research was mainly used to obtain critical information about industry insights, the market’s monetary chain, the overall pool of key players, market classification, and segmentation according to industry trends to the bottom-most level, regional markets, and key developments from both market- and technology-oriented perspectives.

Primary Research

In the primary research process, various sources from the supply and demand sides were interviewed to obtain qualitative and quantitative information for the report, Such as Chief Experience Officers (CXOs), Vice Presidents (VPs), directors from business development, marketing, and product development/innovation teams, and related key executives from autonomous enterprise solution vendors, system integrators, professional and managed service providers, industry associations, independent consultants, and key opinion leaders.

Primary interviews were conducted to gather insights, such as market statistics, data on revenue collected from software and services, market breakups, market size estimations, market forecasts, and data triangulation. Stakeholders from the demand side, such as Chief Information Officers (CIOs), Chief Finance Officers (CFOs), Chief Strategy Officers (CSOs), and the installation team of end users who use autonomous enterprise, were interviewed to understand buyers’ perspectives on suppliers, products, service providers, and their current usage of Autonomous enterprise solutions which is expected to affect the overall autonomous enterprise market growth.

Autonomous Enterprise Market  Size, and Share

To know about the assumptions considered for the study, download the pdf brochure

Market Size Estimation

In the market engineering process, the top-down and bottom-up approaches were used along with multiple data triangulation methods to estimate and validate the size of the autonomous enterprise market and other dependent submarkets. The research methodology used to estimate the market sizes includes the following:

  • Initially, MarketsandMarkets focuses on top-line investments and spending in the ecosystems. Further, significant developments in the critical market area have been considered.
  • Tracking the recent and upcoming developments in the autonomous enterprise market that include investments, R&D activities, product launches, collaborations, mergers and acquisitions, and partnerships, as well as forecasting the market size based on these developments and other critical parameters.
  • Conduct multiple discussions with key opinion leaders to learn about the diverse types of authentications and brand protection offerings used and the applications for which they are used to analyze the breakdown of the scope of work carried out by major companies.
  • Segmenting the market based on technology types concerning applications wherein the types are to be used and deriving the size of the global application market.
  • Segmenting the overall market into various market segments
  • Validating the estimates at every level through discussions with key opinion leaders, such as chief executives (CXOs), directors, and operation managers, and finally with the domain experts at MarketsandMarkets

Market Size Estimation Methodology-Bottom-up approach

Autonomous Enterprise Market  Bottom Up Approach

To know about the assumptions considered for the study, Request for Free Sample Report

Market Size Estimation Methodology-top-down approach

Autonomous Enterprise Market Top Down Approach

Data Triangulation

After arriving at the overall market size from the above estimation process, the autonomous enterprise market has been split into several segments and sub-segments. To complete the overall market engineering process and arrive at the exact statistics for all segments and sub-segments, data triangulation and market breakdown procedures have been used, wherever applicable. The data has been triangulated by studying various factors and trends from both the demand and supply sides.

The autonomous enterprise market size has been validated using top-down and bottom-up approaches.

Market Definition

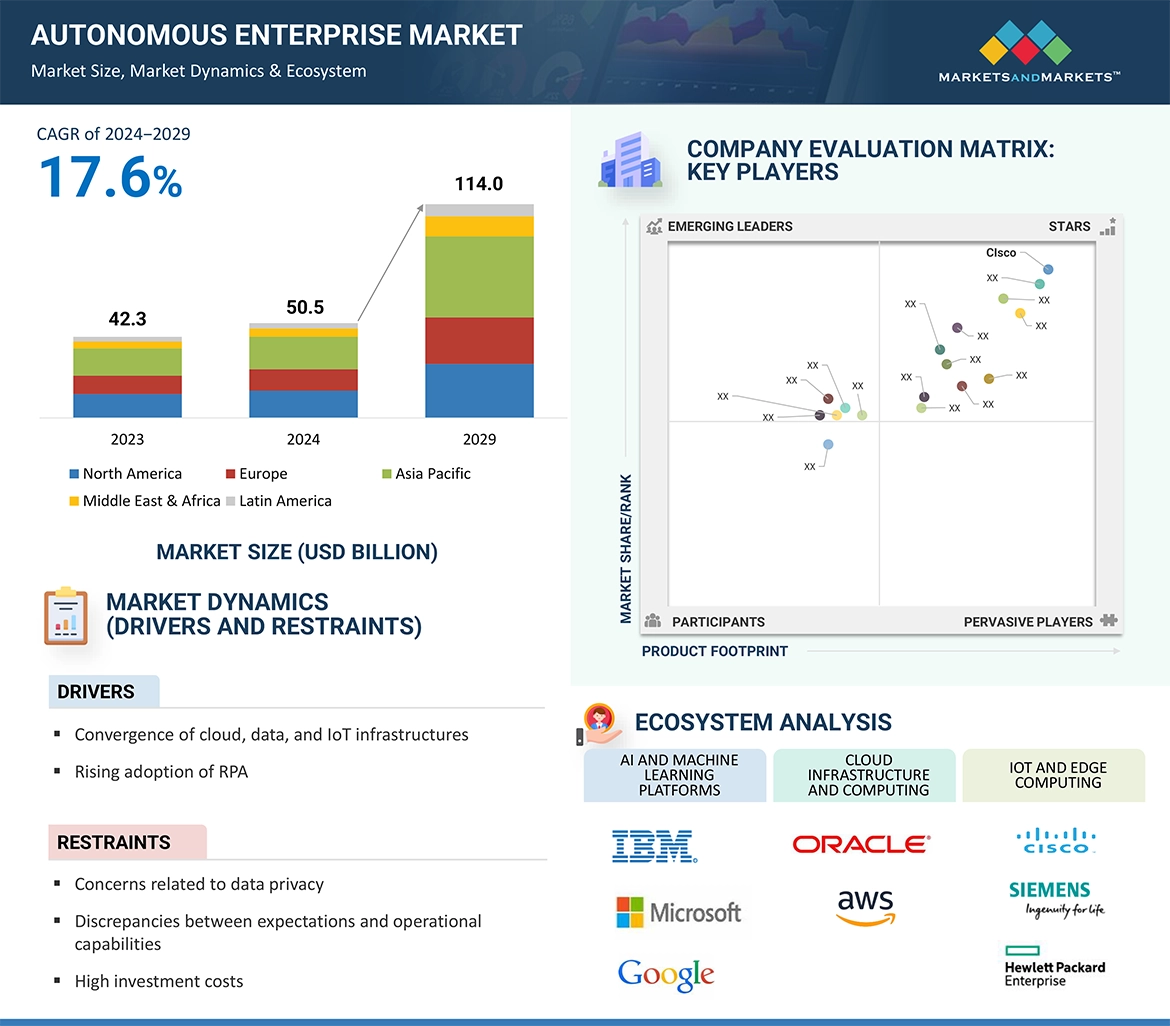
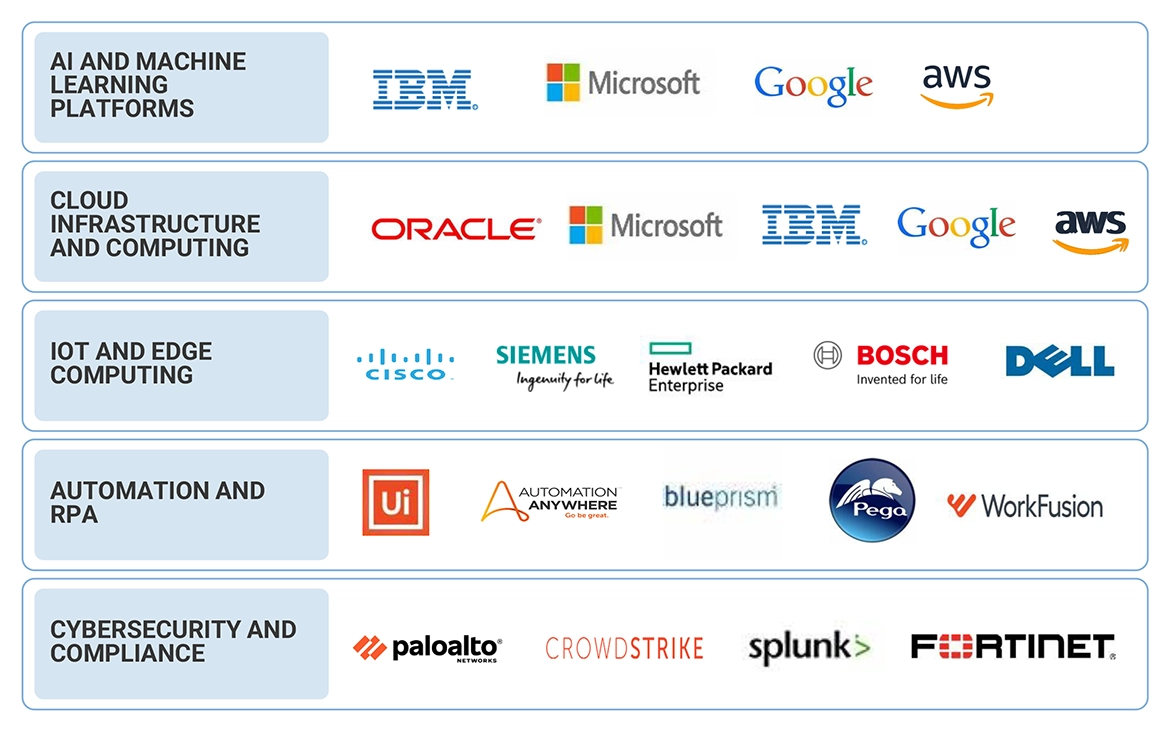
Autonomous Enterprise is a self-optimizing business that applies AI and automation to decisions, operations, and servicing across the organization. It is a collection of various solutions that enable business functions such as supply chain and operations, IT, HR, accounting & finance, and sales & marketing in an enterprise.

Stakeholders

  • Managed service providers
  • Support and maintenance service providers
  • System Integrators (Sls)/migration service providers
  • Value-Added Resellers (VARs) and distributors
  • Distributors and Value-added Resellers (VARs)
  • System Integrators (Sls)
  • Independent Software Vendors (ISV)
  • Third-party providers
  • Technology providers

Report Objectives

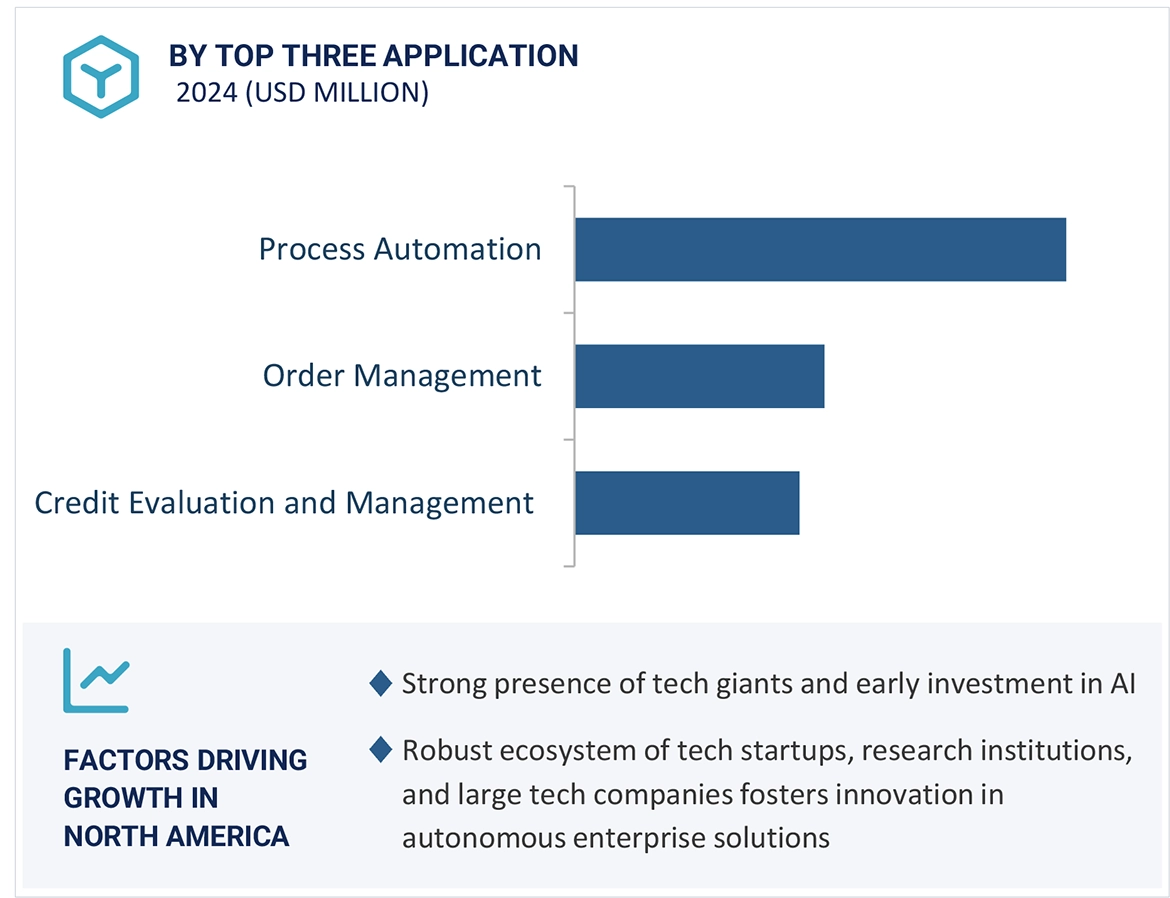
  • To determine and forecast the global autonomous enterprise market by offering (solution and services), business functions, applications, vertical, and region from 2024 to 2029, and analyze the various macroeconomic and microeconomic factors affecting the market growth.
  • To forecast the size of the market segments concerning five central regions: North America, Europe, Asia Pacific (APAC), Middle East & Africa (MEA), and Latin America.
  • To provide detailed information about the major factors (drivers, restraints, opportunities, and challenges) influencing the growth of the autonomous enterprise market.
  • Analyze each submarket concerning individual growth trends, prospects, and contributions to the overall Autonomous enterprise market.
  • To analyze the opportunities in the market for stakeholders by identifying the high-growth segments of the autonomous enterprise market.
  • To profile the key market players; provide a comparative analysis based on business overviews, regional presence, product offerings, business strategies, and key financials; and illustrate the market’s competitive landscape.
  • Track and analyze competitive developments in the market, such as mergers and acquisitions, product developments, partnerships and collaborations, and Research and Development (R&D) activities.

Available Customizations

With the given market data, MarketsandMarkets offers customizations per the company’s specific needs. The following customization options are available for the report:

Geographic Analysis

  • Further break-up of the Asia Pacific market into countries contributing 75% to the regional market size
  • Further break-up of the North American market into countries contributing 75% to the regional market size
  • Further break-up of the Latin American market into countries contributing 75% to the regional market size
  • Further break-up of the Middle East African market into countries contributing 75% to the regional market size
  • Further break-up of the European market into countries contributing 75% to the regional market size

Company Information

  • Detailed analysis and profiling of additional market players (up to 5)
Custom Market Research Services

We will customize the research for you, in case the report listed above does not meet with your exact requirements. Our custom research will comprehensively cover the business information you require to help you arrive at strategic and profitable business decisions.

Request Customization
Report Code
TC 9161
Published ON
Sep, 2024
Choose License Type
BUY NOW
  • SHARE
X
Request Customization
Speak to Analyst
Speak to Analyst
OR FACE-TO-FACE MEETING
PERSONALIZE THIS RESEARCH
  • Triangulate with your Own Data
  • Get Data as per your Format and Definition
  • Gain a Deeper Dive on a Specific Application, Geography, Customer or Competitor
  • Any level of Personalization
REQUEST A FREE CUSTOMIZATION
LET US HELP YOU!
  • What are the Known and Unknown Adjacencies Impacting the Autonomous Enterprise Market
  • What will your New Revenue Sources be?
  • Who will be your Top Customer; what will make them switch?
  • Defend your Market Share or Win Competitors
  • Get a Scorecard for Target Partners
CUSTOMIZED WORKSHOP REQUEST
  • Call Us
  • +1-888-600-6441 (Corporate office hours)
  • +1-888-600-6441 (US/Can toll free)
  • +44-800-368-9399 (UK office hours)
CONNECT WITH US
ABOUT TRUST ONLINE
©2024 MarketsandMarkets Research Private Ltd. All rights reserved
DMCA.com Protection Status Website Feedback