Autonomous Boats Market

Autonomous Boats Market by Propulsion (Fully Electric, Fuel-powered, Hybrid Electric), Boat Size (<20 Feet, 20-40 Feet, >40 Feet), Type (Cruising Boats, Tug & Work Boats, Combat Boats), Autonomy and Region - Global Forecast to 2029

Report Code: AS 9152 Sep, 2024, by marketsandmarkets.com

[219 Pages Report] The autonomous boats market is projected to grow from USD 558 million in 2024 to USD 872 million by 2029, at a CAGR of 9.3%. Advances in artificial intelligence, sensors, and the Internet of Things are enhancing the sustainability, safety, and efficiency of operations, which has increased demand for autonomous boats at a rapid rate. Automation demand is on the rise in commercial sectors for applications such as urban mobility and maritime surveying, among others. These factors are expected to influence the key market players: Kongsberg Maritime (Norway), ABB (Switzerland), Rolls-Royce PLC (UK), Hyundai Heavy Industries (South Korea), and Fugro (Netherlands), among others.

Autonomous Boats Market

Autonomous Boats Market

Autonomous Boats Market Forecast to 2029

To know about the assumptions considered for the study, Request for Free Sample Report

Autonomous Boats Market Dynamics:

Driver: Growing use of automated systems to prevent human errors

Driving factors in the autonomous boats market include the increased use of automated systems to reduce human error and improve operational safety and efficiency. Advanced technologies integrated into autonomous boats include artificial intelligence, machine learning, and highly advanced sensors, which allow them to execute functions that are challenging to handle with great precision and reliability. This reduces the possibility of human error, which is considered a key causal factor in both maritime accidents and operational inefficiency. Automation reduces errors in navigation & control, optimizes performance, and makes timely decisions in case of changes in the environment. This shift toward automation will motivate the commercial, industrial, and defense sectors with reduced operating costs and increased safety, thereby fueling the growth of the market.

Restraint: Vulnerability associated with cyber threats

The vulnerability associated with cyber threats acts as a significant restraint to the autonomous boats market. While digital systems are being relied on for operation and remote control, the threat of cyberattacks is also high. Autonomous boats will rely heavily on software, communication networks, and data exchange systems, which are elaborate systems that could be susceptible to hacking, which can hamper operations, leak sensitive information, or compromise safety. These kinds of cyber threats have the potential to destroy navigation systems, control commands, and onboard data, which may lead to partial or total failure, financial losses, and even certain unsafe situations. Thus, the development of cybersecurity concerns and several protection mechanisms becomes important to ensure the reliability and safety of autonomous vessels. The need for enhanced cybersecurity solutions and protocols can restrain the overall growth of the market, thus increasing the cost at the manufacturing and operating levels. 

Opportunity: Advancements in sensor technology for improved navigation in autonomous boats

In the market for autonomous boats, advancements in sensor technologies have led to significant benefits. Sensors like LiDAR, high-resolution radar, and advanced SONAR systems provide accurate and comprehensive environmental data, allowing autonomous boats to navigate more precisely in complex and dynamic maritime environments. This improves safety by enabling vessels to detect and avoid obstacles while making real-time adjustments. As sensor technology continues to evolve, it will further enhance autonomous systems, creating more versatile applications in both, commercial and defense sectors. The integration of modern sensors enhances the performance of autonomous boats and opens up new commercial opportunities in the market.

Challenge: Cost-intensive customization of marine automation systems

Customization of marine automation systems is a challenge for the autonomous boat market as it entails high costs for tailoring to specific operational and regulatory requirements. These costs further increase with the periodic need for maintenance, software updates, and support services designed for particular vessel configurations and operating scenarios. The high costs deter many operators and manufacturers from market entry, while for other operators, their scalability of autonomous solutions is limited, which hinders the adoption of autonomous boats and slows down market growth.

Autonomous Boats Market Ecosystem

Autonomous Boats  Market by Ecosystem

Based on type, the recreational boats segment is projected to have the highest CAGR during the forecast period.

Based on type, the autonomous boats market is segmented into recreational boats, commercial boats, and military & law enforcement boats. Recreational boats are projected to witness the highest CAGR during the forecast period. New advancements in autonomous technology make recreational boats much safer, more efficient, and easier to handle, innovations that are popular among enthusiasts seeking novel recreational experiences. For leisure boats, autonomous integration means extended navigation, automated docking, and an improved overall ability of the boat to perform. This trend meets the increasing consumer preference for convenience and technological sophistication in leisure activities, thus driving rapid growth in this segment.

Based on propulsion, the fuel-powered segment will have the largest market share during the forecast period.

On the basis of propulsion, the market for autonomous boats has been segmented into fuel-powered, hybrid electric, and fully electric. During the forecast period, the fuel-powered segment is expected to dominate the market. Conventionally, fuel-powered engines are extremely reliable and durable. These are now being equipped with autonomous systems that enhance performance and operational efficiency. These propulsion systems work for a variety of applications, from commercial and recreational boating to providing the power and range necessary to sustain long autonomous operations. Some of the factors driving the growth of this segment include better fuel economy, lower emissions, and better control systems.

Based on boat size, the 20–40 feet segment is expected to dominate the market during the forecast period.

The autonomous boats market, by boat size, is segmented into <20 feet, 20–40 feet, and >40 feet. Of these, the 20–40 feet segment is expected to have the largest market share as this size fits most applications since it is versatile and practical. Boats in the 20-40 feet segment are apt for a range of applications, from inland and coastal navigation, research, and surveillance to leisure activities. Autonomous technology is less challenging to fit into this size category compared to larger boats, as they require fewer complicated systems and modifications at lower costs. Their size also makes them more appealing to commercial and governmental organizations for effective deployment and operation across various marine bodies. Improved technology continuing to become available at lower costs will also cause the 20–40 feet segment to see further growth and usage.

Based on autonomy, the partially autonomous segment will command the largest share of the autonomous boats market.

Based on autonomy, the autonomous boats market has been segmented into partially autonomous, remotely operated, and fully autonomous. The partially autonomous segment is estimated to have the largest market share due to its advantages, such as higher efficiency, reliability, and safety, compared to manned boats. These vessels are also ideal for research and surveillance applications since they operate independently using artificial intelligence, machine learning, and complex sensor systems. Most importantly, partially autonomous boats can run continuously with a minimal crew requirement, leading to low operating costs and longer running hours. As technology develops further and regulatory frameworks evolve to foster innovations, the partially autonomous boats segment is likely to capture the highest percentage share in the market.

Europe is projected to hold the largest market share in 2024.

The maximum share in the autonomous boat market will be captured by Europe, which has an advanced technological ecosystem combined with a rich maritime sector and proactive regulatory framework. High research & development investments are supported by funding through both, government and private sectors, which drive innovation in autonomous navigation and control systems. In Europe, environmental regulations regarding vessels' optimal fuel efficiency with minimal emissions are stringent and act as a catalyst to demand for autonomous boats to comply with them. Moreover, solid maritime infrastructure coupled with an increase in demand for sophisticated solutions in the same industry further solidifies the strong position of Europe in the global market.

Autonomous Boats Market by Region

Autonomous Boats Markett by Region

To know about the assumptions considered for the study, download the pdf brochure

Key Market Players

The major players in the autonomous boats companies are Kongsberg Maritime (Norway), ABB (Switzerland), Rolls-Royce PLC (UK), Hyundai Heavy Industries (South Korea), Fugro (Netherlands), BAE Systems (UK), Wartsila (Finland), Garmin Ltd (US), Siemens (Germany), L3Harris ASV (UK), Navico Group (Norway), ComNav Marine Ltd (Canada), Praxis Automation Technology B.V. (Netherlands), Metal shark (US), Raymarine (UK), Furuno Electric Co., Ltd (Japan), Anschütz GmbH (Germany), Buffalo Automation (US), SeeByte (UK), Callboats (Germany), SubSea Craft Ltd (UK), Dockmate (US), Navier (US), Roboat (Netherlands), and Sea Machines Robotics (US). These players have adopted various growth strategies to expand their presence in the autonomous boats market.

Get online access to the report on the World's First Market Intelligence Cloud

  • Easy to Download Historical Data & Forecast Numbers
  • Company Analysis Dashboard for high growth potential opportunities
  • Research Analyst Access for customization & queries
  • Competitor Analysis with Interactive dashboard
  • Latest News, Updates & Trend analysis
Request Sample

Scope of the Report

Report Metric

Details

Market size available for years

2020-2029

Base year considered

2023

Forecast period

2024-2029

Forecast units

Value (USD)

Segments Covered

By Type, Autonomy, Propulsion, Boat Size and Region


Geographies covered

North America, Europe, Asia Pacific, Middle East, Latin America & Africa

Companies covered

Kongsberg Maritime(Norway), ABB( Switzerland), Rolls-Royce PLC (UK), Hyundai Heavy Industries(South Korea), and Fugro (Netherlands)

Autonomous Boats Market Highlights

This research report categorizes the autonomous boats markets based on Type, Autonomy, Propulsion, Boat Size and Region.

Segment

Subsegment

By Propulsion

  • Hybird Electric
  • Fuel Powered
  • Fully Electric

By Type

  • Recreational Boats
  • Commercial Boats
  • Miltary & Law Enforcement Boats

By Autonomy

  • Partially Autonomous
  • Remotely Operated
  • Fully Autonomous

By Boat Size

  • <20 Feet
  • 20-40 Feet
  • > 40 Feet

By Region

  • North America
  • Europe
  • Asia Pacific
  • Middle East
  • Latin America & Africa

Recent Developments

  • In May 2022, Kongsberg Maritime (KM) and Cadeler, a Danish Shipbuilding company, signed a three-part contract under which KM will deliver a new vessel to Cadeler. As per the first contract, KM will provide the F-Class jackup to help the vessel increase its capacity. The second contract involves a wind turbine installation vessel (WTIV), followed by the third contract, in which KM will provide installation and technical assistance for the vessel using its integrated solutions.
  • In September 2021, Rolls-Royce PLC and Sea Machines signed an agreement to cooperate on the development of smart ships and autonomous ship control solutions. As part of this agreement, Rolls-Royce's business unit Power Systems and Sea Machines, the leading developer of remote-vessel command and autonomous control systems, will join forces on the development and sale of fully and semi-autonomous vessel control systems.
  • In January 2022, Avikus, the in-house venture of Hyundai Heavy Industries (HHI) specializing in developing autonomous navigational systems, signed a memorandum of understanding (MoU) with ABS to obtain the Approval in Principle (AiP) for the implementation of autonomous ship technologies. Under the MoU, ABS will work with HHI's Korea Shipbuilding and Offshore Engineering (KSOE) and Avikus to integrate autonomous and remote-control functions into vessels.
  • In September 2021, Fugro signed a contract with Kooiman Engineering and Van Oossanen Naval Architects, which includes the naval design of Blue Prism, Fugro's next generation of uncrewed surface vessels (USVs).
  • In May 2024, Metal Shark was one of two builders awarded a seven-year indefinite-delivery/indefinite-quantity (IDIQ) contract worth up to USD 290 million to produce up to seventy-three 40-foot "40 PB" patrol boats for the US Naval Expeditionary Combat Command.
  • In May 2023, SAIC partnered with GomSpace to provide US customers with new space-based mission capabilities using CubeSats and SmallSats. This partnership combined SAIC's expertise with GomSpace's spacecraft technologies for the rapid deployment of solutions, including software, spacecraft components, and mission operations.

Frequently Asked Questions:

To speak to our analyst for a discussion on the above findings, click Speak to Analyst

TABLE OF CONTENTS
 
1 INTRODUCTION (Page No. - 25)
    1.1 STUDY OBJECTIVES 
    1.2 MARKET DEFINITION 
    1.3 STUDY SCOPE 
           1.3.1 MARKETS COVERED
           1.3.2 YEARS CONSIDERED
    1.4 INCLUSIONS AND EXCLUSIONS 
    1.5 CURRENCY CONSIDERED 
    1.6 STAKEHOLDERS 
 
2 RESEARCH METHODOLOGY (Page No. - 29)
    2.1 RESEARCH DATA 
           2.1.1 SECONDARY DATA
                    2.1.1.1 Key data from secondary sources
           2.1.2 PRIMARY DATA
                    2.1.2.1 Key data from primary sources
    2.2 FACTOR ANALYSIS 
           2.2.1 INTRODUCTION
           2.2.2 DEMAND-SIDE INDICATORS
           2.2.3 SUPPLY-SIDE ANALYSIS
    2.3 MARKET SIZE ESTIMATION 
    2.4 RESEARCH APPROACH AND METHODOLOGY 
           2.4.1 BOTTOM-UP APPROACH
                    2.4.1.1 Autonomous boats market
                    2.4.1.2 Autonomous boats market: North America
           2.4.2 TOP-DOWN APPROACH
    2.5 DATA TRIANGULATION 
           2.5.1 TRIANGULATION THROUGH PRIMARY AND SECONDARY RESEARCH
    2.6 RESEARCH ASSUMPTIONS 
    2.7 RISK ASSESSMENT 
    2.8 RESEARCH LIMITATIONS 
 
3 EXECUTIVE SUMMARY (Page No. - 38)
 
4 PREMIUM INSIGHTS (Page No. - 42)
    4.1 ATTRACTIVE OPPORTUNITIES FOR PLAYERS IN AUTONOMOUS BOATS MARKET 
    4.2 AUTONOMOUS BOATS MARKET, BY PROPULSION 
    4.3 AUTONOMOUS BOATS MARKET, BY AUTONOMY 
    4.4 AUTONOMOUS BOATS MARKET, BY BOAT SIZE 
    4.5 AUTONOMOUS BOATS MARKET, BY TYPE 
    4.6 AUTONOMOUS BOATS MARKET, BY COUNTRY 
 
5 MARKET OVERVIEW (Page No. - 45)
    5.1 INTRODUCTION 
    5.2 MARKET DYNAMICS 
           5.2.1 DRIVERS
                    5.2.1.1 Growing maritime tourism
                    5.2.1.2 Emergence of green boating solutions and focus on sustainability
                    5.2.1.3 Advancements in marine technology
                    5.2.1.4 Growing use of automation to prevent human errors
                    5.2.1.5 Growing maritime sports industry
                    5.2.1.6 Increasing demand for maritime security and surveillance
                    5.2.1.7 Rising demand for situational awareness in vessels
           5.2.2 RESTRAINTS
                    5.2.2.1 Vulnerability associated with cyber threats
                    5.2.2.2 Integration with existing infrastructure
           5.2.3 OPPORTUNITIES
                    5.2.3.1 Development of high-power batteries
                    5.2.3.2 Revision and formulation of marine safety regulations in several countries
                    5.2.3.3 Advancements in sensor technology for improved navigation
                    5.2.3.4 Development of enhanced propulsion systems
           5.2.4 CHALLENGES
                    5.2.4.1 Cost-intensive customization of marine automation systems
                    5.2.4.2 Lack of skilled personnel to operate marine automation systems
                    5.2.4.3 Lack of common standards for data generated from different subsystems
                    5.2.4.4 Regulatory barriers
    5.3 TRENDS/DISRUPTIONS IMPACTING CUSTOMER BUSINESS 
    5.4 VALUE CHAIN ANALYSIS OF AUTONOMOUS BOATS MARKET 
           5.4.1 RESEARCH & DEVELOPMENT
           5.4.2 RAW MATERIALS
           5.4.3 COMPONENT MANUFACTURERS (OEMS)
           5.4.4 ASSEMBLERS & INTEGRATORS
           5.4.5 END USERS
    5.5 MARKET ECOSYSTEM 
           5.5.1 PROMINENT COMPANIES
           5.5.2 PRIVATE AND SMALL ENTERPRISES
           5.5.3 END USERS
    5.6 REGULATORY LANDSCAPE 
           5.6.1 NORTH AMERICA
           5.6.2 EUROPE
           5.6.3 ASIA PACIFIC
           5.6.4 MIDDLE EAST
           5.6.5 LATIN AMERICA & AFRICA
    5.7 TRADE DATA 
    5.8 TECHNOLOGY ANALYSIS 
           5.8.1 KEY TECHNOLOGY
                    5.8.1.1 Autonomous navigation systems for marine vessels
                    5.8.1.2 AI-based marine autonomous systems
           5.8.2 COMPLEMENTARY TECHNOLOGY
                    5.8.2.1 Sensor fusion solutions
                    5.8.2.2 Voyage data recorders
    5.9 KEY STAKEHOLDERS AND BUYING CRITERIA 
           5.9.1 KEY STAKEHOLDERS IN BUYING PROCESS
           5.9.2 BUYING CRITERIA
    5.10 USE CASES 
           5.10.1 USE OF 5G IN AUTONOMOUS MOBILITY CHAIN FOR LOCAL PUBLIC TRANSPORT IN KEIL
           5.10.2 CHINA LAUNCHES ITS FIRST AUTONOMOUS CONTAINER SHIP IN SERVICE
           5.10.3 AUTONOMOUS MARINE SURVEY BY DEEP BV
    5.11 PRICING ANALYSIS 
           5.11.1 AVERAGE SELLING PRICE, BY AUTONOMY
           5.11.2 INDICATIVE PRICING ANALYSIS, BY AUTONOMY
    5.12 KEY CONFERENCES AND EVENTS, 2024–25 
    5.13 INVESTMENT AND FUNDING SCENARIO 
    5.14 BUSINESS MODEL 
    5.15 TOTAL COST OF OWNERSHIP 
    5.16 BILL OF MATERIALS 
    5.17 TECHNOLOGY ROADMAP 
    5.18 VOLUME DATA 
    5.19 IMPACT OF AI IN AUTONOMOUS BOATS 
           5.19.1 INTRODUCTION
           5.19.2 ADOPTION OF AI IN MARINE BY TOP COUNTRIES
           5.19.3 IMPACT OF AI ON MARINE SECTOR: USE CASES
           5.19.4 IMPACT OF AI ON AUTONOMOUS BOATS MARKET
 
6 INDUSTRY TRENDS (Page No. - 78)
    6.1 INTRODUCTION 
    6.2 TECHNOLOGY TRENDS 
           6.2.1 DIGITAL MARINE AUTOMATION SYSTEMS
           6.2.2 ADVANCED PROPULSION SYSTEMS
           6.2.3 DIGITAL TWIN
           6.2.4 CO-PILOT NAVIGATION
           6.2.5 EDGE COMPUTING
    6.3 IMPACT OF MEGATRENDS 
           6.3.1 3D PRINTING
           6.3.2 ARTIFICIAL INTELLIGENCE
           6.3.3 BIG DATA ANALYTICS
           6.3.4 INTERNET OF THINGS
    6.4 SUPPLY CHAIN ANALYSIS 
    6.5 PATENT ANALYSIS 
 
7 AUTONOMOUS BOATS MARKET, BY AUTONOMY (Page No. - 87)
    7.1 INTRODUCTION 
    7.2 FULLY AUTONOMOUS 
           7.2.1 INCREASING TECHNOLOGICAL ADVANCEMENTS AND OPERATIONAL EFFICIENCY TO DRIVE MARKET
    7.3 REMOTELY OPERATED 
           7.3.1 FOCUS ON COST REDUCTION AND OPERATIONAL EFFICIENCY TO DRIVE MARKET
    7.4 PARTIALLY AUTONOMOUS 
           7.4.1 HUMAN-AI COLLABORATION TO DRIVE SEGMENT
 
8 AUTONOMOUS BOATS MARKET, BY PROPULSION (Page No. - 91)
    8.1 INTRODUCTION 
    8.2 FULLY ELECTRIC 
           8.2.1 ENHANCEMENTS IN BATTERY TECHNOLOGY AND ELECTRIC PROPULSION SYSTEMS TO DRIVE MARKET
    8.3 FUEL-POWERED 
           8.3.1 ENHANCEMENT IN DESIGN PARAMETERS TO BOOST GROWTH
    8.4 HYBRID ELECTRIC 
           8.4.1 INCREASING FOCUS ON BALANCING POWER AND SUSTAINABILITY TO DRIVE MARKET
 
9 AUTONOMOUS BOATS MARKET, BY TYPE (Page No. - 94)
    9.1 INTRODUCTION 
    9.2 RECREATIONAL BOATS 
           9.2.1 INCREASING DEMAND FOR ENHANCED USER EXPERIENCE AND CONVENIENCE TO DRIVE MARKET
           9.2.2 CRUISING BOATS
           9.2.3 SPEEDBOATS
    9.3 COMMERCIAL BOATS 
           9.3.1 SIGNIFICANT OPERATIONAL EFFICIENCIES AND COST SAVINGS TO DRIVE MARKET
           9.3.2 PASSENGER/CREW FERRY BOATS
           9.3.3 TUGS AND WORK BOATS
           9.3.4 OTHER COMMERCIAL BOATS
    9.4 MILITARY & LAW ENFORCEMENT BOATS 
           9.4.1 NEED FOR ENHANCED SECURITY AND REDUCED RISK TO PERSONNEL TO DRIVE MARKET
           9.4.2 PATROL BOATS
           9.4.3 COMBAT BOATS
 
10 AUTONOMOUS BOATS MARKET, BY BOAT SIZE (Page No. - 100)
     10.1 INTRODUCTION 
     10.2 <20 FEET 
             10.2.1 EASE OF DEPLOYMENT AND PORTABILITY TO DRIVE SEGMENT
     10.3 20--40 FEET 
             10.3.1 STABILITY AND VAST APPLICATIONS TO DRIVE MARKET
     10.4 >40 FEET 
             10.4.1 HIGH PAYLOAD AND ENDURANCE CAPACITY TO DRIVE MARKET
 
11 AUTONOMOUS BOATS MARKET, BY REGION (Page No. - 103)
     11.1 INTRODUCTION 
     11.2 NORTH AMERICA 
             11.2.1 NORTH AMERICA: PESTLE ANALYSIS
             11.2.2 MACROECONOMIC OUTLOOK FOR NORTH AMERICA
                        11.2.2.1 US
                                     11.2.2.1.1 Increase in naval vessel building to drive market
                        11.2.2.2 Canada
                                     11.2.2.2.1 Rising emphasis on environmental monitoring to drive market
     11.3 EUROPE 
             11.3.1 EUROPE: PESTLE ANALYSIS
             11.3.2 MACROECONOMIC OUTLOOK FOR EUROPE
                        11.3.2.1 UK
                                     11.3.2.1.1 Rapid market growth expected through advanced product launches
                        11.3.2.2 France
                                     11.3.2.2.1 Focus on sustainable and innovative solutions to fuel market
                        11.3.2.3 Germany
                                     11.3.2.3.1 Robust R&D and engineering expertise to propel market
                        11.3.2.4 Denmark
                                     11.3.2.4.1 Increasing investment in R&D and startups to drive market
                        11.3.2.5 Norway
                                     11.3.2.5.1 Strategic partnerships and commercialization to drive market
                        11.3.2.6 Rest of Europe
     11.4 ASIA PACIFIC 
             11.4.1 ASIA PACIFIC: PESTLE ANALYSIS
             11.4.2 MACROECONOMIC OUTLOOK FOR ASIA PACIFIC
                        11.4.2.1 China
                                     11.4.2.1.1 Increase in naval spending and rise in domestic ship production to drive market
                        11.4.2.2 India
                                     11.4.2.2.1 Adoption of autonomous boats for military applications to drive market
                        11.4.2.3 Japan
                                     11.4.2.3.1 Autonomous maritime systems technology development program to boost market
                        11.4.2.4 South Korea
                                     11.4.2.4.1 Rising investments in autonomous ship technology to fuel market
                        11.4.2.5 Rest of Asia Pacific
     11.5 MIDDLE EAST 
             11.5.1 MIDDLE EAST: PESTLE ANALYSIS
             11.5.2 MACROECONOMIC OUTLOOK FOR MIDDLE EAST
             11.5.3 GULF COOPERATION COUNCIL (GCC)
                        11.5.3.1 UAE
                                     11.5.3.1.1 Increasing technological advancements and government initiatives to drive market
                        11.5.3.2 Saudi Arabia
                                     11.5.3.2.1 Strategic innovation and Vision 2030 to drive market
             11.5.4 REST OF MIDDLE EAST
     11.6 LATIN AMERICA AND AFRICA 
             11.6.1 LATIN AMERICA & AFRICA: PESTLE ANALYSIS
             11.6.2 MACROECONOMIC OUTLOOK FOR LATIN AMERICA & AFRICA
                        11.6.2.1 Brazil
                                     11.6.2.1.1 Increasing investments and strategic partnerships in maritime infrastructure to drive market
                        11.6.2.2 Mexico
                                     11.6.2.2.1 Demand for efficient and cost-effective maritime transportation solutions to drive market
                        11.6.2.3 Africa
                                     11.6.2.3.1 Launch of African Marine Autonomous Research Initiative to drive market
 
12 COMPETITIVE LANDSCAPE (Page No. - 162)
     12.1 INTRODUCTION 
     12.2 KEY PLAYER STRATEGIES/RIGHT TO WIN 
     12.3 MARKET SHARE ANALYSIS 
     12.4 REVENUE ANALYSIS 
     12.5 COMPANY EVALUATION MATRIX: KEY PLAYERS, 2023 
             12.5.1 STARS
             12.5.2 EMERGING LEADERS
             12.5.3 PERVASIVE PLAYERS
             12.5.4 PARTICIPANTS
             12.5.5 COMPANY FOOTPRINT
                        12.5.5.1 Propulsion footprint
                        12.5.5.2 Type footprint
                        12.5.5.3 Autonomy footprint
                        12.5.5.4 Region footprint
     12.6 COMPANY VALUATION AND FINANCIAL METRICS, 2023 
     12.7 COMPANY EVALUATION MATRIX: STARTUPS/SMES, 2023 
             12.7.1 PROGRESSIVE COMPANIES
             12.7.2 RESPONSIVE COMPANIES
             12.7.3 DYNAMIC COMPANIES
             12.7.4 STARTING BLOCKS
             12.7.5 COMPETITIVE BENCHMARKING: STARTUPS/SMES, 2023
                        12.7.5.1 Detailed list of key startups/SMEs
                        12.7.5.2 Competitive benchmarking of key startups/SMEs
     12.8 BRAND/PRODUCT COMPARISON 
     12.9 COMPETITIVE SCENARIO 
             12.9.1 PRODUCT LAUNCHES
             12.9.2 DEALS
             12.9.3 EXPANSIONS
             12.9.4 OTHER DEVELOPMENTS
 
13 COMPANY PROFILES (Page No. - 179)
     13.1 KEY PLAYERS 
             13.1.1 KONGSBERG MARITIME
                        13.1.1.1 Business overview
                        13.1.1.2 Products/Solutions/Services offered
                        13.1.1.3 Recent developments
                                     13.1.1.3.1 Deals
                                     13.1.1.3.2 Expansions
                        13.1.1.4 MnM view
                                     13.1.1.4.1 Key strengths
                                     13.1.1.4.2 Strategic choices
                                     13.1.1.4.3 Weaknesses and competitive threats
             13.1.2 ABB
                        13.1.2.1 Business overview
                        13.1.2.2 Products/Solutions/Services offered
                        13.1.2.3 MnM view
                                     13.1.2.3.1 Key strengths
                                     13.1.2.3.2 Strategic choices
                                     13.1.2.3.3 Weaknesses and competitive threats
             13.1.3 ROLLS-ROYCE PLC
                        13.1.3.1 Business overview
                        13.1.3.2 Products/Solutions/Services offered
                        13.1.3.3 Recent developments
                                     13.1.3.3.1 Deals
                        13.1.3.4 MNM view
                                     13.1.3.4.1 Key strengths
                                     13.1.3.4.2 Strategic choices
                                     13.1.3.4.3 Weaknesses and competitive threats
             13.1.4 HYUNDAI HEAVY INDUSTRIES
                        13.1.4.1 Business overview
                        13.1.4.2 Products/Solutions/Services offered
                        13.1.4.3 Recent developments
                                     13.1.4.3.1 Deals
                                     13.1.4.3.2 Other developments
                        13.1.4.4 MNM view
                                     13.1.4.4.1 Key strengths
                                     13.1.4.4.2 Strategic choices
                                     13.1.4.4.3 Weaknesses and competitive threats
             13.1.5 FUGRO
                        13.1.5.1 Business overview
                        13.1.5.2 Products/Solutions/Services offered
                        13.1.5.3 Recent developments
                                     13.1.5.3.1 Product launches
                                     13.1.5.3.2 Deals
                        13.1.5.4 MNM view
                                     13.1.5.4.1 Key strengths
                                     13.1.5.4.2 Strategic choices
                                     13.1.5.4.3 Weaknesses and competitive threats
             13.1.6 WARTSILA
                        13.1.6.1 Business overview
                        13.1.6.2 Products/Solutions/Services offered
             13.1.7 SIEMENS
                        13.1.7.1 Business overview
                        13.1.7.2 Products/Solutions/Services offered
             13.1.8 L3HARRIS ASV
                        13.1.8.1 Business overview
                        13.1.8.2 Products/Solutions/Services offered
                        13.1.8.3 Recent developments
                                     13.1.8.3.1 Expansions
             13.1.9 SEA MACHINE ROBOTICS
                        13.1.9.1 Business overview
                        13.1.9.2 Products/Solutions/Services offered
             13.1.10 SUBSEA CRAFT LTD.
                        13.1.10.1 Business overview
                        13.1.10.2 Products/Solutions/Services offered
             13.1.11 METAL SHARK
                        13.1.11.1 Business overview
                        13.1.11.2 Products/Solutions/Services offered
                        13.1.11.3 Recent developments
                                     13.1.11.3.1 Other developments
             13.1.12 BAE SYSTEMS
                        13.1.12.1 Business overview
                        13.1.12.2 Products/Solutions/Services offered
             13.1.13 NAVIER
                        13.1.13.1 Business overview
                        13.1.13.2 Products/Solutions/Services offered
             13.1.14 CALLBOATS
                        13.1.14.1 Business overview
                        13.1.14.2 Products/Solutions/Services offered
             13.1.15 ROBOAT
                        13.1.15.1 Business overview
                        13.1.15.2 Products/Solutions/Services offered
     13.2 OTHER PLAYERS 
             13.2.1 BUFFALO AUTOMATION
             13.2.2 RAYMARINE
             13.2.3 NAVICO GROUP
             13.2.4 FURUNO ELECTRIC CO., LTD.
             13.2.5 GARMIN LTD
             13.2.6 ANSCHÜTZ GMBH
             13.2.7 COMNAV
             13.2.8 DOCKMATE
             13.2.9 SEEBYTE
             13.2.10 PRAXIS AUTOMATION TECHNOLOGY B.V.
 
14 APPENDIX (Page No. - 213)
     14.1 DISCUSSION GUIDE 
     14.2 KNOWLEDGESTORE: MARKETSANDMARKETS’ SUBSCRIPTION PORTAL 
     14.3 CUSTOMIZATION OPTIONS 
     14.4 RELATED REPORTS 
     14.5 AUTHOR DETAILS 
 
LIST OF TABLES (258 TABLES)
 
TABLE 1 INCLUSIONS AND EXCLUSIONS
TABLE 2 USD EXCHANGE RATES
TABLE 3 ROLE OF COMPANIES IN ECOSYSTEM
TABLE 4 NORTH AMERICA: REGULATORY BODIES, GOVERNMENT AGENCIES, AND OTHERS
TABLE 5 EUROPE: REGULATORY BODIES, GOVERNMENT AGENCIES, AND OTHERS
TABLE 6 ASIA PACIFIC: REGULATORY BODIES, GOVERNMENT AGENCIES, AND OTHERS
TABLE 7 MIDDLE EAST: REGULATORY BODIES, GOVERNMENT AGENCIES, AND OTHERS
TABLE 8 LATIN AMERICA & AFRICA: REGULATORY BODIES, GOVERNMENT AGENCIES, AND OTHERS
TABLE 9 INFLUENCE OF STAKEHOLDERS ON BUYING PROCESS, BY TYPE (%)
TABLE 10 KEY BUYING CRITERIA, BY TYPE
TABLE 11 AVERAGE SELLING PRICE OF RECREATIONAL BOATS, BY AUTONOMY (USD MILLION)
TABLE 12 AVERAGE SELLING PRICE OF COMMERCIAL BOATS, BY AUTONOMY (USD MILLION)
TABLE 13 AVERAGE SELLING PRICE OF MILITARY & LAW ENFORCEMENT BOATS, BY AUTONOMY (USD MILLION)
TABLE 14 AUTONOMOUS BOATS MARKET: CONFERENCES AND EVENTS
TABLE 15 AUTONOMOUS BOATS: BUSINESS MODEL COMPARISON
TABLE 16 BILL OF MATERIALS FOR AUTONOMOUS BOATS, BY TYPE (%)
TABLE 17 AUTONOMOUS BOATS MARKET, BY TYPE, 2019–2029 (UNITS)
TABLE 18 AUTONOMOUS BOATS MARKET: KEY PATENTS, 2021–2023
TABLE 19 AUTONOMOUS BOATS MARKET, BY AUTONOMY, 2020–2023 (USD MILLION)
TABLE 20 AUTONOMOUS BOATS MARKET, BY AUTONOMY, 2024–2029 (USD MILLION)
TABLE 21 AUTONOMOUS BOATS MARKET, BY PROPULSION, 2020–2023 (USD MILLION)
TABLE 22 AUTONOMOUS BOATS MARKET, BY PROPULSION, 2024–2029 (USD MILLION)
TABLE 23 AUTONOMOUS BOATS MARKET, BY TYPE, 2020–2023 (USD MILLION)
TABLE 24 AUTONOMOUS BOATS MARKET, BY TYPE, 2024–2029 (USD MILLION)
TABLE 25 AUTONOMOUS RECREATIONAL BOATS MARKET, BY TYPE, 2020–2023 (USD MILLION)
TABLE 26 AUTONOMOUS RECREATIONAL BOATS MARKET, BY TYPE, 2024–2029 (USD MILLION)
TABLE 27 AUTONOMOUS COMMERCIAL BOATS MARKET, BY TYPE, 2020–2023 (USD MILLION)
TABLE 28 AUTONOMOUS COMMERCIAL BOATS MARKET, BY TYPE, 2024–2029 (USD MILLION)
TABLE 29 AUTONOMOUS MILITARY & LAW ENFORCEMENT BOATS MARKET, BY TYPE,  2020–2023 (USD MILLION)
TABLE 30 AUTONOMOUS MILITARY & LAW ENFORCEMENT BOATS MARKET, BY TYPE,  2024–2029 (USD MILLION)
TABLE 31 AUTONOMOUS BOATS MARKET, BY BOAT SIZE, 2020–2023 (USD MILLION)
TABLE 32 AUTONOMOUS BOATS MARKET, BY BOAT SIZE, 2024–2029 (USD MILLION)
TABLE 33 AUTONOMOUS BOATS MARKET, BY REGION 2020–2023 (USD MILLION)
TABLE 34 AUTONOMOUS BOATS MARKET, BY REGION, 2024–2029 (USD MILLION)
TABLE 35 NORTH AMERICA: AUTONOMOUS BOATS MARKET, BY COUNTRY,  2020–2023 (USD MILLION)
TABLE 36 NORTH AMERICA: AUTONOMOUS BOATS MARKET, BY COUNTRY,  2024–2029 (USD MILLION)
TABLE 37 NORTH AMERICA: AUTONOMOUS BOATS MARKET, BY TYPE, 2020–2023 (USD MILLION)
TABLE 38 NORTH AMERICA: AUTONOMOUS BOATS MARKET, BY TYPE, 2024–2029 (USD MILLION)
TABLE 39 NORTH AMERICA: AUTONOMOUS BOATS MARKET, BY PROPULSION,  2020–2023 (USD MILLION)
TABLE 40 NORTH AMERICA: AUTONOMOUS BOATS MARKET, BY PROPULSION,  2024–2029 (USD MILLION)
TABLE 41 NORTH AMERICA: AUTONOMOUS BOATS MARKET, BY BOAT SIZE,  2020–2023 (USD MILLION)
TABLE 42 NORTH AMERICA: AUTONOMOUS BOATS MARKET, BY BOAT SIZE,  2024–2029 (USD MILLION)
TABLE 43 NORTH AMERICA: AUTONOMOUS BOATS MARKET, BY AUTONOMY,  2020–2023 (USD MILLION)
TABLE 44 NORTH AMERICA: AUTONOMOUS BOATS MARKET, BY AUTONOMY, 2024–2029 (USD MILLION)
TABLE 45 US: AUTONOMOUS BOATS MARKET, BY TYPE, 2020–2023 (USD MILLION)
TABLE 46 US: AUTONOMOUS BOATS MARKET, BY TYPE, 2024–2029 (USD MILLION)
TABLE 47 US: AUTONOMOUS BOATS MARKET, BY PROPULSION, 2020–2023 (USD MILLION)
TABLE 48 US: AUTONOMOUS BOATS MARKET, BY PROPULSION, 2024–2029 (USD MILLION)
TABLE 49 US: AUTONOMOUS BOATS MARKET, BY AUTONOMY, 2020–2023 (USD MILLION)
TABLE 50 US: AUTONOMOUS BOATS MARKET, BY AUTONOMY, 2024–2029 (USD MILLION)
TABLE 51 CANADA: AUTONOMOUS BOATS MARKET, BY TYPE, 2020–2023 (USD MILLION)
TABLE 52 CANADA: AUTONOMOUS BOATS MARKET, BY TYPE, 2024–2029 (USD MILLION)
TABLE 53 CANADA: AUTONOMOUS BOATS MARKET, BY PROPULSION, 2020–2023 (USD MILLION)
TABLE 54 CANADA: AUTONOMOUS BOATS MARKET, BY PROPULSION, 2024–2029 (USD MILLION)
TABLE 55 CANADA: AUTONOMOUS BOATS MARKET, BY AUTONOMY, 2020–2023 (USD MILLION)
TABLE 56 CANADA: AUTONOMOUS BOATS MARKET, BY AUTONOMY, 2024–2029 (USD MILLION)
TABLE 57 EUROPE: AUTONOMOUS BOATS MARKET, BY COUNTRY, 2020–2023 (USD MILLION)
TABLE 58 EUROPE: AUTONOMOUS BOATS MARKET, BY COUNTRY, 2024–2029 (USD MILLION)
TABLE 59 EUROPE: AUTONOMOUS BOATS MARKET, BY TYPE, 2020–2023 (USD MILLION)
TABLE 60 EUROPE: AUTONOMOUS BOATS MARKET, BY TYPE, 2024–2029 (USD MILLION)
TABLE 61 EUROPE: AUTONOMOUS BOATS MARKET, BY PROPULSION, 2020–2023 (USD MILLION)
TABLE 62 EUROPE: AUTONOMOUS BOATS MARKET, BY PROPULSION, 2024–2029 (USD MILLION)
TABLE 63 EUROPE: AUTONOMOUS BOATS MARKET, BY BOAT SIZE, 2020–2023 (USD MILLION)
TABLE 64 EUROPE: AUTONOMOUS BOATS MARKET, BY BOAT SIZE, 2024–2029 (USD MILLION)
TABLE 65 EUROPE: AUTONOMOUS BOATS MARKET, BY AUTONOMY, 2020–2023 (USD MILLION)
TABLE 66 EUROPE: AUTONOMOUS BOATS MARKET, BY AUTONOMY, 2024–2029 (USD MILLION)
TABLE 67 UK: AUTONOMOUS BOATS MARKET, BY TYPE, 2020–2023 (USD MILLION)
TABLE 68 UK: AUTONOMOUS BOATS MARKET, BY TYPE, 2024–2029 (USD MILLION)
TABLE 69 UK: AUTONOMOUS BOATS MARKET, BY PROPULSION, 2020–2023 (USD MILLION)
TABLE 70 UK: AUTONOMOUS BOATS MARKET, BY PROPULSION, 2024–2029 (USD MILLION)
TABLE 71 UK: AUTONOMOUS BOATS MARKET, BY AUTONOMY, 2020–2023 (USD MILLION)
TABLE 72 UK: AUTONOMOUS BOATS MARKET, BY AUTONOMY, 2024–2029 (USD MILLION)
TABLE 73 FRANCE: AUTONOMOUS BOATS MARKET, BY TYPE, 2020–2023 (USD MILLION)
TABLE 74 FRANCE: AUTONOMOUS BOATS MARKET, BY TYPE, 2024–2029 (USD MILLION)
TABLE 75 FRANCE: AUTONOMOUS BOATS MARKET, BY PROPULSION, 2020–2023 (USD MILLION)
TABLE 76 FRANCE: AUTONOMOUS BOATS MARKET, BY PROPULSION, 2024–2029 (USD MILLION)
TABLE 77 FRANCE: AUTONOMOUS BOATS MARKET, BY AUTONOMY, 2020–2023 (USD MILLION)
TABLE 78 FRANCE: AUTONOMOUS BOATS MARKET, BY AUTONOMY, 2024–2029 (USD MILLION)
TABLE 79 GERMANY: AUTONOMOUS BOATS MARKET, BY TYPE, 2020–2023 (USD MILLION)
TABLE 80 GERMANY: AUTONOMOUS BOATS MARKET, BY TYPE, 2024–2029 (USD MILLION)
TABLE 81 GERMANY: AUTONOMOUS BOATS MARKET, BY PROPULSION, 2020–2023 (USD MILLION)
TABLE 82 GERMANY: AUTONOMOUS BOATS MARKET, BY PROPULSION, 2024–2029 (USD MILLION)
TABLE 83 GERMANY: AUTONOMOUS BOATS MARKET, BY AUTONOMY, 2020–2023 (USD MILLION)
TABLE 84 GERMANY: AUTONOMOUS BOATS MARKET, BY AUTONOMY, 2024–2029 (USD MILLION)
TABLE 85 DENMARK: AUTONOMOUS BOATS MARKET, BY TYPE, 2020–2023 (USD MILLION)
TABLE 86 DENMARK: AUTONOMOUS BOATS MARKET, BY TYPE, 2024–2029 (USD MILLION)
TABLE 87 DENMARK: AUTONOMOUS BOATS MARKET, BY PROPULSION, 2020–2023 (USD MILLION)
TABLE 88 DENMARK: AUTONOMOUS BOATS MARKET, BY PROPULSION, 2024–2029 (USD MILLION)
TABLE 89 DENMARK: AUTONOMOUS BOATS MARKET, BY AUTONOMY, 2020–2023 (USD MILLION)
TABLE 90 DENMARK: AUTONOMOUS BOATS MARKET, BY AUTONOMY, 2024–2029 (USD MILLION)
TABLE 91 NORWAY: AUTONOMOUS BOATS MARKET, BY TYPE, 2020–2023 (USD MILLION)
TABLE 92 NORWAY: AUTONOMOUS BOATS MARKET, BY TYPE, 2024–2029 (USD MILLION)
TABLE 93 NORWAY: AUTONOMOUS BOATS MARKET, BY PROPULSION, 2020–2023 (USD MILLION)
TABLE 94 NORWAY: AUTONOMOUS BOATS MARKET, BY PROPULSION, 2024–2029 (USD MILLION)
TABLE 95 NORWAY: AUTONOMOUS BOATS MARKET, BY AUTONOMY, 2020–2023 (USD MILLION)
TABLE 96 NORWAY: AUTONOMOUS BOATS MARKET, BY AUTONOMY, 2024–2029 (USD MILLION)
TABLE 97 REST OF EUROPE: AUTONOMOUS BOATS MARKET, BY TYPE, 2020–2023 (USD MILLION)
TABLE 98 REST OF EUROPE: AUTONOMOUS BOATS MARKET, BY TYPE, 2024–2029 (USD MILLION)
TABLE 99 REST OF EUROPE: AUTONOMOUS BOATS MARKET, BY PROPULSION,  2020–2023 (USD MILLION)
TABLE 100 REST OF EUROPE: AUTONOMOUS BOATS MARKET, BY PROPULSION,  2024–2029 (USD MILLION)
TABLE 101 REST OF EUROPE: AUTONOMOUS BOATS MARKET, BY AUTONOMY,  2020–2023 (USD MILLION)
TABLE 102 REST OF EUROPE: AUTONOMOUS BOATS MARKET, BY AUTONOMY,  2024–2029 (USD MILLION)
TABLE 103 ASIA PACIFIC: AUTONOMOUS BOATS MARKET, BY COUNTRY, 2020–2023 (USD MILLION)
TABLE 104 ASIA PACIFIC: AUTONOMOUS BOATS MARKET, BY COUNTRY, 2024–2029 (USD MILLION)
TABLE 105 ASIA PACIFIC: AUTONOMOUS BOATS MARKET, BY TYPE, 2020–2023 (USD MILLION)
TABLE 106 ASIA PACIFIC: AUTONOMOUS BOATS MARKET, BY TYPE, 2024–2029 (USD MILLION)
TABLE 107 ASIA PACIFIC: AUTONOMOUS BOATS MARKET, BY PROPULSION,  2020–2023 (USD MILLION)
TABLE 108 ASIA PACIFIC: AUTONOMOUS BOATS MARKET, BY PROPULSION,  2024–2029 (USD MILLION)
TABLE 109 ASIA PACIFIC: AUTONOMOUS BOATS MARKET, BY BOAT SIZE, 2020–2023 (USD MILLION)
TABLE 110 ASIA PACIFIC: AUTONOMOUS BOATS MARKET, BY BOAT SIZE, 2024–2029 (USD MILLION)
TABLE 111 ASIA PACIFIC: AUTONOMOUS BOATS MARKET, BY AUTONOMY,  2020–2023 (USD MILLION)
TABLE 112 ASIA PACIFIC: AUTONOMOUS BOATS MARKET, BY AUTONOMY,  2024–2029 (USD MILLION)
TABLE 113 CHINA: AUTONOMOUS BOATS MARKET, BY TYPE, 2020–2023 (USD MILLION)
TABLE 114 CHINA: AUTONOMOUS BOATS MARKET, BY TYPE, 2024–2029 (USD MILLION)
TABLE 115 CHINA: AUTONOMOUS BOATS MARKET, BY PROPULSION, 2020–2023 (USD MILLION)
TABLE 116 CHINA: AUTONOMOUS BOATS MARKET, BY PROPULSION, 2024–2029 (USD MILLION)
TABLE 117 CHINA: AUTONOMOUS BOATS MARKET, BY AUTONOMY, 2020–2023 (USD MILLION)
TABLE 118 CHINA: AUTONOMOUS BOATS MARKET, BY AUTONOMY, 2024–2029 (USD MILLION)
TABLE 119 INDIA: AUTONOMOUS BOATS MARKET, BY TYPE, 2020–2023 (USD MILLION)
TABLE 120 INDIA: AUTONOMOUS BOATS MARKET, BY TYPE, 2024–2029 (USD MILLION)
TABLE 121 INDIA: AUTONOMOUS BOATS MARKET, BY PROPULSION, 2020–2023 (USD MILLION)
TABLE 122 INDIA: AUTONOMOUS BOATS MARKET, BY PROPULSION, 2024–2029 (USD MILLION)
TABLE 123 INDIA: AUTONOMOUS BOATS MARKET, BY AUTONOMY, 2020–2023 (USD MILLION)
TABLE 124 INDIA: AUTONOMOUS BOATS MARKET, BY AUTONOMY, 2024–2029 (USD MILLION)
TABLE 125 JAPAN: AUTONOMOUS BOATS MARKET, BY TYPE, 2020–2023 (USD MILLION)
TABLE 126 JAPAN: AUTONOMOUS BOATS MARKET, BY TYPE, 2024–2029 (USD MILLION)
TABLE 127 JAPAN: AUTONOMOUS BOATS MARKET, BY PROPULSION, 2020–2023 (USD MILLION)
TABLE 128 JAPAN: AUTONOMOUS BOATS MARKET, BY PROPULSION, 2024–2029 (USD MILLION)
TABLE 129 JAPAN: AUTONOMOUS BOATS MARKET, BY AUTONOMY, 2020–2023 (USD MILLION)
TABLE 130 JAPAN: AUTONOMOUS BOATS MARKET, BY AUTONOMY, 2024–2029 (USD MILLION)
TABLE 131 SOUTH KOREA: AUTONOMOUS BOATS MARKET, BY TYPE, 2020–2023 (USD MILLION)
TABLE 132 SOUTH KOREA: AUTONOMOUS BOATS MARKET, BY TYPE, 2024–2029 (USD MILLION)
TABLE 133 SOUTH KOREA: AUTONOMOUS BOATS MARKET, BY PROPULSION,  2020–2023 (USD MILLION)
TABLE 134 SOUTH KOREA: AUTONOMOUS BOATS MARKET, BY PROPULSION,  2024–2029 (USD MILLION)
TABLE 135 SOUTH KOREA: AUTONOMOUS BOATS MARKET, BY AUTONOMY,  2020–2023 (USD MILLION)
TABLE 136 SOUTH KOREA: AUTONOMOUS BOATS MARKET, BY AUTONOMY,  2024–2029 (USD MILLION)
TABLE 137 REST OF ASIA PACIFIC: AUTONOMOUS BOATS MARKET, BY TYPE,  2020–2023 (USD MILLION)
TABLE 138 REST OF ASIA PACIFIC: AUTONOMOUS BOATS MARKET, BY TYPE,  2024–2029 (USD MILLION)
TABLE 139 REST OF ASIA PACIFIC: AUTONOMOUS BOATS MARKET, BY PROPULSION,  2020–2023 (USD MILLION)
TABLE 140 REST OF ASIA PACIFIC AUTONOMOUS BOATS MARKET, BY PROPULSION,  2024–2029 (USD MILLION)
TABLE 141 REST OF ASIA PACIFIC: AUTONOMOUS BOATS MARKET, BY AUTONOMY,  2020–2023 (USD MILLION)
TABLE 142 REST OF ASIA PACIFIC: AUTONOMOUS BOATS MARKET, BY AUTONOMY,  2024–2029 (USD MILLION)
TABLE 143 MIDDLE EAST: AUTONOMOUS BOATS MARKET, BY COUNTRY, 2020–2023 (USD MILLION)
TABLE 144 MIDDLE EAST: AUTONOMOUS BOATS MARKET, BY COUNTRY, 2024–2029 (USD MILLION)
TABLE 145 MIDDLE EAST: AUTONOMOUS BOATS MARKET, BY TYPE, 2020–2023 (USD MILLION)
TABLE 146 MIDDLE EAST: AUTONOMOUS BOATS MARKET, BY TYPE, 2024–2029 (USD MILLION)
TABLE 147 MIDDLE EAST: AUTONOMOUS BOATS MARKET, BY PROPULSION,  2020–2023 (USD MILLION)
TABLE 148 MIDDLE EAST: AUTONOMOUS BOATS MARKET, BY PROPULSION,  2024–2029 (USD MILLION)
TABLE 149 MIDDLE EAST: AUTONOMOUS BOATS MARKET, BY BOAT SIZE,  2020–2023 (USD MILLION)
TABLE 150 MIDDLE EAST: AUTONOMOUS BOATS MARKET, BY BOAT SIZE,  2024–2029 (USD MILLION)
TABLE 151 MIDDLE EAST: AUTONOMOUS BOATS MARKET, BY AUTONOMY,  2020–2023 (USD MILLION)
TABLE 152 MIDDLE EAST: AUTONOMOUS BOATS MARKET, BY AUTONOMY,  2024–2029 (USD MILLION)
TABLE 153 UAE: AUTONOMOUS BOATS MARKET, BY TYPE, 2020–2023 (USD MILLION)
TABLE 154 UAE: AUTONOMOUS BOATS MARKET, BY TYPE, 2024–2029 (USD MILLION)
TABLE 155 UAE: AUTONOMOUS BOATS MARKET, BY PROPULSION, 2020–2023 (USD MILLION)
TABLE 156 UAE: AUTONOMOUS BOATS MARKET, BY PROPULSION, 2024–2029 (USD MILLION)
TABLE 157 UAE: AUTONOMOUS BOATS MARKET, BY AUTONOMY, 2020–2023 (USD MILLION)
TABLE 158 UAE: AUTONOMOUS BOATS MARKET, BY AUTONOMY, 2024–2029 (USD MILLION)
TABLE 159 SAUDI ARABIA: AUTONOMOUS BOATS MARKET, BY TYPE, 2020–2023 (USD MILLION)
TABLE 160 SAUDI ARABIA: AUTONOMOUS BOATS MARKET, BY TYPE, 2024–2029 (USD MILLION)
TABLE 161 SAUDI ARABIA: AUTONOMOUS BOATS MARKET, BY PROPULSION,  2020–2023 (USD MILLION)
TABLE 162 SAUDI ARABIA: AUTONOMOUS BOATS MARKET, BY PROPULSION,  2024–2029 (USD MILLION)
TABLE 163 SAUDI ARABIA: AUTONOMOUS BOATS MARKET, BY AUTONOMY,  2020–2023 (USD MILLION)
TABLE 164 SAUDI ARABIA: AUTONOMOUS BOATS MARKET, BY AUTONOMY,  2024–2029 (USD MILLION)
TABLE 165 REST OF MIDDLE EAST: AUTONOMOUS BOATS MARKET, BY TYPE,  2020–2023 (USD MILLION)
TABLE 166 REST OF MIDDLE EAST: AUTONOMOUS BOATS MARKET, BY TYPE,  2024–2029 (USD MILLION)
TABLE 167 REST OF MIDDLE EAST: AUTONOMOUS BOATS MARKET, BY PROPULSION,  2020–2023 (USD MILLION)
TABLE 168 REST OF MIDDLE EAST: AUTONOMOUS BOATS MARKET, BY PROPULSION,  2024–2029 (USD MILLION)
TABLE 169 REST OF MIDDLE EAST: AUTONOMOUS BOATS MARKET, BY AUTONOMY,  2020–2023 (USD MILLION)
TABLE 170 REST OF MIDDLE EAST: AUTONOMOUS BOATS MARKET, BY AUTONOMY,  2024–2029 (USD MILLION)
TABLE 171 LATIN AMERICA & AFRICA: AUTONOMOUS BOATS MARKET, BY COUNTRY,  2020–2023 (USD MILLION)
TABLE 172 LATIN AMERICA & AFRICA: AUTONOMOUS BOATS MARKET, BY COUNTRY,  2024–2029 (USD MILLION)
TABLE 173 LATIN AMERICA & AFRICA: AUTONOMOUS BOATS MARKET, BY TYPE,  2020–2023 (USD MILLION)
TABLE 174 LATIN AMERICA & AFRICA: AUTONOMOUS BOATS MARKET, BY TYPE,  2024–2029 (USD MILLION)
TABLE 175 LATIN AMERICA & AFRICA: AUTONOMOUS BOATS MARKET, BY PROPULSION, 2020–2023 (USD MILLION)
TABLE 176 LATIN AMERICA & AFRICA: AUTONOMOUS BOATS MARKET, BY PROPULSION, 2024–2029 (USD MILLION)
TABLE 177 LATIN AMERICA & AFRICA: AUTONOMOUS BOATS MARKET, BY BOAT SIZE,  2020–2023 (USD MILLION)
TABLE 178 LATIN AMERICA & AFRICA: AUTONOMOUS BOATS MARKET, BY BOAT SIZE,  2024–2029 (USD MILLION)
TABLE 179 LATIN AMERICA & AFRICA: AUTONOMOUS BOATS MARKET, BY AUTONOMY,  2020–2023 (USD MILLION)
TABLE 180 LATIN AMERICA & AFRICA: AUTONOMOUS BOATS MARKET, BY AUTONOMY,  2024–2029 (USD MILLION)
TABLE 181 BRAZIL: AUTONOMOUS BOATS MARKET, BY TYPE, 2020–2023 (USD MILLION)
TABLE 182 BRAZIL: AUTONOMOUS BOATS MARKET, BY TYPE, 2024–2029 (USD MILLION)
TABLE 183 BRAZIL: AUTONOMOUS BOATS MARKET, BY PROPULSION, 2020–2023 (USD MILLION)
TABLE 184 BRAZIL: AUTONOMOUS BOATS MARKET, BY PROPULSION, 2024–2029 (USD MILLION)
TABLE 185 BRAZIL: AUTONOMOUS BOATS MARKET, BY AUTONOMY, 2020–2023 (USD MILLION)
TABLE 186 BRAZIL: AUTONOMOUS BOATS MARKET, BY AUTONOMY, 2024–2029 (USD MILLION)
TABLE 187 MEXICO: AUTONOMOUS BOATS MARKET, BY TYPE, 2020–2023 (USD MILLION)
TABLE 188 MEXICO: AUTONOMOUS BOATS MARKET, BY TYPE, 2024–2029 (USD MILLION)
TABLE 189 MEXICO: AUTONOMOUS BOATS MARKET, BY PROPULSION, 2020–2023 (USD MILLION)
TABLE 190 MEXICO: AUTONOMOUS BOATS MARKET, BY PROPULSION, 2024–2029 (USD MILLION)
TABLE 191 MEXICO: AUTONOMOUS BOATS MARKET, BY AUTONOMY, 2020–2023 (USD MILLION)
TABLE 192 MEXICO: AUTONOMOUS BOATS MARKET, BY AUTONOMY, 2024–2029 (USD MILLION)
TABLE 193 AFRICA: AUTONOMOUS BOATS MARKET, BY TYPE, 2020–2023 (USD MILLION)
TABLE 194 AFRICA: AUTONOMOUS BOATS MARKET, BY TYPE, 2024–2029 (USD MILLION)
TABLE 195 AFRICA: AUTONOMOUS BOATS MARKET, BY PROPULSION, 2020–2023 (USD MILLION)
TABLE 196 AFRICA: AUTONOMOUS BOATS MARKET, BY PROPULSION, 2024–2029 (USD MILLION)
TABLE 197 AFRICA: AUTONOMOUS BOATS MARKET, BY AUTONOMY, 2020–2023 (USD MILLION)
TABLE 198 AFRICA: AUTONOMOUS BOATS MARKET, BY AUTONOMY, 2024–2029 (USD MILLION)
TABLE 199 KEY STRATEGIES ADOPTED BY LEADING PLAYERS IN AUTONOMOUS BOATS MARKET, 2023
TABLE 200 AUTONOMOUS BOATS MARKET: DEGREE OF COMPETITION
TABLE 201 AUTONOMOUS BOATS MARKET: COMPANY PROPULSION FOOTPRINT
TABLE 202 AUTONOMOUS BOATS MARKET: COMPANY TYPE FOOTPRINT
TABLE 203 AUTONOMOUS BOATS MARKET: COMPANY AUTONOMY FOOTPRINT
TABLE 204 AUTONOMOUS BOATS MARKET: COMPANY REGION FOOTPRINT
TABLE 205 AUTONOMOUS BOATS MARKET: KEY STARTUPS/SMES
TABLE 206 COMPETITIVE BENCHMARKING OF STARTUPS/SMES
TABLE 207 AUTONOMOUS BOATS MARKET: PRODUCT LAUNCHES, JANUARY 2020–JULY 2024
TABLE 208 AUTONOMOUS BOATS MARKET: DEALS, JANUARY 2020–JULY 2024
TABLE 209 AUTONOMOUS BOATS MARKET: EXPANSIONS, JANUARY 2020–JULY 2024
TABLE 210 AUTONOMOUS BOATS MARKET: OTHER DEVELOPMENTS, JANUARY 2020–JULY 2024
TABLE 211 KONGSBERG MARITIME: COMPANY OVERVIEW
TABLE 212 KONGSBERG MARITIME: PRODUCT/SOLUTIONS/SERVICES OFFERED
TABLE 213 KONGSBERG MARITIME: EXPANSIONS
TABLE 214 ABB: COMPANY OVERVIEW
TABLE 215 ABB: PRODUCTS/SOLUTIONS/SERVICES OFFERED
TABLE 216 ROLLS-ROYCE PLC: COMPANY OVERVIEW
TABLE 217 ROLLS-ROYCE PLC: PRODUCTS/SOLUTIONS/SERVICES OFFERED
TABLE 218 ROLLS-ROYCE PLC: DEALS
TABLE 219 HYUNDAI HEAVY INDUSTRIES: COMPANY OVERVIEW
TABLE 220 HYUNDAI HEAVY INDUSTRIES: PRODUCTS/SOLUTIONS/SERVICES OFFERED
TABLE 221 HYUNDAI HEAVY INDUSTRIES: DEALS
TABLE 222 HYUNDAI HEAVY INDUSTRIES: OTHER DEVELOPMENTS
TABLE 223 FUGRO: COMPANY OVERVIEW
TABLE 224 FUGRO: PRODUCTS/SOLUTIONS/SERVICES OFFERED
TABLE 225 FUGRO: PRODUCTS LAUNCHES
TABLE 226 FUGRO: DEALS
TABLE 227 WARTSILA: COMPANY OVERVIEW
TABLE 228 WARTSILA: PRODUCTS/SOLUTIONS/SERVICES OFFERED
TABLE 229 SIEMENS: COMPANY OVERVIEW
TABLE 230 SIEMENS: PRODUCTS/SOLUTIONS/SERVICES OFFERED
TABLE 231 L3HARRIS ASV: COMPANY OVERVIEW
TABLE 232 L3HARRIS ASV: PRODUCTS/SOLUTIONS/SERVICES OFFERED
TABLE 233 L3HARRIS ASV: EXPANSIONS
TABLE 234 SEA MACHINE ROBOTICS: COMPANY OVERVIEW
TABLE 235 SEA MACHINE ROBOTICS: PRODUCTS/SOLUTIONS/SERVICES OFFERED
TABLE 236 SUBSEA CRAFT LTD: COMPANY OVERVIEW
TABLE 237 SUBSEA CRAFT LTD: PRODUCTS/SOLUTIONS/SERVICES OFFERED
TABLE 238 METAL SHARK: COMPANY OVERVIEW
TABLE 239 METAL SHARK: PRODUCTS/SOLUTIONS/SERVICES OFFERED
TABLE 240 METAL SHARK: OTHER DEVELOPMENTS
TABLE 241 BAE SYSTEMS: COMPANY OVERVIEW
TABLE 242 BAE SYSTEMS: PRODUCTS/SOLUTIONS/SERVICES OFFERED
TABLE 243 NAVIER: COMPANY OVERVIEW
TABLE 244 NAVIER: PRODUCTS/SOLUTIONS/SERVICES OFFERED
TABLE 245 CALLBOATS: COMPANY OVERVIEW
TABLE 246 CALLBOATS: PRODUCTS/SOLUTIONS/SERVICES OFFERED
TABLE 247 ROBOAT: COMPANY OVERVIEW
TABLE 248 ROBOAT: PRODUCTS/SOLUTIONS/SERVICES OFFERED
TABLE 249 BUFFALO AUTOMATION: COMPANY OVERVIEW
TABLE 250 RAYMARINE: COMPANY OVERVIEW
TABLE 251 NAVICO GROUP: COMPANY OVERVIEW
TABLE 252 FURUNO ELECTRIC CO., LTD.: COMPANY OVERVIEW
TABLE 253 GARMIN LTD: COMPANY OVERVIEW
TABLE 254 ANSCHÜTZ GMBH: COMPANY OVERVIEW
TABLE 255 COMNAV: COMPANY OVERVIEW
TABLE 256 DOCKMATE: COMPANY OVERVIEW
TABLE 257 SEEBYTE: COMPANY OVERVIEW
TABLE 258 PRAXIS AUTOMATION TECHNOLOGY B.V.: COMPANY OVERVIEW
 
 
LIST OF FIGURES (70 FIGURES)
 
FIGURE 1 AUTONOMOUS BOATS MARKET SEGMENTATION
FIGURE 2 REPORT PROCESS FLOW
FIGURE 3 RESEARCH DESIGN
FIGURE 4 BREAKDOWN OF PRIMARY INTERVIEWS
FIGURE 5 MARKET SIZE ESTIMATION METHODOLOGY: BOTTOM-UP APPROACH  (SUPPLY SIDE)
FIGURE 6 TOP-DOWN APPROACH
FIGURE 7 DATA TRIANGULATION
FIGURE 8 FUEL-POWERED BOATS SEGMENT TO LEAD MARKET DURING FORECAST PERIOD
FIGURE 9 PARTIALLY AUTONOMOUS BOATS TO REGISTER HIGHEST CAGR DURING FORECAST PERIOD
FIGURE 10 20–40 FEET SEGMENT TO HOLD LARGEST MARKET SHARE DURING FORECAST PERIOD
FIGURE 11 COMMERCIAL BOATS TO BE DOMINANT SEGMENT DURING FORECAST PERIOD
FIGURE 12 EUROPE TO ACCOUNT FOR LARGEST MARKET SHARE IN 2024
FIGURE 13 INCREASING TECHNOLOGICAL ADVANCEMENTS TO DRIVE MARKET
FIGURE 14 FUEL-POWERED SEGMENT TO RECORD LARGEST MARKET SHARE IN 2024
FIGURE 15 PARTIALLY AUTONOMOUS BOATS TO DOMINATE DURING FORECAST PERIOD
FIGURE 16 20–40 FEET SEGMENT TO HOLD DOMINANT MARKET SHARE DURING FORECAST PERIOD
FIGURE 17 COMMERCIAL BOATS SEGMENT TO COMMAND MARKET DURING FORECAST PERIOD
FIGURE 18 SOUTH KOREA TO BE FASTEST-GROWING MARKET DURING FORECAST PERIOD
FIGURE 19 AUTONOMOUS BOATS MARKET DYNAMICS
FIGURE 20 POTENTIAL CYBERATTACK ROUTES FOR MARINE VESSELS
FIGURE 21 TRENDS AND DISRUPTIONS IMPACTING CUSTOMER BUSINESS
FIGURE 22 VALUE CHAIN ANALYSIS
FIGURE 23 COUNTRY-WISE IMPORTS, 2019–2023 (USD THOUSAND)
FIGURE 24 COUNTRY-WISE EXPORTS, 2019–2023 (USD THOUSAND)
FIGURE 25 INFLUENCE OF STAKEHOLDERS ON BUYING PROCESS, BY TYPE
FIGURE 26 KEY BUYING CRITERIA, BY TYPE
FIGURE 27 AVERAGE SELLING PRICE, BY AUTONOMY,
FIGURE 28 INVESTMENT AND FUNDING SCENARIO, 2020−2024
FIGURE 29 BUSINESS MODELS IN AUTONOMOUS BOATS MARKET
FIGURE 30 TOTAL COST OF OWNERSHIP IN AUTONOMOUS BOATS MARKET
FIGURE 31 TOTAL COST OF OWNERSHIP COMPARISON OF AUTONOMOUS BOATS, BY TYPE
FIGURE 32 BILL OF MATERIALS FOR RECREATIONAL BOATS
FIGURE 33 BILL OF MATERIALS FOR COMMERCIAL BOATS
FIGURE 34 BILL OF MATERIALS FOR MILITARY & LAW ENFORCEMENT BOATS
FIGURE 35 TECHNOLOGY ROADMAP
FIGURE 36 EVOLUTION OF AUTONOMOUS BOATS
FIGURE 37 EMERGING TECHNOLOGY TRENDS
FIGURE 38 USE OF AI IN MARINE INDUSTRY
FIGURE 39 ADOPTION OF AI IN MARINE INDUSTRY BY TOP COUNTRIES
FIGURE 40 IMPACT OF AI ON DIFFERENT BOAT TYPES
FIGURE 41 IMPACT OF AI ON AUTONOMOUS BOATS MARKET
FIGURE 42 SUPPLY CHAIN ANALYSIS
FIGURE 43 PATENT ANALYSIS, 2013–2023
FIGURE 44 AUTONOMOUS BOATS MARKET, BY AUTONOMY, 2024–2029 (USD MILLION)
FIGURE 45 AUTONOMOUS BOATS MARKET, BY PROPULSION, 2024–2029 (USD MILLION)
FIGURE 46 AUTONOMOUS BOATS MARKET, BY TYPE, 2024–2029 (USD MILLION)
FIGURE 47 AUTONOMOUS BOATS MARKET, BY BOAT SIZE, 2024–2029 (USD MILLION)
FIGURE 48 AUTONOMOUS BOATS MARKET, BY REGION
FIGURE 49 NORTH AMERICA: AUTONOMOUS BOATS MARKET SNAPSHOT
FIGURE 50 EUROPE: AUTONOMOUS BOATS MARKET SNAPSHOT
FIGURE 51 ASIA PACIFIC: AUTONOMOUS BOATS MARKET SNAPSHOT
FIGURE 52 MIDDLE EAST: AUTONOMOUS BOATS MARKET SNAPSHOT
FIGURE 53 LATIN AMERICA: AUTONOMOUS BOATS MARKET SNAPSHOT
FIGURE 54 AUTONOMOUS BOATS MARKET SHARE ANALYSIS OF TOP FIVE PLAYERS, 2023
FIGURE 55 REVENUE ANALYSIS OF TOP FIVE PLAYERS, 2021–2023
FIGURE 56 COMPANY EVALUATION MATRIX (KEY PLAYERS), 2023
FIGURE 57 AUTONOMOUS BOATS MARKET: COMPANY FOOTPRINT
FIGURE 58 FINANCIAL METRICS OF KEY PLAYERS, 2023
FIGURE 59 COMPANY VALUATION OF KEY PLAYERS, 2023
FIGURE 60 AUTONOMOUS BOATS MARKET: COMPANY EVALUATION MATRIX (STARTUPS/SMES), 2023
FIGURE 61 BRAND/PRODUCT COMPARISON
FIGURE 62 KONGSBERG MARITIME: COMPANY SNAPSHOT
FIGURE 63 ABB: COMPANY SNAPSHOT
FIGURE 64 ROLLS-ROYCE PLC: COMPANY SNAPSHOT
FIGURE 65 HYUNDAI HEAVY INDUSTRIES: COMPANY SNAPSHOT
FIGURE 66 FUGRO: COMPANY SNAPSHOT
FIGURE 67 WARTSILA: COMPANY SNAPSHOT
FIGURE 68 SIEMENS: COMPANY SNAPSHOT
FIGURE 69 L3HARRIS TECHNOLOGIES INC. (PARENT COMPANY OF L3HARRIS ASV): COMPANY SNAPSHOT
FIGURE 70 BAE SYSTEMS: COMPANY SNAPSHOT
 

The research study conducted on the autonomous boats market involved the extensive use of secondary sources, directories, and databases, such as D&B Hoovers, Bloomberg, and Factiva, to identify and collect relevant information. Primary sources included industry experts from the market as well as suppliers, manufacturers, solution providers, technology developers, alliances, and organizations related to all segments of the value chain of this industry. In-depth interviews of various primary respondents, including key industry participants, subject matter experts (SMEs), industry consultants, and C-level executives, were conducted to obtain and verify critical qualitative and quantitative information pertaining to the market as well as assess the growth prospects of the market. A deductive approach, also known as the bottom-up approach combined with the top-down approach, was used to forecast the market size of different market segments.

Secondary Research

In the secondary research process, various secondary sources were referred to identify and collect information for this study on the autonomous boats market. Secondary sources included annual reports, press releases, and investor presentations of companies; white papers and certified publications; articles from recognized authors; manufacturers' associations; directories; and databases. Secondary research was mainly used to obtain key information about the supply chain of the marine industry, the monetary chain of the market, the total pool of key players, market classification and segmentation according to the industry trends to the bottom-most level, regional markets, and key developments from both market and technology-oriented perspectives.

Primary Research

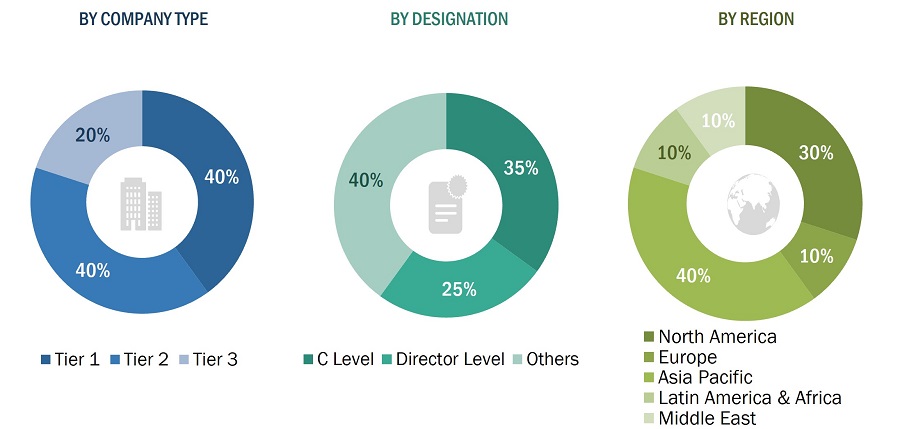
Extensive primary research was conducted to obtain qualitative and quantitative information for this report on the autonomous boats market. Several primary interviews were conducted with market experts from both the demand and supply sides across major regions, namely, North America, Europe, Asia Pacific, the Middle East, Latin America & Africa. Primary sources from the supply side included industry experts such as business development managers, sales heads, technology and innovation directors, and related key executives from various key companies and organizations operating in the autonomous boats market.
Autonomous Boats Market
 Size, and Share

To know about the assumptions considered for the study, download the pdf brochure

Market Size Estimation

The top-down and bottom-up approaches were used to estimate and validate the size of the autonomous boats market. The research methodology used to estimate the market size includes the following details. Key players in the market were identified through secondary research, and their market share was determined through primary and secondary research. This included a study of the annual and financial reports of top market players and extensive interviews with industry stakeholders such as CEOs, technical advisors, military experts, marine vessel maintenance professionals, and SMEs of leading companies operating in the autonomous boats market.

All percentage shares, splits, and breakdowns were determined using secondary sources and verified through primary sources. All possible parameters that affect the markets covered in this research study were accounted for, viewed in extensive detail, verified through primary research, and analyzed to obtain the final quantitative and qualitative data on the autonomous boats market. This data was consolidated, enhanced with detailed inputs, analyzed by MarketsandMarkets, and presented in this report.

Bottom-Up Approach

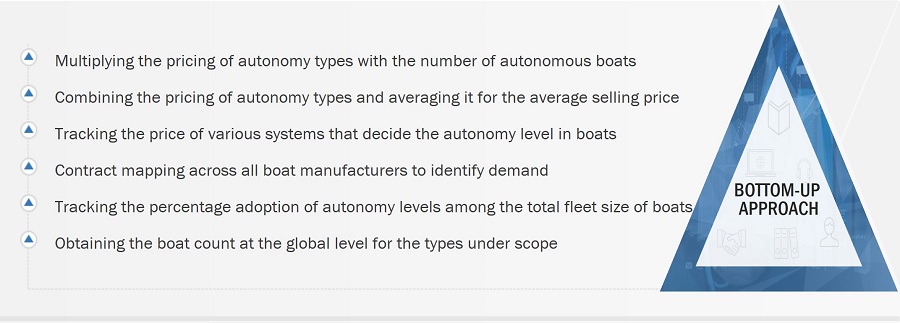
The bottom-up approach was employed to determine the overall size of the autonomous boats market. Calculations for the market relied on global autonomous boats adoption were based on regional vessel sizes for each country. The bottom-up approach was also implemented to extract secondary research data to validate different market segments' revenues. With the data triangulation procedure and data validation through primaries, the overall sizes of the autonomous boats market from the revenues of key players and their shares in the market and each market segment were determined and confirmed in this study.
Autonomous Boats Market
 Size, and Bottom-Up Approach

Top-Down Approach

In the top-down approach, the overall market size was used to estimate the size of individual markets (mentioned in market segmentation) through percentage splits based on secondary and primary research.

For calculating the sizes of specific market segments, the most appropriate and immediate parent market size was used to implement the top-down approach. The bottom-up approach was also implemented to validate the market segment revenues obtained.

Market shares were then estimated for each company to verify the revenue shares used earlier in the bottom-up approach. With the data triangulation procedure and validation of data through primaries, the sizes of the parent market and each individual market were determined and confirmed in this study. The data triangulation procedure used for this study is explained in the market breakdown and triangulation section.

Autonomous Boats Market
 Size, and Top-Down Approach

Data triangulation

After arriving at the overall market size through the market size estimation process explained above, the total market was split into several segments and subsegments. To complete the overall market engineering process and arrive at the exact statistics for market segments and subsegments, market breakdown & data triangulation procedures explained below were implemented, wherever applicable. Data was triangulated by studying various factors and trends from both the demand and supply sides. Along with this, the market size was validated using both top-down and bottom-up approaches.

Market Definition

Autonomous boats refer to smaller watercraft that involves the integration of various systems and subsystems, enabling effective decision-making based on sensor fusion technology and artificial intelligence (AI) for processing data, hence reducing, or eliminating the need for human intervention. The level of autonomy achieved by integrating autonomy-related systems is categorized into partially autonomous, remotely operated, and fully autonomous.

Stakeholders

Various stakeholders of the market are listed below:

  • Autonomous Boat Manufacturers
  • Marien Autonomous System Manufacturers
  • Subcomponent Manufacturers
  • Raw Material Suppliers
  • Technology Support Providers
  • System Integrators
  • Government Agencies
  • Commercial Vessel Operators
  • Research Organizations

Report Objectives

  • To define, describe, segment, and forecast the size of the autonomous boats market based on propulsion, autonomy, boat size, type, and region
  • To analyze the degree of competition in the market by mapping the recent developments, products, and services of key market players
  • To understand the structure of the autonomous boats market by identifying its various segments and subsegments
  • To identify and analyze key drivers, restraints, opportunities, and challenges that influence market growth
  • To forecast the size of market segments across North America, Europe, Asia Pacific, Middle East, Latin America & Africa, along with major countries in each region
  • To analyze micromarkets1 with respect to individual technological trends and their contribution to the total market
  • To profile key market players and comprehensively analyze their market share and core competencies2
  • To provide a detailed competitive landscape of the market, along with an analysis of business and strategies, such as, partnerships, and agreements  , in the autonomous boats market

1. Micromarkets are further segments and subsegments of the autonomous boats market  market.

2. Core competencies of companies were captured in terms of their key developments and strategies adopted to sustain their position in the market

Available customizations

Along with the market data, MarketsandMarkets offers customizations as per the specific needs of companies. The following customization options are available for the report:

Product Analysis

  • Product matrix, which gives a detailed comparison of the product portfolio of each company.

Regional Analysis

  • Further breakdown of the market segments at the country level

Company Information

  • Detailed analysis and profiling of additional market players (up to 5)
Custom Market Research Services

We will customize the research for you, in case the report listed above does not meet with your exact requirements. Our custom research will comprehensively cover the business information you require to help you arrive at strategic and profitable business decisions.

Request Customization
Report Code
AS 9152
Published ON
Sep, 2024
Choose License Type
BUY NOW
  • SHARE
X
Request Customization
Speak to Analyst
Speak to Analyst
OR FACE-TO-FACE MEETING
PERSONALIZE THIS RESEARCH
  • Triangulate with your Own Data
  • Get Data as per your Format and Definition
  • Gain a Deeper Dive on a Specific Application, Geography, Customer or Competitor
  • Any level of Personalization
REQUEST A FREE CUSTOMIZATION
LET US HELP YOU!
  • What are the Known and Unknown Adjacencies Impacting the Autonomous Boats Market
  • What will your New Revenue Sources be?
  • Who will be your Top Customer; what will make them switch?
  • Defend your Market Share or Win Competitors
  • Get a Scorecard for Target Partners
CUSTOMIZED WORKSHOP REQUEST
  • Call Us
  • +1-888-600-6441 (Corporate office hours)
  • +1-888-600-6441 (US/Can toll free)
  • +44-800-368-9399 (UK office hours)
CONNECT WITH US
ABOUT TRUST ONLINE
©2024 MarketsandMarkets Research Private Ltd. All rights reserved
DMCA.com Protection Status Website Feedback