Automotive Ceramics Market

Automotive Ceramics Market by Material (Alumina Oxide, Titanate Oxide, Zirconia Oxide), Vehicle Type (Passenger Vehicle, Commercial Vehicle), Application (Engine Parts, Exhaust Systems, Automotive Electronics), and Region - Global Forecast to 2028

Report Code: CH 5998 Mar, 2024, by marketsandmarkets.com

The global automotive ceramics market is projected to reach USD 3.2 billion by 2028, at a CAGR of 5.7% from USD 2.4 billion in 2023. The demand for automotive ceramics is increasing as the sector focuses on lightweight and resilient materials to enhance fuel efficiency, manage emissions, and elevate vehicle performance. The growing adoption of electric vehicles and strict environmental regulations magnify the crucial role ceramics play in essential components like exhaust systems, engine parts, and automotive electronics. This propels the overall growth of the market, underscoring the importance of ceramics in addressing the evolving needs of the industry.

Attractive Opportunities in the Automotive Ceramics Market

Automotive  Ceramics Market

To know about the assumptions considered for the study, Request for Free Sample Report

Note: e-estimated p-projected.

Source: Expert Interviews, Secondary Sources, and MarketsandMarkets Analysis

Automotive  Ceramics Market

Automotive Ceramics Market Dynamics

Driver: Increased use as an alternative to metals and plastics

Automotive ceramics have superior wear resistance, high-temperature strength, and chemical stability in comparison to metals. Therefore, these ceramics have replaced metals in many applications such as pump components (sealing), brake discs, catalyst support, particulate filter, and other automotive structural applications. They are also being used in niche applications in automobiles such as turbochargers, glow plugs, and combustion chambers instead of metals. Therefore, the increased usage of automotive ceramics over metals in the automotive industry is driving its market, globally.

Automotive ceramics have also replaced plastics in many applications; for example, miniature components used in automotive electronic circuits. Hence, automotive ceramics are expected to replace metals and plastics in many automotive applications in the near future.

Restraint: Higher cost than the metals and alloys

The cost of automotive ceramics is higher than metals and plastics. The prices of automotive ceramics are largely controlled by the costs of R&D; ceramic raw materials, especially, carbides and nitrides, ceramic fibers; specific material preparation; and other factors. High cost is a major barrier to the growth of the automotive ceramics market. Another factor contributing to the higher prices is the generation of the ceramic matrix. Matrix production needs expensive batch processes at high temperatures in a controlled atmosphere in comparison to monolithic ceramics and other conventional materials. The automotive industry uses ceramic matrix composites for a few applications, and higher costs are incurred where silicon carbide is used as a raw material in the production of the matrix. Automotive ceramic products have higher production and raw material costs in comparison to other metals and alloys used in automotive applications. This high cost is a major restraint for the growth of the automotive ceramics market.

Opportunities:Development of low cost production technologies

There is an increased demand for lightweight parts and engine components in the automotive industry. Companies are trying to build fuel-efficient vehicles, particularly, in the US and European countries. Therefore, the use of ceramic components is expected to increase in the production of new automotive engines. This has led automobile manufacturers to focus on ceramics as a substitute for conventional alloys and metals. Manufacturers are developing lightweight ceramics, which will increase the efficiency as well as the safety & security of vehicles. New technologies are being developed to manufacture automotive ceramics that have a broad range of exceptional properties and increased capability of providing structural efficiency at lower weights in comparison to the current technologies. The new technologies are further expected to reduce the cycle time and manufacturing costs. Such advancements are expected to provide a competitive edge and high growth opportunities to the automotive ceramics manufacturers.

Challenges: Issues pertaining to recyclability and reparability

It is very difficult to find internal cracks or wear & tear in components made of ceramic matrix. Moreover, lack of skilled labor and proper techniques of repair pose issues in repairing. However, increasing awareness regarding automotive ceramics repairing techniques and the increasing skilled labor will lower the impact in the near future. Although automotive ceramics are durable, these components cannot be recycled for use in the same applications. Owing to the durability and various mechanical and optical properties of automotive ceramics, different compositions of ceramic material face the issues of recyclability and reparability. This is one of the major challenges for the market players.

Automotive Ceramics Market: Ecosystem

Prominent companies in this market include well-established, financially stable manufacturers of automotive ceramicss. These companies have been operating in the market for several years and possess a diversified product portfolio and strong global sales and marketing networks. Prominent companies in this market include Kyocera Corpoatyion (Japan), Ceramtec GmbH (Germany), Niterra (Japan), Coorstek Inc (US), Morgan Advanced Materials (UK).

Automotive  Ceramics Market Ecosystem

Based on material, zirconia oxide is projected to account for the second largest share of the automotive ceramics market.

Zirconia oxide secures the second-largest share in the material segment of the automotive ceramics market due to its exceptional properties that cater to the demanding requirements of the automotive industry. Renowned for its high mechanical strength, thermal resistance, and low thermal conductivity, zirconia oxide is a preferred material for critical applications in automotive components. Its remarkable resistance to corrosion and wear, combined with the ability to withstand extreme temperatures, makes it invaluable for exhaust systems, sensors, spark plugs, and other components. Zirconia oxide's prominence is further amplified by the growing adoption of electric vehicles, where it finds extensive use in battery systems. As the automotive industry prioritizes lightweight and durable materials to enhance efficiency and comply with stringent regulations, zirconia oxide emerges as a vital contributor, securing its significant market share and positioning itself as a key driver of innovation and advancement in automotive ceramics.

Based on vehicle type, commercial vehicle type is projected to account for the second largest share of the automotive ceramics market.

Commercial vehicles claim the second-largest share in the vehicle type segment of the automotive ceramics Market due to specific operational demands and industry trends. The durability and performance requirements of commercial vehicles necessitate advanced materials like ceramics in crucial components such as engine parts, exhaust systems, and braking systems. As commercial vehicles often undergo rigorous and continuous usage, the industry places a premium on materials that can withstand extreme conditions, reduce wear and tear, and enhance overall efficiency. Moreover, the increasing focus on emission control and fuel efficiency in the commercial transportation sector amplifies the demand for ceramics in exhaust systems. The sector's adoption of advanced braking systems, where ceramics play a pivotal role, further contributes to the significant market share. As the commercial vehicle segment continues to evolve with technological advancements, ceramics remain integral to meeting the stringent demands of durability and performance in this segment, solidifying its second-largest position in the market.

Based on application, exhaust systems application is projected to account for the second largest share of the automotive ceramics market.

Exhaust systems secure the second-largest share in the application segment of the automotive ceramics Market due to their critical role in addressing stringent emission regulations and optimizing engine performance. Automotive ceramics, particularly zirconia oxide, are extensively utilized in catalytic converters and diesel particulate filters within exhaust systems. These ceramics offer high thermal stability, corrosion resistance, and durability, crucial for withstanding the harsh operating conditions of exhaust gases. With global emphasis on reducing emissions and enhancing fuel efficiency, exhaust systems play a pivotal role in mitigating environmental impact. The growth of hybrid and electric vehicles further propels the demand for ceramics in exhaust systems, as they find application in components like thermal management systems. As the automotive industry continually evolves to meet environmental standards, exhaust systems with advanced ceramics continue to hold a significant market share, supporting the overall trajectory of the automotive ceramics market.

Asia Pacific is expected to be the fastest-growing market during the forecast period.

Asia Pacific region emerges as the fastest-growing market in the global Automotive Ceramics Market due to several pivotal factors. Renowned for its major automotive manufacturing hubs in nations like China, Japan, and South Korea, the region is swiftly becoming a dominant force in the automotive industry. The surge in consumer demand for vehicles, coupled with rising disposable incomes and urbanization, is propelling rapid growth in the automotive sector. Furthermore, the region's proactive stance on adopting advanced materials such as ceramics, driven by stringent emission regulations and the global push for sustainable transportation, fuels the market's accelerated expansion. The Asia Pacific's commitment to technological innovation, continuous research and development efforts, and a forward-thinking approach to electric vehicle adoption further contribute to its status as the fastest-growing market for automotive ceramics. Positioned at the forefront of automotive production and innovation, the region is rapidly solidifying its leadership in the global automotive ceramics market.

Automotive  Ceramics Market by Region

To know about the assumptions considered for the study, download the pdf brochure

Key Market Players

The automotive ceramics market is dominated by a few major players that have a wide regional presence. The key players in the automotive ceramics market are as Kyocera Corporation (Japan), Ceramtec GmbH (Germany), Niterra (Japan), Coorstek Inc (US), Morgan Advanced Materials (UK), Saint-Gobain Ceramic. (US), Elan Technologies (US), 3M (US), Ibiden Co., Ltd. (Japan), and Corning Incorporated. (US). In the last few years, the companies have adopted growth strategies such as Product launches, Investments, Acquisitions, and expansions to capture a larger share of the automotive ceramics market.

Get online access to the report on the World's First Market Intelligence Cloud

  • Easy to Download Historical Data & Forecast Numbers
  • Company Analysis Dashboard for high growth potential opportunities
  • Research Analyst Access for customization & queries
  • Competitor Analysis with Interactive dashboard
  • Latest News, Updates & Trend analysis
Request Sample

Scope of the Report

Report Metric

Details

Years considered for the study

2020-2028

Base Year

2022

Forecast period

2023–2028

Units considered

Value (USD Million), Volume (Million Square Meter)

Segments

Material, Vehicle Type, Application, and Region

Regions

Asia Pacific, North America, Europe, Middle East & Africa, and South America

Companies

Kyocera Corporation (Japan), Ceramtec GmbH (Germany), Niterra (Japan), Coorstek Inc (US), Morgan Advanced Materials (UK), Saint-Gobain Ceramic. (US), Elan Technologies (US), 3M (US), Ibiden Co., Ltd. (Japan), and Corning Incorporated. (US)

This report categorizes the global automotive ceramics market based on material, vehicle type, application, and region.

On the basis of material, the automotive ceramics market has been segmented as follows:
  • Alumina Oxide
  • Titanate Oxide
  • Zirconia Oxide
  • Others
On the basis of vehicle type, the automotive ceramics market has been segmented as follows:
  • Passenger Vehicle
  • Commercial Vehicle
On the basis of application, the automotive ceramics market has been segmented as follows:
  • Engine Parts
  • Exhaust Systems
  • Automotive Electronics
  • Braking Systems
  • Others
On the basis of region, the automotive ceramics market has been segmented as follows:
  • Asia Pacific
  • Europe
  • North America
  • Middle East & Africa
  • South America

Recent Developments

  • In July 2023, Niterra has acquired the Spark Plug business and the Exhaust Gas Oxygen Sensor business from DENSO CORPORATION. This acquisition has helped the company to strengthen its product portfolio in the automotive application.
  • In April 2023, KYOCERA Corporation has invested in a new smart factory at the Minami Isahaya Industrial Park in Isahaya City, Japan. This has helped company production to meet the rising demand for electronics industry and to produce fine ceramic components used in semiconductor-related applications.
  • In March 2023, Ceramtec GmbH launches a new product Rubalit ZTA, which is high-performance substrate, provides exceptional flexural strength, effective thermal conductivity, outstanding electrical insulation, and top-tier dielectric strength.
  • In July 2020, Coorstek opened a new R&D center in Uden, the Netherlands. This new European R&D center is closely connected with CoorsTek’s R&D teams in the US and Japan and is dedicated to developing technical ceramics capabilities to support CoorsTek’s customers around the world.
  • In October 2018, Morgan Advanced Materials launched the Cutting-Edge Carbon Science Centre of Excellence with Penn State University. The Centre of Excellence is utilized by Morgan’s wider businesses and, to date, has also become the home of research projects for the company’s thermal ceramics, technical ceramics, and braze alloys businesses.

Frequently Asked Questions (FAQ):

To speak to our analyst for a discussion on the above findings, click Speak to Analyst

TABLE OF CONTENTS
 
1 INTRODUCTION (Page No. - 30)
    1.1 STUDY OBJECTIVES 
    1.2 MARKET DEFINITION 
    1.3 STUDY SCOPE 
           1.3.1 MARKETS COVERED
                    FIGURE 1 AUTOMOTIVE CERAMICS MARKET SEGMENTATION
           1.3.2 REGIONS COVERED
           1.3.3 YEARS CONSIDERED
    1.4 CURRENCY CONSIDERED 
    1.5 UNITS CONSIDERED 
    1.6 STAKEHOLDERS 
    1.7 INCLUSIONS & EXCLUSIONS 
          TABLE 1 AUTOMOTIVE CERAMICS MARKET: INCLUSIONS & EXCLUSIONS
    1.8 SUMMARY OF CHANGES 
 
2 RESEARCH METHODOLOGY (Page No. - 34)
    2.1 RESEARCH DATA 
          FIGURE 2 AUTOMOTIVE CERAMICS MARKET: RESEARCH DESIGN
           2.1.1 SECONDARY DATA
                    2.1.1.1 Key data from secondary sources
           2.1.2 PRIMARY DATA
                    2.1.2.1 Key data from primary sources
                    2.1.2.2 Primary interviews – Demand and Supply-side
                    2.1.2.3 Key industry insights
                    2.1.2.4 Breakdown of primary interviews
    2.2 MARKET SIZE ESTIMATION 
          FIGURE 3 MARKET SIZE ESTIMATION
           2.2.1 BOTTOM-UP APPROACH
                    2.2.1.1 Approach for arriving at market size using bottom-up analysis
                                FIGURE 4 BOTTOM-UP APPROACH
           2.2.2 TOP-DOWN APPROACH
                    2.2.2.1 Approach for arriving at market size using top-down analysis
                                FIGURE 5 TOP-DOWN APPROACH
    2.3 DATA TRIANGULATION 
          FIGURE 6 AUTOMOTIVE CERAMICS MARKET: DATA TRIANGULATION
    2.4 IMPACT OF RECESSION 
    2.5 FACTOR ANALYSIS 
    2.6 FORECAST ESTIMATION 
          FIGURE 7 DEMAND-SIDE FORECAST PROJECTIONS
    2.7 RESEARCH ASSUMPTIONS 
    2.8 LIMITATIONS 
 
3 EXECUTIVE SUMMARY (Page No. - 45)
    FIGURE 8 ALUMINA OXIDE CERAMICS ACCOUNT FOR LARGEST SHARE OF OVERALL AUTOMOTIVE CERAMICS MARKET
    FIGURE 9 AUTOMOTIVE ELECTRONICS TO BE FASTEST-GROWING APPLICATION OF AUTOMOTIVE CERAMICS
    FIGURE 10 ASIA PACIFIC DOMINATED AUTOMOTIVE CERAMICS MARKET IN 2023
 
4 PREMIUM INSIGHTS (Page No. - 48)
    4.1 ATTRACTIVE OPPORTUNITIES FOR PLAYERS IN AUTOMOTIVE CERAMICS MARKET 
          FIGURE 11 AUTOMOTIVE CERAMICS MARKET TO GROW SIGNIFICANTLY DURING FORECAST PERIOD
    4.2 AUTOMOTIVE CERAMICS MARKET, BY COUNTRY 
          FIGURE 12 CHINA TO BE FASTEST-GROWING AUTOMOTIVE CERAMICS MARKET DURING FORECAST PERIOD
    4.3 AUTOMOTIVE CERAMICS MARKET, BY MATERIAL 
          FIGURE 13 ALUMINA OXIDE CERAMICS TO BE LARGEST SEGMENT OF AUTOMOTIVE CERAMICS MARKET
    4.4 AUTOMOTIVE CERAMICS MARKET, BY VEHICLE TYPE 
          FIGURE 14 PASSENGER VEHICLE SEGMENT TO ACCOUNT FOR LARGER SHARE IN 2028
    4.5 AUTOMOTIVE CERAMICS MARKET, BY APPLICATION 
          FIGURE 15 AUTOMOTIVE ENGINE PARTS SEGMENT TO ACCOUNT FOR LARGEST  SHARE IN 2028
 
5 MARKET OVERVIEW (Page No. - 51)
    5.1 INTRODUCTION 
    5.2 MARKET DYNAMICS 
          FIGURE 16 DRIVERS, RESTRAINTS, OPPORTUNITIES, AND CHALLENGES IN AUTOMOTIVE CERAMICS MARKET
           5.2.1 DRIVERS
                    5.2.1.1 Superior properties of automotive ceramics
                    5.2.1.2 Increased use as alternative to metals and plastics
                    5.2.1.3 Stringent gas emission regulations worldwide
                    5.2.1.4 Growing demand for electric vehicles
           5.2.2 RESTRAINTS
                    5.2.2.1 Higher cost than metals and alloys
                    5.2.2.2 Customization required for specific applications
                    5.2.2.3 Brittleness and fragility in ceramics
           5.2.3 OPPORTUNITIES
                    5.2.3.1 Development of low-cost production technologies
                    5.2.3.2 Increasing demand from automotive electronics applications and battery-powered vehicles
                    5.2.3.3 Automotive ceramics in advanced safety systems
           5.2.4 CHALLENGES
                    5.2.4.1 Issues pertaining to recyclability and reparability
                    5.2.4.2 High capital investment for design and development
    5.3 VALUE CHAIN ANALYSIS 
          FIGURE 17 OVERVIEW OF VALUE CHAIN OF AUTOMOTIVE CERAMICS MARKET
           5.3.1 RAW MATERIAL SUPPLIERS
           5.3.2 MANUFACTURERS/FORMULATORS
           5.3.3 SUPPLIERS/DISTRIBUTORS
           5.3.4 COMPONENT MANUFACTURERS/OEMS
           5.3.5 END-USE INDUSTRIES
    5.4 PORTER’S FIVE FORCES ANALYSIS 
          FIGURE 18 AUTOMOTIVE CERAMICS MARKET: PORTER’S FIVE FORCES ANALYSIS
           5.4.1 BARGAINING POWER OF SUPPLIERS
           5.4.2 THREAT OF NEW ENTRANTS
           5.4.3 THREAT OF SUBSTITUTES
           5.4.4 BARGAINING POWER OF BUYERS
           5.4.5 INTENSITY OF COMPETITIVE RIVALRY
                    TABLE 2 AUTOMOTIVE CERAMICS MARKET: PORTER’S FIVE FORCES ANALYSIS
    5.5 PRICING ANALYSIS 
           5.5.1 AVERAGE SELLING PRICE TRENDS, BY REGION
                    FIGURE 19 AVERAGE SELLING PRICE TRENDS, BY REGION (USD/KG)
           5.5.2 AVERAGE SELLING PRICE TRENDS, BY MATERIAL
                    FIGURE 20 AVERAGE SELLING PRICE TREND, BY MATERIAL (USD/KG)
           5.5.3 AVERAGE SELLING PRICE TRENDS OF KEY PLAYERS BY APPLICATION
                    FIGURE 21 AVERAGE SELLING PRICE TREND OF KEY PLAYERS BY APPLICATION (USD/KG)
    5.6 MACROECONOMIC INDICATORS 
           5.6.1 INTRODUCTION
           5.6.2 GLOBAL GDP TRENDS
                    TABLE 3 TRENDS OF PER CAPITA GDP (USD) 2020–2022
                    TABLE 4 GDP GROWTH ESTIMATE AND PROJECTION OF KEY COUNTRIES, 2023–2027
           5.6.3 TRENDS IN AUTOMOTIVE INDUSTRY
                    TABLE 5 VEHICLE PRODUCTION STATISTICS, BY COUNTRY, 2021–2022 (UNIT)
    5.7 TARIFF AND REGULATORY LANDSCAPE 
           5.7.1 REGULATIONS
                    5.7.1.1 Europe
                    5.7.1.2 US
                    5.7.1.3 Others
           5.7.2 TARIFFS
                    5.7.2.1 Standards
           5.7.3 REGULATORY BODIES, GOVERNMENT AGENCIES, AND OTHER ORGANIZATIONS
                    TABLE 6 REGULATORY BODIES, GOVERNMENT AGENCIES AND OTHER ORGANIZATIONS
    5.8 ECOSYSTEM/MARKET MAP 
          FIGURE 22 AUTOMOTIVE CERAMICS MARKET ECOSYSTEM
 
6 AUTOMOTIVE CERAMICS MARKET, BY MATERIAL (Page No. - 69)
    6.1 INTRODUCTION 
          FIGURE 23 ZIRCONIA OXIDE TO BE FASTEST-GROWING MATERIAL TYPE OF AUTOMOTIVE CERAMICS
          TABLE 7 AUTOMOTIVE CERAMICS MARKET, BY MATERIAL, 2019–2022 (USD MILLION)
          TABLE 8 AUTOMOTIVE CERAMICS MARKET, BY MATERIAL, 2023–2028 (USD MILLION)
          TABLE 9 AUTOMOTIVE CERAMICS MARKET, BY MATERIAL, 2019–2022 (KILOTON)
          TABLE 10 AUTOMOTIVE CERAMICS MARKET, BY MATERIAL, 2023–2028 (KILOTON)
    6.2 ALUMINA OXIDE 
    6.3 TITANATE OXIDE 
    6.4 ZIRCONIA OXIDE 
    6.5 OTHER MATERIALS 
 
7 AUTOMOTIVE CERAMICS MARKET, BY VEHICLE TYPE (Page No. - 75)
    7.1 INTRODUCTION 
          FIGURE 24 PASSENGER VEHICLE TO BE FASTER-GROWING VEHICLE TYPE OF AUTOMOTIVE CERAMICS
          TABLE 11 AUTOMOTIVE CERAMICS MARKET, BY VEHICLE TYPE, 2019–2022 (USD MILLION)
          TABLE 12 AUTOMOTIVE CERAMICS MARKET, BY VEHICLE TYPE, 2023–2028 (USD MILLION)
          TABLE 13 AUTOMOTIVE CERAMICS MARKET, BY VEHICLE TYPE, 2019–2022 (KILOTON)
          TABLE 14 AUTOMOTIVE CERAMICS MARKET, BY VEHICLE TYPE, 2023–2028 (KILOTON)
    7.2 PASSENGER VEHICLE 
    7.3 COMMERCIAL VEHICLE 
 
8 AUTOMOTIVE CERAMICS MARKET, BY APPLICATION (Page No. - 79)
    8.1 INTRODUCTION 
          FIGURE 25 AUTOMOTIVE ELECTRONICS TO BE FASTEST-GROWING APPLICATION OF AUTOMOTIVE CERAMICS
          TABLE 15 AUTOMOTIVE CERAMICS MARKET, BY APPLICATION, 2019–2022 (USD MILLION)
          TABLE 16 AUTOMOTIVE CERAMICS MARKET, BY APPLICATION, 2023–2028 (USD MILLION)
          TABLE 17 AUTOMOTIVE CERAMICS MARKET, BY APPLICATION, 2019–2022 (KILOTON)
          TABLE 18 AUTOMOTIVE CERAMICS MARKET, BY APPLICATION, 2023–2028 (KILOTON)
    8.2 ENGINE PARTS 
    8.3 EXHAUST SYSTEMS 
    8.4 AUTOMOTIVE ELECTRONICS 
    8.5 BRAKING SYSTEMS 
    8.6 OTHER APPLICATIONS 
 
9 AUTOMOTIVE CERAMICS MARKET, BY REGION (Page No. - 85)
    9.1 INTRODUCTION 
          FIGURE 26 CHINA TO BE FASTEST-GROWING MARKET DURING FORECAST PERIOD
          TABLE 19 AUTOMOTIVE CERAMICS MARKET, BY REGION, 2019–2022 (USD MILLION)
          TABLE 20 AUTOMOTIVE CERAMICS MARKET, BY REGION, 2023–2028 (USD MILLION)
          TABLE 21 AUTOMOTIVE CERAMICS MARKET, BY REGION, 2019–2022 (KILOTON)
          TABLE 22 AUTOMOTIVE CERAMICS MARKET, BY REGION, 2023–2028 (KILOTON)
    9.2 ASIA PACIFIC 
           9.2.1 RECESSION IMPACT
                    FIGURE 27 ASIA PACIFIC: AUTOMOTIVE CERAMICS MARKET SNAPSHOT
                    TABLE 23 ASIA PACIFIC: AUTOMOTIVE CERAMICS MARKET, BY COUNTRY,  2019–2022 (USD MILLION)
                    TABLE 24 ASIA PACIFIC: AUTOMOTIVE CERAMICS MARKET, BY COUNTRY,  2023–2028 (USD MILLION)
                    TABLE 25 ASIA PACIFIC: AUTOMOTIVE CERAMICS MARKET, BY COUNTRY, 2019–2022 (KILOTON)
                    TABLE 26 ASIA PACIFIC: AUTOMOTIVE CERAMICS MARKET, BY COUNTRY, 2023–2028 (KILOTON)
                    TABLE 27 ASIA PACIFIC: AUTOMOTIVE CERAMICS MARKET, BY MATERIAL TYPE,  2019–2022 (USD MILLION)
                    TABLE 28 ASIA PACIFIC: AUTOMOTIVE CERAMICS MARKET, BY MATERIAL TYPE,  2023–2028 (USD MILLION)
                    TABLE 29 ASIA PACIFIC: AUTOMOTIVE CERAMICS MARKET, BY MATERIAL TYPE,  2019–2022 (KILOTON)
                    TABLE 30 ASIA PACIFIC: AUTOMOTIVE CERAMICS MARKET, BY MATERIAL TYPE,  2023–2028 (KILOTON)
                    TABLE 31 ASIA PACIFIC: AUTOMOTIVE CERAMICS MARKET, BY APPLICATION,  2019–2022 (USD MILLION)
                    TABLE 32 ASIA PACIFIC: AUTOMOTIVE CERAMICS MARKET, BY APPLICATION,  2023–2028 (USD MILLION)
                    TABLE 33 ASIA PACIFIC: AUTOMOTIVE CERAMICS MARKET, BY APPLICATION,  2019–2022 (KILOTON)
                    TABLE 34 ASIA PACIFIC: AUTOMOTIVE CERAMICS MARKET, BY APPLICATION,  2023–2028 (KILOTON)
           9.2.2 CHINA
                    9.2.2.1 Burgeoning electronic vehicle market to drive demand
                                TABLE 35 CHINA: AUTOMOTIVE CERAMICS MARKET, BY APPLICATION,  2019–2022 (USD MILLION)
                                TABLE 36 CHINA: AUTOMOTIVE CERAMICS MARKET, BY APPLICATION,  2023–2028 (USD MILLION)
                                TABLE 37 CHINA: AUTOMOTIVE CERAMICS MARKET, BY APPLICATION,  2019–2022 (KILOTON)
                                TABLE 38 CHINA: AUTOMOTIVE CERAMICS MARKET, BY APPLICATION,  2023–2028 (KILOTON)
           9.2.3 JAPAN
                    9.2.3.1 Focus on environmental regulations and emission reduction to propel market growth
                                TABLE 39 JAPAN: AUTOMOTIVE CERAMICS MARKET, BY APPLICATION,  2019–2022 (USD MILLION)
                                TABLE 40 JAPAN: AUTOMOTIVE CERAMICS MARKET, BY APPLICATION,  2023–2028 (USD MILLION)
                                TABLE 41 JAPAN: AUTOMOTIVE CERAMICS MARKET, BY APPLICATION,  2019–2022 (KILOTON)
                                TABLE 42 JAPAN: AUTOMOTIVE CERAMICS MARKET, BY APPLICATION,  2023–2028 (KILOTON)
           9.2.4 SOUTH KOREA
                    9.2.4.1 Rapid industrialization, globalization, and technological advancements to propel growth
                                TABLE 43 SOUTH KOREA: AUTOMOTIVE CERAMICS MARKET, BY APPLICATION,  2019–2022 (USD MILLION)
                                TABLE 44 SOUTH KOREA: AUTOMOTIVE CERAMICS MARKET, BY APPLICATION,  2023–2028 (USD MILLION)
                                TABLE 45 SOUTH KOREA: AUTOMOTIVE CERAMICS MARKET, BY APPLICATION,  2019–2022 (KILOTON)
                                TABLE 46 SOUTH KOREA: AUTOMOTIVE CERAMICS MARKET, BY APPLICATION,  2023–2028 (KILOTON)
           9.2.5 INDIA
                    9.2.5.1 Increased vehicle production and shift toward electric mobility to drive market
                                TABLE 47 INDIA: AUTOMOTIVE CERAMICS MARKET, BY APPLICATION,  2019–2022 (USD MILLION)
                                TABLE 48 INDIA: AUTOMOTIVE CERAMICS MARKET, BY APPLICATION,  2023–2028 (USD MILLION)
                                TABLE 49 INDIA: AUTOMOTIVE CERAMICS MARKET, BY APPLICATION,  2019–2022 (KILOTON)
                                TABLE 50 INDIA: AUTOMOTIVE CERAMICS MARKET, BY APPLICATION,  2023–2028 (KILOTON)
           9.2.6 INDONESIA
                    9.2.6.1 Ongoing technological developments to drive market
                                TABLE 51 INDONESIA: AUTOMOTIVE CERAMICS MARKET, BY APPLICATION,  2019–2022 (USD MILLION)
                                TABLE 52 INDONESIA: AUTOMOTIVE CERAMICS MARKET, BY APPLICATION,  2023–2028 (USD MILLION)
                                TABLE 53 INDONESIA: AUTOMOTIVE CERAMICS MARKET, BY APPLICATION,  2019–2022 (KILOTON)
                                TABLE 54 INDONESIA: AUTOMOTIVE CERAMICS MARKET, BY APPLICATION,  2023–2028 (KILOTON)
           9.2.7 REST OF ASIA PACIFIC
                    TABLE 55 REST OF ASIA PACIFIC: AUTOMOTIVE CERAMICS MARKET, BY APPLICATION,  2019–2022 (USD MILLION)
                    TABLE 56 REST OF ASIA PACIFIC: AUTOMOTIVE CERAMICS MARKET, BY APPLICATION,  2023–2028 (USD MILLION)
                    TABLE 57 REST OF ASIA PACIFIC: AUTOMOTIVE CERAMICS MARKET, BY APPLICATION,  2019–2022 (KILOTON)
                    TABLE 58 REST OF ASIA PACIFIC: AUTOMOTIVE CERAMICS MARKET, BY APPLICATION,  2023–2028 (KILOTON)
    9.3 NORTH AMERICA 
           9.3.1 RECESSION IMPACT
                    FIGURE 28 NORTH AMERICA: AUTOMOTIVE CERAMICS MARKET SNAPSHOT
                    TABLE 59 NORTH AMERICA: AUTOMOTIVE CERAMICS MARKET, BY COUNTRY,  2019–2022 (USD MILLION)
                    TABLE 60 NORTH AMERICA: AUTOMOTIVE CERAMICS MARKET, BY COUNTRY,  2023–2028 (USD MILLION)
                    TABLE 61 NORTH AMERICA: AUTOMOTIVE CERAMICS MARKET, BY COUNTRY,  2019–2022 (KILOTON)
                    TABLE 62 NORTH AMERICA: AUTOMOTIVE CERAMICS MARKET, BY COUNTRY,  2023–2028 (KILOTON)
                    TABLE 63 NORTH AMERICA: AUTOMOTIVE CERAMICS MARKET, BY MATERIAL TYPE,  2019–2022 (USD MILLION)
                    TABLE 64 NORTH AMERICA: AUTOMOTIVE CERAMICS MARKET, BY MATERIAL TYPE,  2023–2028 (USD MILLION)
                    TABLE 65 NORTH AMERICA: AUTOMOTIVE CERAMICS MARKET, BY MATERIAL TYPE,  2019–2022 (KILOTON)
                    TABLE 66 NORTH AMERICA: AUTOMOTIVE CERAMICS MARKET, BY MATERIAL TYPE,  2023–2028 (KILOTON)
                    TABLE 67 NORTH AMERICA: AUTOMOTIVE CERAMICS MARKET, BY APPLICATION,  2019–2022 (USD MILLION)
                    TABLE 68 NORTH AMERICA: AUTOMOTIVE CERAMICS MARKET, BY APPLICATION,  2023–2028 (USD MILLION)
                    TABLE 69 NORTH AMERICA: AUTOMOTIVE CERAMICS MARKET, BY APPLICATION,  2019–2022 (KILOTON)
                    TABLE 70 NORTH AMERICA: AUTOMOTIVE CERAMICS MARKET, BY APPLICATION,  2023–2028 (KILOTON)
           9.3.2 US
                    9.3.2.1 Rising demand for smart and advanced electronics in automotive industry to drive market
                                TABLE 71 US: AUTOMOTIVE CERAMICS MARKET, BY APPLICATION, 2019–2022 (USD MILLION)
                                TABLE 72 US: AUTOMOTIVE CERAMICS MARKET, BY APPLICATION, 2023–2028 (USD MILLION)
                                TABLE 73 US: AUTOMOTIVE CERAMICS MARKET, BY APPLICATION, 2019–2022 (KILOTON)
                                TABLE 74 US: AUTOMOTIVE CERAMICS MARKET, BY APPLICATION, 2023–2028 (KILOTON)
           9.3.3 MEXICO
                    9.3.3.1 Rise in passenger vehicle production to drive growth
                                TABLE 75 MEXICO: AUTOMOTIVE CERAMICS MARKET, BY APPLICATION, 2019–2022 (USD MILLION)
                                TABLE 76 MEXICO: AUTOMOTIVE CERAMICS MARKET, BY APPLICATION, 2023–2028 (USD MILLION)
                                TABLE 77 MEXICO: AUTOMOTIVE CERAMICS MARKET, BY APPLICATION, 2019–2022 (KILOTON)
                                TABLE 78 MEXICO: AUTOMOTIVE CERAMICS MARKET, BY APPLICATION, 2023–2028 (KILOTON)
           9.3.4 CANADA
                    9.3.4.1 Rigorous R&D activities in automotive sector to drive market
                                TABLE 79 CANADA: AUTOMOTIVE CERAMICS MARKET, BY APPLICATION,  2019–2022 (USD MILLION)
                                TABLE 80 CANADA: AUTOMOTIVE CERAMICS MARKET, BY APPLICATION,  2023–2028 (USD MILLION)
                                TABLE 81 CANADA: AUTOMOTIVE CERAMICS MARKET, BY APPLICATION,  2019–2022 (KILOTON)
                                TABLE 82 CANADA: AUTOMOTIVE CERAMICS MARKET, BY APPLICATION,  2023–2028 (KILOTON
    9.4 EUROPE 
           9.4.1 RECESSION IMPACT
                    FIGURE 29 EUROPE : AUTOMOTIVE CERAMICS MARKET SNAPSHOT
                    TABLE 83 EUROPE: AUTOMOTIVE CERAMICS MARKET, BY COUNTRY, 2019–2022 (USD MILLION)
                    TABLE 84 EUROPE: AUTOMOTIVE CERAMICS MARKET, BY COUNTRY, 2023–2028 (USD MILLION)
                    TABLE 85 EUROPE: AUTOMOTIVE CERAMICS MARKET, BY COUNTRY, 2019–2022 (KILOTON)
                    TABLE 86 EUROPE: AUTOMOTIVE CERAMICS MARKET, BY COUNTRY, 2023–2028 (KILOTON)
                    TABLE 87 EUROPE: AUTOMOTIVE CERAMICS MARKET, BY MATERIAL TYPE,  2019–2022 (USD MILLION)
                    TABLE 88 EUROPE: AUTOMOTIVE CERAMICS MARKET, BY MATERIAL TYPE,  2023–2028 (USD MILLION)
                    TABLE 89 EUROPE: AUTOMOTIVE CERAMICS MARKET, BY MATERIAL TYPE, 2019–2022 (KILOTON)
                    TABLE 90 EUROPE: AUTOMOTIVE CERAMICS MARKET, BY MATERIAL TYPE, 2023–2028 (KILOTON)
                    TABLE 91 EUROPE: AUTOMOTIVE CERAMICS MARKET, BY APPLICATION,  2019–2022 (USD MILLION)
                    TABLE 92 EUROPE: AUTOMOTIVE CERAMICS MARKET, BY APPLICATION,  2023–2028 (USD MILLION)
                    TABLE 93 EUROPE: AUTOMOTIVE CERAMICS MARKET, BY APPLICATION,  2019–2022 (KILOTON)
                    TABLE 94 EUROPE: AUTOMOTIVE CERAMICS MARKET, BY APPLICATION,  2023–2028 (KILOTON)
           9.4.2 GERMANY
                    9.4.2.1 Increasing demand for automotive electronics and stringent emission norms to drive growth
                                TABLE 95 GERMANY: AUTOMOTIVE CERAMICS MARKET, BY APPLICATION,  2019–2022 (USD MILLION)
                                TABLE 96 GERMANY: AUTOMOTIVE CERAMICS MARKET, BY APPLICATION,  2023–2028 (USD MILLION)
                                TABLE 97 GERMANY: AUTOMOTIVE CERAMICS MARKET, BY APPLICATION,  2019–2022 (KILOTON)
                                TABLE 98 GERMANY: AUTOMOTIVE CERAMICS MARKET, BY APPLICATION,  2023–2028 (KILOTON)
           9.4.3 UK
                    9.4.3.1 Rising technological developments and government support to drive market
                                TABLE 99 UK: AUTOMOTIVE CERAMICS MARKET, BY APPLICATION,  2019–2022 (USD MILLION)
                                TABLE 100 UK: AUTOMOTIVE CERAMICS MARKET, BY APPLICATION,  2023–2028 (USD MILLION)
                                TABLE 101 UK: AUTOMOTIVE CERAMICS MARKET, BY APPLICATION,  2019–2022 (KILOTON)
                                TABLE 102 UK: AUTOMOTIVE CERAMICS MARKET, BY APPLICATION, 2023–2028 (KILOTON)
           9.4.4 FRANCE
                    9.4.4.1 Rising demand from automotive electronics application to drive market
                                TABLE 103 FRANCE: AUTOMOTIVE CERAMICS MARKET, BY APPLICATION,  2019–2022 (USD MILLION)
                                TABLE 104 FRANCE: AUTOMOTIVE CERAMICS MARKET, BY APPLICATION,  2023–2028 (USD MILLION)
                                TABLE 105 FRANCE: AUTOMOTIVE CERAMICS MARKET, BY APPLICATION,  2019–2022 (KILOTON)
                                TABLE 106 FRANCE: AUTOMOTIVE CERAMICS MARKET, BY APPLICATION,  2023–2028 (KILOTON)
           9.4.5 SPAIN
                    9.4.5.1 Rising technological developments and government support to drive market
                                TABLE 107 SPAIN: AUTOMOTIVE CERAMICS MARKET, BY APPLICATION,  2019–2022 (USD MILLION)
                                TABLE 108 SPAIN: AUTOMOTIVE CERAMICS MARKET, BY APPLICATION,  2023–2028 (USD MILLION)
                                TABLE 109 SPAIN: AUTOMOTIVE CERAMICS MARKET, BY APPLICATION,  2019–2022 (KILOTON)
                                TABLE 110 SPAIN: AUTOMOTIVE CERAMICS MARKET, BY APPLICATION,  2023–2028 (KILOTON)
           9.4.6 ITALY
                    9.4.6.1 Growing demand for advanced technologies in automobiles to propel growth
                                TABLE 111 ITALY: AUTOMOTIVE CERAMICS MARKET, BY APPLICATION,  2019–2022 (USD MILLION)
                                TABLE 112 ITALY: AUTOMOTIVE CERAMICS MARKET, BY APPLICATION,  2023–2028 (USD MILLION)
                                TABLE 113 ITALY: AUTOMOTIVE CERAMICS MARKET, BY APPLICATION,  2019–2022 (KILOTON)
                                TABLE 114 ITALY: AUTOMOTIVE CERAMICS MARKET, BY APPLICATION,  2023–2028 (KILOTON)
           9.4.7 REST OF EUROPE
                    TABLE 115 REST OF EUROPE: AUTOMOTIVE CERAMICS MARKET, BY APPLICATION,  2019–2022 (USD MILLION)
                    TABLE 116 REST OF EUROPE: AUTOMOTIVE CERAMICS MARKET, BY APPLICATION,  2023–2028 (USD MILLION)
                    TABLE 117 REST OF EUROPE: AUTOMOTIVE CERAMICS MARKET, BY APPLICATION,  2019–2022 (KILOTON)
                    TABLE 118 REST OF EUROPE: AUTOMOTIVE CERAMICS MARKET, BY APPLICATION,  2023–2028 (KILOTON)
    9.5 SOUTH AMERICA 
           9.5.1 RECESSION IMPACT
                    TABLE 119 SOUTH AMERICA: AUTOMOTIVE CERAMICS MARKET, BY COUNTRY,  2019–2022 (USD MILLION)
                    TABLE 120 SOUTH AMERICA: AUTOMOTIVE CERAMICS MARKET, BY COUNTRY,  2023–2028 (USD MILLION)
                    TABLE 121 SOUTH AMERICA: AUTOMOTIVE CERAMICS MARKET, BY COUNTRY,  2019–2022 (KILOTON)
                    TABLE 122 SOUTH AMERICA: AUTOMOTIVE CERAMICS MARKET, BY COUNTRY,  2023–2028 (KILOTON)
                    TABLE 123 SOUTH AMERICA: AUTOMOTIVE CERAMICS MARKET, BY MATERIAL TYPE,  2019–2022 (USD MILLION)
                    TABLE 124 SOUTH AMERICA: AUTOMOTIVE CERAMICS MARKET, BY MATERIAL TYPE,  2023–2028 (USD MILLION)
                    TABLE 125 SOUTH AMERICA: AUTOMOTIVE CERAMICS MARKET, BY MATERIAL TYPE,  2019–2022 (KILOTON)
                    TABLE 126 SOUTH AMERICA: AUTOMOTIVE CERAMICS MARKET, BY MATERIAL TYPE,  2023–2028 (KILOTON)
                    TABLE 127 SOUTH AMERICA: AUTOMOTIVE CERAMICS MARKET, BY APPLICATION,  2019–2022 (USD MILLION)
                    TABLE 128 SOUTH AMERICA: AUTOMOTIVE CERAMICS MARKET, BY APPLICATION,  2023–2028 (USD MILLION)
                    TABLE 129 SOUTH AMERICA: AUTOMOTIVE CERAMICS MARKET, BY APPLICATION,  2019–2022 (KILOTON)
                    TABLE 130 SOUTH AMERICA: AUTOMOTIVE CERAMICS MARKET, BY APPLICATION,  2023–2028 (KILOTON)
           9.5.2 BRAZIL
                    9.5.2.1 Rising demand from engine parts and exhaust systems to drive market
                                TABLE 131 BRAZIL: AUTOMOTIVE CERAMICS MARKET, BY APPLICATION,  2019–2022 (USD MILLION)
                                TABLE 132 BRAZIL: AUTOMOTIVE CERAMICS MARKET, BY APPLICATION,  2023–2028 (USD MILLION)
                                TABLE 133 BRAZIL: AUTOMOTIVE CERAMICS MARKET, BY APPLICATION,  2019–2022 (KILOTON)
                                TABLE 134 BRAZIL: AUTOMOTIVE CERAMICS MARKET, BY APPLICATION,  2023–2028 (KILOTON)
           9.5.3 ARGENTINA
                    9.5.3.1 Rising demand for electronic components to drive market
                                TABLE 135 ARGENTINA: AUTOMOTIVE CERAMICS MARKET, BY APPLICATION,  2019–2022 (USD MILLION)
                                TABLE 136 ARGENTINA: AUTOMOTIVE CERAMICS MARKET, BY APPLICATION,  2023–2028 (USD MILLION)
                                TABLE 137 ARGENTINA: AUTOMOTIVE CERAMICS MARKET, BY APPLICATION,  2019–2022 (KILOTON)
                                TABLE 138 ARGENTINA: AUTOMOTIVE CERAMICS MARKET, BY APPLICATION,  2023–2028 (KILOTON)
           9.5.4 REST OF SOUTH AMERICA
                    TABLE 139 REST OF SOUTH AMERICA: AUTOMOTIVE CERAMICS MARKET, BY APPLICATION,  2019–2022 (USD MILLION)
                    TABLE 140 REST OF SOUTH AMERICA: AUTOMOTIVE CERAMICS MARKET, BY APPLICATION,  2023–2028 (USD MILLION)
                    TABLE 141 REST OF SOUTH AMERICA: AUTOMOTIVE CERAMICS MARKET, BY APPLICATION,  2019–2022 (KILOTON)
                    TABLE 142 REST OF SOUTH AMERICA: AUTOMOTIVE CERAMICS MARKET, BY APPLICATION,  2023–2028 (KILOTON)
    9.6 MIDDLE EAST & AFRICA 
           9.6.1 RECESSION IMPACT
                    TABLE 143 MIDDLE EAST & AFRICA: AUTOMOTIVE CERAMICS MARKET, BY COUNTRY,  2019–2022 (USD MILLION)
                    TABLE 144 MIDDLE EAST & AFRICA: AUTOMOTIVE CERAMICS MARKET, BY COUNTRY,  2023–2028 (USD MILLION)
                    TABLE 145 MIDDLE EAST & AFRICA: AUTOMOTIVE CERAMICS MARKET, BY COUNTRY,  2019–2022 (KILOTON)
                    TABLE 146 MIDDLE EAST & AFRICA: AUTOMOTIVE CERAMICS MARKET, BY COUNTRY,  2023–2028 (KILOTON)
                    TABLE 147 MIDDLE EAST & AFRICA: AUTOMOTIVE CERAMICS MARKET, BY MATERIAL TYPE,  2019–2022 (USD MILLION)
                    TABLE 148 MIDDLE EAST & AFRICA: AUTOMOTIVE CERAMICS MARKET, BY MATERIAL TYPE,  2023–2028 (USD MILLION)
                    TABLE 149 MIDDLE EAST & AFRICA: AUTOMOTIVE CERAMICS MARKET, BY MATERIAL TYPE,  2019–2022 (KILOTON)
                    TABLE 150 MIDDLE EAST & AFRICA: AUTOMOTIVE CERAMICS MARKET, BY MATERIAL TYPE,  2023–2028 (KILOTON)
                    TABLE 151 MIDDLE EAST & AFRICA: AUTOMOTIVE CERAMICS MARKET, BY APPLICATION,  2019–2022 (USD MILLION)
                    TABLE 152 MIDDLE EAST & AFRICA: AUTOMOTIVE CERAMICS MARKET, BY APPLICATION,  2023–2028 (USD MILLION)
                    TABLE 153 MIDDLE EAST & AFRICA: AUTOMOTIVE CERAMICS MARKET, BY APPLICATION,  2019–2022 (KILOTON)
                    TABLE 154 MIDDLE EAST & AFRICA: AUTOMOTIVE CERAMICS MARKET, BY APPLICATION,  2023–2028 (KILOTON)
           9.6.2 SAUDI ARABIA
                    9.6.2.1 Stringent emission regulations to drive market
                                TABLE 155 SAUDI ARABIA: AUTOMOTIVE CERAMICS MARKET, BY APPLICATION,  2019–2022 (USD MILLION)
                                TABLE 156 SAUDI ARABIA: AUTOMOTIVE CERAMICS MARKET, BY APPLICATION,  2023–2028 (USD MILLION)
                                TABLE 157 SAUDI ARABIA: AUTOMOTIVE CERAMICS MARKET, BY APPLICATION,  2019–2022 (KILOTON)
                                TABLE 158 SAUDI ARABIA: AUTOMOTIVE CERAMICS MARKET, BY APPLICATION,  2023–2028 (KILOTON)
           9.6.3 SOUTH AFRICA
                    9.6.3.1 High demand for electronics and miniaturized components in automobiles to drive market
                                TABLE 159 SOUTH AFRICA: AUTOMOTIVE CERAMICS MARKET, BY APPLICATION,  2019–2022 (USD MILLION)
                                TABLE 160 SOUTH AFRICA: AUTOMOTIVE CERAMICS MARKET, BY APPLICATION,  2023–2028 (USD MILLION)
                                TABLE 161 SOUTH AFRICA: AUTOMOTIVE CERAMICS MARKET, BY APPLICATION,  2019–2022 (KILOTON)
                                TABLE 162 SOUTH AFRICA: AUTOMOTIVE CERAMICS MARKET, BY APPLICATION,  2023–2028 (KILOTON)
           9.6.4 REST OF MIDDLE EAST & AFRICA
                    TABLE 163 REST OF MIDDLE EAST & AFRICA: AUTOMOTIVE CERAMICS MARKET, BY APPLICATION,  2019–2022 (USD MILLION)
                    TABLE 164 REST OF MIDDLE EAST & AFRICA: AUTOMOTIVE CERAMICS MARKET, BY APPLICATION,  2023–2028 (USD MILLION)
                    TABLE 165 REST OF MIDDLE EAST & AFRICA: AUTOMOTIVE CERAMICS MARKET, BY APPLICATION,  2019–2022 (KILOTON)
                    TABLE 166 REST OF MIDDLE EAST & AFRICA AUTOMOTIVE CERAMICS MARKET, BY APPLICATION,  2023–2028 (KILOTON)
 
10 COMPETITIVE LANDSCAPE (Page No. - 153)
     10.1 OVERVIEW 
     10.2 STRATEGIES ADOPTED BY KEY PLAYERS 
             TABLE 167 COMPANIES ADOPTED INVESTMENT & EXPANSION AND PRODUCT DEVELOPMENT AS KEY GROWTH STRATEGIES BETWEEN 2018 AND 2023
     10.3 REVENUE ANALYSIS 
             TABLE 168 REVENUE ANALYSIS OF TOP FIVE PLAYERS (2020–2022)
     10.4 RANKING OF KEY PLAYERS 
             FIGURE 30 RANKING OF TOP 5 PLAYERS IN AUTOMOTIVE CERAMICS MARKET
             10.4.1 KYOCERA CORPORATION
             10.4.2 CERAMTEC GMBH.
             10.4.3 NITERRA
             10.4.4 MORGAN ADVANCED MATERIALS
             10.4.5 COORSTEK INC.
     10.5 COMPANY EVALUATION MATRIX 
             10.5.1 STARS
             10.5.2 EMERGING LEADERS
             10.5.3 PERVASIVE PLAYERS
             10.5.4 PARTICIPANTS
                        FIGURE 31 AUTOMOTIVE CERAMICS MARKET: COMPANY EVALUATION MATRIX FOR TIER 1 COMPANIES, 2023
             10.5.5 COMPANY FOOTPRINT
                        10.5.5.1 Company material footprint
                                      TABLE 169 OVERALL MATERIAL FOOTPRINT
                        10.5.5.2 Company application footprint
                                      TABLE 170 OVERALL APPLICATION FOOTPRINT
                        10.5.5.3 Company region footprint
                                      TABLE 171 OVERALL REGION FOOTPRINT
                        10.5.5.4 Company overall footprint
                                      TABLE 172 OVERALL COMPANY FOOTPRINT
     10.6 COMPETITIVE SITUATION AND TRENDS 
             10.6.1 PRODUCT LAUNCHES/DEVELOPMENTS
                        TABLE 173 AUTOMOTIVE CERAMICS: PRODUCT LAUNCHES/DEVELOPMENTS, 2018–2023
             10.6.2 DEALS
                        TABLE 174 AUTOMOTIVE CERAMICS: DEALS, 2018–2023
             10.6.3 EXPANSIONS
                        TABLE 175 AUTOMOTIVE CERAMICS: EXPANSIONS, 2018–2023
 
11 COMPANY PROFILES (Page No. - 168)
(Business overview, Products offered, Recent Developments, MNM view)*
     11.1 MAJOR PLAYERS 
             11.1.1 KYOCERA CORPORATION
                        TABLE 176 KYOCERA CORPORATION: COMPANY OVERVIEW
                        FIGURE 32 KYOCERA CORPORATION: COMPANY SNAPSHOT
                        TABLE 177 KYOCERA CORPORATION: PRODUCT OFFERINGS
                        TABLE 178 KYOCERA CORPORATION: DEALS
                        TABLE 179 KYOCERA CORPORATION: OTHERS
             11.1.2 CERAMTEC GMBH
                        TABLE 180 CERAMTEC GMBH: COMPANY OVERVIEW
                        FIGURE 33 CERAMTEC GMBH: COMPANY SNAPSHOT
                        TABLE 181 CERAMTEC GMBH: PRODUCT OFFERINGS
                        TABLE 182 CERAMTEC GMBH: PRODUCT LAUNCHES
             11.1.3 NITERRA
                        TABLE 183 NITERRA: COMPANY OVERVIEW
                        FIGURE 34 NITERRA: COMPANY SNAPSHOT
                        TABLE 184 NITERRA: PRODUCT OFFERINGS
                        TABLE 185 NITERRA: DEALS
             11.1.4 COORSTEK INC
                        TABLE 186 COORSTEK INC: COMPANY OVERVIEW
                        TABLE 187 COORSTEK INC: PRODUCT OFFERINGS
                        TABLE 188 COORSTEK: OTHER DEVELOPMENTS
             11.1.5 MORGAN ADVANCED MATERIALS
                        TABLE 189 MORGAN ADVANCED MATERIALS: COMPANY OVERVIEW
                        FIGURE 35 MORGAN ADVANCED MATERIALS: COMPANY SNAPSHOT
                        TABLE 190 MORGAN ADVANCED MATERIALS: PRODUCT OFFERINGS
                        TABLE 191 MORGAN ADVANCED MATERIALS: DEALS
                        TABLE 192 MORGAN ADVANCED MATERIALS: OTHER DEVELOPMENTS
             11.1.6 SAINT-GOBAIN CERAMIC
                        TABLE 193 SAINT-GOBAIN CERAMIC: COMPANY OVERVIEW
                        TABLE 194 SAINT-GOBAIN CERAMIC: PRODUCT OFFERINGS
             11.1.7 ELAN TECHNOLOGIES
                        TABLE 195 ELAN TECHNOLOGIES: COMPANY OVERVIEW
                        TABLE 196 ELAN TECHNOLOGIES: PRODUCT OFFERINGS
             11.1.8 3M
                        TABLE 197 3M: COMPANY OVERVIEW
                        FIGURE 36 3M: COMPANY SNAPSHOT
                        TABLE 198 3M: PRODUCT OFFERINGS
             11.1.9 IBIDEN CO., LTD.
                        TABLE 199 IBIDEN CO., LTD: COMPANY OVERVIEW
                        FIGURE 37 IBIDEN CO., LTD.: COMPANY SNAPSHOT
                        TABLE 200 IBIDEN CO., LTD.: PRODUCT OFFERINGS
             11.1.10 CORNING INCORPORATED
                        TABLE 201 CORNING INCORPORATED: COMPANY OVERVIEW
                        FIGURE 38 CORNING INCORPORATED: COMPANY SNAPSHOT
                        TABLE 202 CORNING INCORPORATED: PRODUCT OFFERINGS
     11.2 OTHER MARKET PLAYERS 
             11.2.1 MCDANEL ADVANCED CERAMIC TECHNOLOGIES
                        TABLE 203 MCDANEL ADVANCED CERAMIC TECHNOLOGIES: COMPANY OVERVIEW
             11.2.2 DYSON TECHNICAL CERAMICS
                        TABLE 204 DYSON TECHNICAL CERAMICS: COMPANY OVERVIEW
             11.2.3 ALMATIS
                        TABLE 205 ALMATIS: COMPANY OVERVIEW
             11.2.4 INTERNATIONAL SYALONS (NEWCASTLE) LIMITED
                        TABLE 206 INTERNATIONAL SYALONS (NEWCASTLE) LIMITED: COMPANY OVERVIEW
             11.2.5 NGK INSULATORS LTD.
                        TABLE 207 NGK INSULATORS LTD.: COMPANY OVERVIEW
             11.2.6 INMATEC TECHNOLOGIES GMBH
                        TABLE 208 INMATEC TECHNOLOGIES GMBH: COMPANY OVERVIEW
             11.2.7 BLASCH AUTOMOTIVE CERAMICS, INC.
                        TABLE 209 BLASCH AUTOMOTIVE CERAMICS, INC.: COMPANY OVERVIEW
             11.2.8 BAIKOWSKI SAS.
                        TABLE 210 BAIKOWSKI SAS.: COMPANY OVERVIEW
             11.2.9 APPLIED CERAMICS, INC.
                        TABLE 211 APPLIED CERAMICS, INC: COMPANY OVERVIEW
             11.2.10 ORTECH ADVANCED CERAMICS.
                        TABLE 212 ORTECH ADVANCED CERAMICS: COMPANY OVERVIEW
             11.2.11 ANOOP CERAMICS
                        TABLE 213 ANOOP CERAMICS: COMPANY OVERVIEW
             11.2.12 VINAYAK TECHNO CERAMICS
                        TABLE 214 VINAYAK TECHNO CERAMICS: COMPANY OVERVIEW
             11.2.13 KHYATI CERAMICS
                        TABLE 215 KHYATI CERAMICS: COMPANY OVERVIEW
             11.2.14 ADVANCED CERAMICS MANUFACTURING
                        TABLE 216 ADVANCED CERAMICS MANUFACTURING: COMPANY OVERVIEW
             11.2.15 AMERICAN ELEMENTS
                        TABLE 217 AMERICAN ELEMENTS: COMPANY OVERVIEW
 
*Details on Business overview, Products/Services/Solutions offered, Recent Developments, MNM view might not be captured in case of unlisted companies.
 
12 APPENDIX (Page No. - 209)
     12.1 DISCUSSION GUIDE 
     12.2 KNOWLEDGESTORE: MARKETSANDMARKETS’  SUBSCRIPTION PORTAL 
     12.3 CUSTOMIZATION OPTIONS 
     12.4 RELATED REPORTS 
     12.5 AUTHOR DETAILS 

The study involved four major activities in estimating the market size of the automotive ceramics market. Exhaustive secondary research was done to collect information on the market, the peer market, and the parent market. The next step was to validate these findings, assumptions, and sizing with industry experts across the value chain through primary research. Both top-down and bottom-up approaches were employed to estimate the complete market size. Thereafter, the market breakdown and data triangulation procedures were used to estimate the market size of the segments and subsegments.

Secondary Research

In the secondary research process, various secondary sources have been referred to for identifying and collecting information for this study. These secondary sources include annual reports, press releases, investor presentations of companies, white papers, certified publications, trade directories, certified publications, articles from recognized authors, gold standard and silver standard websites, and databases.

Secondary research has been used to obtain key information about the value chain of the industry, monetary chain of the market, the total pool of key automotive ceramics, market classification and segmentation according to industry trends to the bottom-most level, and regional markets. It was also used to obtain information about the key developments from a market-oriented perspective.

Primary Research

The automotive ceramics market comprises several stakeholders in the value chain, which include raw material suppliers, manufacturers, and end users. Various primary sources from the supply and demand sides of the automotive ceramics market have been interviewed to obtain qualitative and quantitative information. The primary interviewees from the demand side include key opinion leaders in end-use sectors. The primary sources from the supply side include manufacturers, associations, and institutions involved in the automotive ceramics industry.

Primary interviews were conducted to gather insights such as market statistics, data of revenue collected from the products and services, market breakdowns, market size estimations, market forecasting, and data triangulation. Primary research also helped in understanding the various trends related to material, vehicle type, application, and region. Stakeholders from the demand side, such as CIOs, CTOs, and CSOs were interviewed to understand the buyer’s perspective on the suppliers, products, component providers, and their current usage of automotive ceramics and future outlook of their business which will affect the overall market.

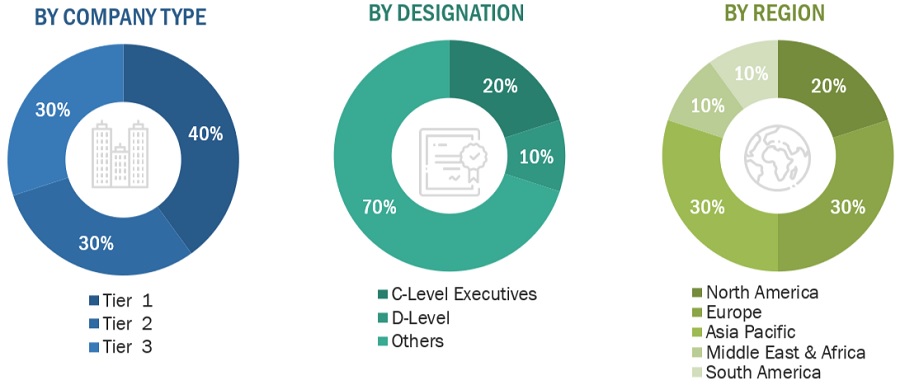
The breakdown of profiles of the primary interviewees is illustrated in the figure below:
Automotive  Ceramics Market Size, and Share

Note: Tier 1, Tier 2, and Tier 3 companies are classified based on their market revenue in 2022 available in the public domain, product portfolios, and geographical presence.

Other designations include sales representatives, production heads, and technicians.

To know about the assumptions considered for the study, download the pdf brochure

Market Size Estimation

The top-down approach was used to estimate and validate the size of various submarkets for automotive ceramics for each region. The research methodology used to estimate the market size included the following steps:

  • The key players in the industry have been identified through extensive secondary research.
  • The supply chain of the industry has been determined through primary and secondary research.
  • The global market was then segmented into five major regions and validated by industry experts.
  • All percentage shares, splits, and breakdowns based on material, vehicle type, application, and country were determined using secondary sources and verified through primary sources.
  • All possible parameters that affect the markets covered in this research study were accounted for, viewed in extensive detail, verified through primary research, and analyzed to get the final quantitative and qualitative data. This data was consolidated and added with detailed inputs and analysis and presented in this report.

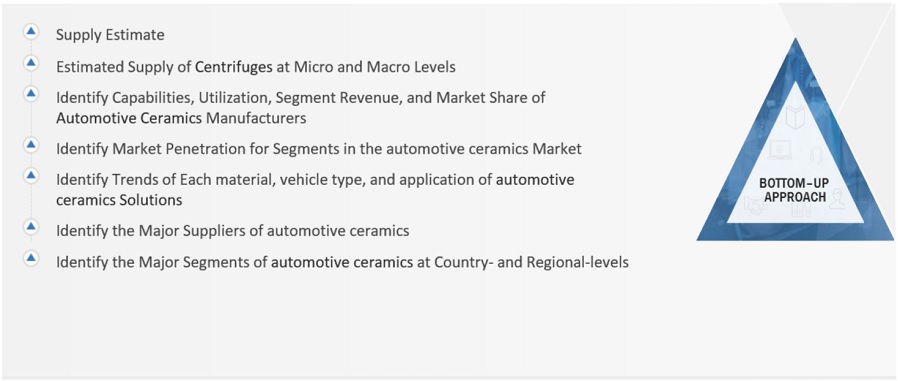
Automotive Ceramics Market: Bottum-Up Approach
Automotive  Ceramics Market Size, and Share

Source: Secondary Research, Interviews with Experts, and MarketsandMarkets Analysis

To know about the assumptions considered for the study, Request for Free Sample Report

Automotive Ceramics Market: Top-Down Approach

Automotive  Ceramics Market Size, and Share

Source: Secondary Research, Interviews with Experts, and MarketsandMarkets Analysis

Data Triangulation

After arriving at the total market size from the estimation process automotive ceramics above, the overall market has been split into several segments and sub-segments. To complete the overall market engineering process and arrive at the exact statistics for all the segments and sub-segments, the data triangulation and market breakdown procedures have been employed, wherever applicable. The data has been triangulated by studying various factors and trends from both the demand and supply sides. Along with this, the market size has been validated by using both the top-down and bottom-up approaches and primary interviews. Hence, for every data segment, there have been three sources—top-down approach, bottom-up approach, and expert interviews. The data was assumed correct when the values arrived from the three sources matched.

Market Definition

Automotive ceramics refer to advanced ceramic materials extensively employed in the manufacturing of various components within the automotive industry. These ceramics, often composed of oxides, nitrides, and carbides, offer exceptional properties such as high strength, thermal resistance, and durability. Their application spans critical areas like engine parts, exhaust systems, braking systems, and automotive electronics. Engine components benefit from ceramics' ability to reduce friction, enhance wear resistance, and optimize thermal stability, thereby improving overall efficiency. In exhaust systems, ceramics play a crucial role in catalytic converters and diesel particulate filters, contributing to emission control. Additionally, the integration of ceramics in automotive electronics ensures enhanced performance and reliability. As the automotive sector evolves towards lightweight, high-performance solutions, automotive ceramics emerge as indispensable materials, addressing the industry's demands for efficiency, sustainability, and regulatory compliance.

Key Stakeholders

  • Automotive Ceramics Manufacturers
  • Automotive ceramics Traders, Distributors, and Suppliers
  • Raw Type Suppliers
  • Government and Private Research Organizations
  • Associations and Industrial Bodies
  • R&D Institutions
  • Environmental Support Agencies

Report Objectives

  • To define, describe, and forecast the size of the automotive ceramics market, in terms of value and volume.
  • To provide detailed information regarding the major factors (drivers, opportunities, restraints, and challenges) influencing the growth of the market.
  • To estimate and forecast the market size based on material, vehicle type, application, and region.
  • To forecast the size of the market with respect to major regions, namely, Europe, North America, Asia Pacific, Middle East & Africa, and South America, along with their key countries.
  • To strategically analyze micromarkets1 with respect to individual growth trends, prospects, and their contribution to the overall market.
  • To analyze opportunities in the market for stakeholders and provide a competitive landscape of market leaders.
  • To track and analyze recent developments such as expansions, new product launches, partnerships & agreements, and acquisitions in the market.
  • To strategically profile key market players and comprehensively analyze their core competencies.

Available Customizations

Along with the given market data, MarketsandMarkets offers customizations according to the company’s specific needs. The following customization options are available for the report:

Regional Analysis

  • Further breakdown of a region with respect to a particular country or additional application

Company Information

  • Detailed analysis and profiles of additional market players

Tariff & Regulations

  • Regulations and impact on automotive ceramics market
Custom Market Research Services

We will customize the research for you, in case the report listed above does not meet with your exact requirements. Our custom research will comprehensively cover the business information you require to help you arrive at strategic and profitable business decisions.

Request Customization
Report Code
CH 5998
Published ON
Mar, 2024
Choose License Type
BUY NOW
  • SHARE
X
Request Customization
Speak to Analyst
Speak to Analyst
OR FACE-TO-FACE MEETING
PERSONALIZE THIS RESEARCH
  • Triangulate with your Own Data
  • Get Data as per your Format and Definition
  • Gain a Deeper Dive on a Specific Application, Geography, Customer or Competitor
  • Any level of Personalization
REQUEST A FREE CUSTOMIZATION
LET US HELP YOU!
  • What are the Known and Unknown Adjacencies Impacting the Automotive Ceramics Market
  • What will your New Revenue Sources be?
  • Who will be your Top Customer; what will make them switch?
  • Defend your Market Share or Win Competitors
  • Get a Scorecard for Target Partners
CUSTOMIZED WORKSHOP REQUEST
+1-888-600-6441
  • Call Us
  • +1-888-600-6441 (Corporate office hours)
  • +1-888-600-6441 (US/Can toll free)
  • +44-800-368-9399 (UK office hours)
CONNECT WITH US
ABOUT TRUST ONLINE
©2024 MarketsandMarkets Research Private Ltd. All rights reserved
DMCA.com Protection Status Website Feedback