Attack Surface Management Market

Attack Surface Management Market by Offering (Solutions, Services), Deployment Mode (Cloud, On-premises), Organization Size (Large Enterprises, SMEs), Vertical (BFSI, Healthcare, Retail & E-Commerce) and Region - Global Forecast to 2029

Report Code: TC 8991 Apr, 2024, by marketsandmarkets.com

The global Attack Surface Management market size was valued at USD 0.9 billion in 2024 and is expected to grow at a CAGR of 29.3% from 2024 to 2029. The revenue forecast for Attack Surface Management industry is projected to reach $3.3 billion by 2029. The base year for estimation is 2023, and the historical data spans from 2024 to 2029.

The core goal of attack surface management (ASM) is enabling organizations to comprehend their entire attack surface comprehensively. Through ongoing identification and monitoring of these potential entry points, organizations can proactively address vulnerabilities, thereby substantially mitigating overall security risks. ASM entails continuously monitoring, remediating, and diminishing all security risks within an organization's attack surface. The ultimate objective of ASM is to keep the attack surface minimal to reduce the number of options hackers have to breach a network perimeter. It is the ongoing process of identifying, analyzing, prioritizing, and mitigating the cybersecurity risks and potential weaknesses that make up an organization's attack surface.

Attack Surface Management Market

To know about the assumptions considered for the study, Request for Free Sample Report

Attack Surface Management Market Opportunities

To know about the assumptions considered for the study, download the pdf brochure

Attack Surface Management Market Dynamics

Driver: Rise in companies’ digital footprints

The burgeoning digital footprint of organizations is a double-edged sword. While unlocking new opportunities and fostering innovation, it simultaneously expands the attack surface – the sum of all possible cyberattack entry points. This includes websites, mobile apps, cloud deployments, social media presences, and the ever-growing Internet of Things (IoT) devices landscape. This exponential growth creates a complex IT environment with numerous blind spots, making it difficult for organizations to keep track of all their assets and identify potential vulnerabilities. A report by Tenable in 2023 found that 25 of India's most prominent companies possessed over 300,000 internet-facing assets. IoT Analytics estimates that over 14.6 billion connected IoT devices will be globally by the end of 2024. According to the ESG Research Report on Security Hygiene and Posture Management, “Nearly seven in ten (69%) organizations admit that they have experienced at least one cyber-attack that started by exploiting an unknown, unmanaged, or poorly managed internet-facing asset. Additionally, organizations with the most IT assets and, subsequently, the most significant attack surfaces were almost twice as likely to experience several of these cyber-attacks.

Attack Surface Management (ASM) is a critical solution in this scenario. By continuously monitoring and visualizing the entire attack surface, ASM tools empower organizations to discover and manage external assets used by remote workforces and shadow IT. This comprehensive view allows for proactively identifying weaknesses that attackers might exploit. Furthermore, ASM solutions stay ahead of the curve by continuously monitoring for evolving threats and newly discovered vulnerabilities, providing organizations with the necessary intelligence to fortify their defenses and keep a step ahead of cybercriminals in today's dynamic digital landscape.

Restraint: Integration and complexity of the environment

A primary restraint in the attack surface management market Attack surface management solutions needs to integrate seamlessly with existing cybersecurity tools and technologies, such as vulnerability scanners, SIEM platforms, and endpoint protection systems. However, integrating disparate systems can be complex and time-consuming, mainly if they use different protocols, data formats, or APIs. Organizations may encounter compatibility issues, data silos, and interoperability challenges when attempting to integrate attack surface management solutions into their existing infrastructure. Many organizations operate in complex and heterogeneous IT environments, consisting of legacy systems, cloud infrastructure, IoT devices, and third-party applications. Managing the attack surface in such environments can be challenging due to the diverse nature of assets, technologies, and configurations. As a result, organizations may need help implementing comprehensive attack surface management solutions that cover all aspects of their infrastructure.

Opportunity: The convergence of ASM with other security capabilities

There is a trend of attack surface management (ASM) converging and potentially merging with other security capabilities. For instance, convergence with Extended Detection and Response (XDR), Both ASM and XDR, aims to provide a holistic view of an organization's security posture. ASM focuses on identifying and managing the attack surface, while XDR focuses on detecting and responding to security incidents across various sources. As technology evolves, these functionalities might become increasingly integrated, offering a single platform for managing attack surfaces and responding to threats. Combining functionalities can streamline security operations and reduce the number of security tools needed, leading to greater efficiency and cost savings. The integration provides a more comprehensive view of the security landscape, providing a clearer picture of potential threats and vulnerabilities across the entire attack surface. CrowdStrike, a leader in cloud-delivered protection of endpoints, cloud workloads, identity, and data, acquired Reposify, which provides an external attack surface management (EASM) platform that scans the internet for exposed assets of an organization to detect and eliminate risk from vulnerable and unknown assets before attackers can exploit them.

Challenges: Balancing security and operational efficiency

Maintaining a resilient and agile organization is essential to balancing security and operational efficiency. While stringent security measures are necessary to protect against cyber threats, they should not impede productivity or hinder innovation. Organizations must balance implementing adequate security controls and enabling employees to perform their tasks efficiently. This may involve adopting user-friendly security solutions, training and awareness programs to educate employees about best practices, and establishing clear policies and procedures for managing security risks. Additionally, integrating security into the development and deployment process can help minimize disruptions and ensure security considerations are embedded throughout the organization's operations.

Attack Surface Management Market Ecosystem

Top Companies in Attack Surface Management Market

By vertical, the BFSI segment is to account for a larger market size during the forecast period.

The financial services industry faces severe cyber threats from handling sensitive data, necessitating robust attack surface management (ASM). Recent ASM developments for BFSI focus on compliance with regulations like PCI DSS and FFIEC, aiding the automation of regulatory processes. Data security enhancements include GDPR and CCPA compliance features, enabling better data protection and discovery. ASM solutions integrate with Cloud Security Posture Management (CSPM) tools for comprehensive cloud security while addressing third-party risk management by assessing vendor attack surfaces and integrating with vendor risk management platforms. Machine learning enhances threat detection, while automation streamlines security operations, bolstering the BFSI sector's resilience against cyber threats.

By Offering the solutions segment to account for a larger market size during the forecast period

The attack surface management (ASM) market is experiencing a surge of innovation as solutions adapt to the complexities of modern IT environments. Recent advancements focus on three key areas: enhanced discovery and inventory, improved vulnerability management, and advanced threat detection and response. ASM solutions now offer agentless discovery and continuous monitoring and prioritize vulnerabilities based on contextual factors. They integrate with vulnerability scanners for a comprehensive view and utilize machine learning for threat detection, automating incident response. Additionally, user behavior analytics help identify insider threats while integration with security tools and automation streamline security operations for businesses.

By deployment mode, the cloud segment to grow at a higher CAGR during the forecast period

As businesses move their operations to the cloud, they need effective cloud-based attack surface management (ASM) solutions. These tools are scalable and flexible, adapting to the growing cloud attack surfaces without requiring hefty initial investments. They seamlessly integrate with cloud-native security tools like Cloud Security Posture Management (CSPM) and Cloud Workload Protection Platforms (CWPP), offering a unified view of security across the cloud environment.

By region, North America will have the largest market size during the forecast period.

North American Attack Surface Management Market Size, and Share

The North American market for Attack Surface Management (ASM) solutions stands out as mature and dominant globally, commanding the largest market share. The North American Attack Surface Management market, encompassing the US and Canada, is rapidly expanding, driven by key industry players offering technology solutions and heightened efforts to enhance online security. The region faces a significant cyberattack threat, with the US reporting the highest data breach costs globally. Businesses are investing in advanced technologies like risk assessment frameworks and threat intelligence platforms to counter rising cyber threats. Government initiatives like CISA in the US and Cyber Secure certification in Canada support cybersecurity efforts. Stringent regulations compel businesses to bolster their defenses, prompting the development of innovative AI and ML tools for risk detection. Collaboration between governments and corporations fosters a more resilient cybersecurity ecosystem, driving market growth.

Key Market Players

Palo Alto Networks (US), IBM (US), Microsoft (US), Cisco (US), Google Cloud (US), Trend Micro (Japan), Qulays (US), Tenable (US), CrowdStrike (US), Rapid7 (US), Bitsight (US), SecurityScorecard (US), CyCognito (US), Bugcrowd (US) are some of the key players operating in the global Attack Surface Management market.

Want to explore hidden markets that can drive new revenue in Attack Surface Management Market?

Scope of the Report

Report Metrics

Details

Market size available for years

2021–2029

Base year considered

2023

Forecast period

2024–2029

Forecast units

Value (USD Million/USD Billion)

Segments Covered

By Offering, By Organization Size, By Deployment mode, By Vertical, and By Region

Geographies covered

North America, Europe, Asia Pacific, Middle East Africa, and Latin America

Major companies covered

Major vendors in the global attack surface management market include Palo Alto Networks (US), IBM (US), Microsoft (US), Cisco (US), Google Cloud (US), Trend Micro (Japan), Qulays (US), Tenable (US), CrowdStrike (US), Rapid7 (US), Bitsight (US), Security Scorecard (US), CyCognito (US), Bugcrowd (US), Panorays (US), Cymulate (US), RecordedFuture (US), BishopFox (US), Cyberint (Israel), HackerOne (US), Hadrian (NL), IONIX (Israel), ImmuniWeb (Switzerland), JupiterOne (US), GroupIB (Singapore), Praetorian (US), Censys (US), Balbix (US), Cyble (US), Armis (US), Upgard (US), and WithSecure (Finland).

The study categorizes the identity verification market by component, type, organization size, deployment mode, application, vertical, and region.

By Offering
  • Solutions
  • Services
By Organization Size
  • Large Enterprises
  • Small and Medium-Sized Enterprises (SMEs)
By Deployment Mode
  • Cloud
  • On-Premises
Vertical
  • BFSI
  • Retail & eCommerce
  • Government & Defense
  • IT & ITeS
  • Energy & Utilities
  • Education
  • Other Verticals
Region
  • North America
  • Europe
  • Asia Pacific
  • Middle East & Africa
  • Latin America

Recent Development

  • In December 2022, Palo Alto Networks launched Cortex Xpanse Active Attack Surface Management (Xpanse Active ASM), offering automated tools for quickly detecting and fixing internet-connected risks. With Active Discovery, Learning, and Response features, Xpanse empowers security teams to take proactive measures against cyber threats, ensuring efficient risk management.
  • In November 2023, Palo Alto Networks acquired Talon Cyber Security, recognized for its Enterprise Browser technology. When integrated with Prisma SASE, this solution safeguards business applications on every device, guaranteeing smooth user interactions while preserving privacy. Following the acquisition, Talon's founders will continue to lead their teams under the Palo Alto Networks umbrella.
  • In June 2022, IBM acquired Randori, a Boston-based company specializing in attack surface management (ASM) and offensive cybersecurity solutions. Randori's technology helps pinpoint and rank vulnerable external-facing assets, which complements IBM's Hybrid Cloud strategy and strengthens its AI-powered cybersecurity offerings. This acquisition demonstrates IBM's dedication to improving cybersecurity capabilities in response to the rising tide of cyber threats.
  • In August 2021, Microsoft acquired RiskIQ, a prominent figure in global threat intelligence and attack surface management. This move aims to strengthen customers' defenses against the constantly evolving landscape of cyber threats. Given the growing dependence on cloud and hybrid environments, RiskIQ's internet visibility and threat intelligence proficiency are expected to enrich Microsoft's security portfolio significantly. By integrating RiskIQ's solutions with Microsoft's cloud-native security tools, customers will have improved capabilities to safeguard their digital assets and mount more efficient responses to cyberattacks.

Frequently Asked Questions (FAQ):

To speak to our analyst for a discussion on the above findings, click Speak to Analyst

Exclusive indicates content/data unique to MarketsandMarkets and not available with any competitors.

INTRODUCTION
26
RESEARCH METHODOLOGY
31
EXECUTIVE SUMMARY
41
PREMIUM INSIGHTS
44
MARKET OVERVIEW AND INDUSTRY TRENDS
47
  • 5.1 INTRODUCTION
  • 5.2 MARKET DYNAMICS
    DRIVERS
    - Rise in companies’ digital footprints
    - Increasing adoption of cloud and SaaS solutions
    - Flourishing landscape of digital ecosystem
    - Rise of ‘remote work’ model
    RESTRAINTS
    - Integration and complexity of environment
    - Lack of awareness regarding benefits of attack surface management solutions
    OPPORTUNITIES
    - Convergence of ASM with other security capabilities
    - Smart automation in ASM leveraging AI and ML
    - Demand for merging cloud-native application platforms (CNAPPs) with attack surface management solutions
    CHALLENGES
    - Balancing security and operational efficiency
    - Complexities involved in vendor overload and resource allocation
  • 5.3 CASE STUDY ANALYSIS
    LIONBRIDGE EMBRACED RANDORI RECON TO GAIN REAL-TIME VISIBILITY INTO ITS EXTERNAL RISK POSTURE
    TREND MICRO’S CONFORMITY PROVIDED XSOLIS WITH COMPREHENSIVE VISIBILITY AND REAL-TIME MONITORING OF ITS CLOUD SERVICE CONFIGURATIONS
    SHONAN FUJISAWA ADOPTED TENABLE’S ATTACK SURFACE MANAGEMENT SOLUTION TO ACHIEVE RISK MANAGEMENT
    CENSYS HELPED SWISS LIFE ACHIEVE COMPREHENSIVE ASSET VISIBILITY AND ENHANCED CYBERSECURITY MANAGEMENT
  • 5.4 VALUE CHAIN ANALYSIS
    COMPONENT PROVIDERS
    PLANNING & DESIGNING
    INFRASTRUCTURE DEPLOYMENT
    SYSTEM INTEGRATION
    END-USER VERTICALS
  • 5.5 ECOSYSTEM/MARKET MAP
  • 5.6 PORTER’S FIVE FORCES ANALYSIS
    THREAT OF NEW ENTRANTS
    BARGAINING POWER OF SUPPLIERS
    BARGAINING POWER OF BUYERS
    THREAT OF SUBSTITUTES
    INTENSITY OF COMPETITIVE RIVALRY
  • 5.7 PRICING ANALYSIS
    AVERAGE SELLING PRICE TREND OF KEY PLAYERS, BY OFFERING
    INDICATIVE PRICING ANALYSIS, BY SOLUTION
  • 5.8 TECHNOLOGY ANALYSIS
    KEY TECHNOLOGIES
    - Artificial intelligence (AI) and machine learning (ML)
    COMPLIMENTARY TECHNOLOGIES
    - Cloud computing
    - Big data and analytics
    ADJACENT TECHNOLOGIES
    - Blockchain
    - IoT
  • 5.9 PATENT ANALYSIS
    LIST OF MAJOR PATENTS GRANTED, 2021–2023
  • 5.10 TRENDS/DISRUPTIONS IMPACTING CUSTOMERS’ BUSINESSES
  • 5.11 REGULATORY LANDSCAPE
    REGULATORY BODIES, GOVERNMENT AGENCIES, AND OTHER ORGANIZATIONS
  • 5.12 KEY STAKEHOLDERS AND BUYING CRITERIA
    KEY STAKEHOLDERS IN BUYING PROCESS
    BUYING CRITERIA
  • 5.13 KEY CONFERENCES & EVENTS
  • 5.14 INVESTMENT AND FUNDING SCENARIO
  • 5.15 ENHANCING CYBERSECURITY WITH EFFECTIVE ATTACK SURFACE MANAGEMENT: STRATEGIES AND BEST PRACTICES
    CONTINUOUS DISCOVERY & INVENTORY
    THREAT DETECTION & RESPONSE
    CONTINUOUS MONITORING & THREAT HUNTING
    PATCH MANAGEMENT
    CONFIGURATION MANAGEMENT
    ACCESS CONTROL
    EMPLOYEE TRAINING & AWARENESS
    NETWORK SEGMENTATION FOR ENHANCED SECURITY
ATTACK SURFACE MANAGEMENT MARKET, BY OFFERING
77
  • 6.1 INTRODUCTION
    OFFERINGS: ATTACK SURFACE MANAGEMENT MARKET DRIVERS
  • 6.2 SOLUTIONS
    RISING NEED TO SECURE ATTACK SURFACES TO DRIVE MARKET
  • 6.3 SERVICES
    NEED FOR ORGANIZATIONS TO SEEK GUIDANCE AND ASSISTANCE TO DRIVE FOCUS ON ATTACK SURFACE MANAGEMENT SOLUTIONS
ATTACK SURFACE MANAGEMENT MARKET, BY ORGANIZATION SIZE
81
  • 7.1 INTRODUCTION
    ORGANIZATION SIZES: ATTACK SURFACE MANAGEMENT MARKET DRIVERS
  • 7.2 LARGE ENTERPRISES
    NEED TO MANAGE EXPANSIVE ATTACK SURFACE AND ADDRESS COMPLEXITY IN IT INFRASTRUCTURE TO BOOST GROWTH
  • 7.3 SMALL AND MEDIUM ENTERPRISES (SMES)
    EMPHASIS ON RECOGNIZING IMPORTANCE OF ROBUST ATTACK SURFACE MANAGEMENT TO SPUR MARKET
ATTACK SURFACE MANAGEMENT MARKET, BY DEPLOYMENT MODE
86
  • 8.1 INTRODUCTION
    DEPLOYMENT MODES: ATTACK SURFACE MANAGEMENT MARKET DRIVERS
  • 8.2 ON-PREMISES
    DEMAND FOR ROBUST SOLUTIONS FOR ORGANIZATIONS PRIORITIZING CONTROL OVER DATA TO DRIVE GROWTH
  • 8.3 CLOUD
    CLOUD-BASED ATTACK SURFACE MANAGEMENT SOLUTIONS OFFER AGILE SECURITY AND SCALABLE PROTECTION
ATTACK SURFACE MANAGEMENT MARKET, BY VERTICAL
91
  • 9.1 INTRODUCTION
    VERTICALS: ATTACK SURFACE MANAGEMENT MARKET DRIVERS
  • 9.2 BFSI (BANKING, FINANCIAL SERVICES, AND INSURANCE)
    GROWING NEED TO STREAMLINE OPERATIONS AND COMBAT EVOLVING CYBER THREATS TO DRIVE MARKET
  • 9.3 HEALTHCARE
    FOCUS ON SAFEGUARDING PATIENT-SENSITIVE DATA TO DRIVE ATTACK SURFACE MANAGEMENT MARKET
  • 9.4 RETAIL & COMMERCE
    INCREASING USE OF ONLINE PLATFORMS, PAYMENT SYSTEMS, AND CONNECTED DEVICES TO BOOST GROWTH
  • 9.5 GOVERNMENT
    RISING NEED TO MANAGE CONFIDENTIAL INFORMATION AND SECURE CRITICAL INFRASTRUCTURE TO SPUR DEMAND
  • 9.6 ENERGY & UTILITIES
    NEED TO SAFEGUARD CRITICAL INFRASTRUCTURE, SUCH AS POWER GRIDS, TO MITIGATE SECURITY RISKS TO PROPEL MARKET
  • 9.7 IT & ITES
    FOCUS ON HANDLING SENSITIVE DATA AND INTERCONNECTED SYSTEMS TO ENCOURAGE MARKET EXPANSION
  • 9.8 OTHER VERTICALS
ATTACK SURFACE MANAGEMENT MARKET, BY REGION
100
  • 10.1 INTRODUCTION
  • 10.2 NORTH AMERICA
    NORTH AMERICA: ATTACK SURFACE MANAGEMENT MARKET DRIVERS
    NORTH AMERICA: RECESSION IMPACT
    NORTH AMERICA: REGULATORY LANDSCAPE
    US
    - Rapid technological innovations, rising cyber threats, and strategic cybersecurity initiatives to drive market
    CANADA
    - Increased cyberattacks and government cybersecurity initiatives to propel demand
  • 10.3 EUROPE
    EUROPE: ATTACK SURFACE MANAGEMENT MARKET DRIVERS
    EUROPE: RECESSION IMPACT
    EUROPE: REGULATORY LANDSCAPE
    UK
    - Digital transformation, government cybersecurity initiatives, and advanced cybersecurity to boost market
    GERMANY
    - Rapid digitalization and adoption of advanced cybersecurity frameworks to propel growth
    ITALY
    - Rising incidents of cybercrime, government cyber resilience efforts, and private sector engagement to encourage market expansion
    REST OF EUROPE
  • 10.4 ASIA PACIFIC
    ASIA PACIFIC: ATTACK SURFACE MANAGEMENT MARKET DRIVERS
    ASIA PACIFIC: RECESSION IMPACT
    ASIA PACIFIC: REGULATORY LANDSCAPE
    CHINA
    - Emphasis on cybersecurity amidst rising hacking threats and legislative developments to spur market growth
    JAPAN
    - Digitalization challenges and proactive cybersecurity enhancements to drive demand for attack surface management solutions
    INDIA
    - Cybersecurity policy updates, increasing cyber threat complexity, and proactive cyber defense initiatives to boost growth
    REST OF ASIA PACIFIC
  • 10.5 MIDDLE EAST & AFRICA
    MIDDLE EAST & AFRICA: ATTACK SURFACE MANAGEMENT MARKET DRIVERS
    MIDDLE EAST & AFRICA: RECESSION IMPACT
    MIDDLE EAST & AFRICA: REGULATORY LANDSCAPE
    GULF COOPERATION COUNCIL (GCC)
    - KSA
    - UAE
    - Rest of GCC countries
    SOUTH AFRICA
    - Financial sector’s security concerns to compel adoption of attack surface solutions and services
    REST OF MIDDLE EAST & AFRICA
  • 10.6 LATIN AMERICA
    LATIN AMERICA: ATTACK SURFACE MANAGEMENT MARKET DRIVERS
    LATIN AMERICA: RECESSION IMPACT
    LATIN AMERICA: REGULATORY LANDSCAPE
    BRAZIL
    - Government investment, data protection legislation, and innovative partnerships to spur market expansion
    MEXICO
    - Rising digitalization and increase in cybercriminal activities to persuade governments and organizations to adopt attack surface solutions
    REST OF LATIN AMERICA
COMPETITIVE LANDSCAPE
154
  • 11.1 OVERVIEW
  • 11.2 KEY PLAYERS’ STRATEGIES/RIGHT TO WIN
  • 11.3 HISTORICAL REVENUE ANALYSIS
  • 11.4 VALUATION AND FINANCIAL METRICS OF KEY ATTACK SURFACE MANAGEMENT VENDORS
  • 11.5 MARKET SHARE ANALYSIS
  • 11.6 PRODUCT/BRAND COMPARISON
  • 11.7 COMPANY EVALUATION MATRIX: KEY PLAYERS
    STARS
    EMERGING LEADERS
    PERVASIVE PLAYERS
    PARTICIPANTS
    COMPANY FOOTPRINT
  • 11.8 COMPANY EVALUATION MATRIX: STARTUPS/SMES
    PROGRESSIVE COMPANIES
    RESPONSIVE COMPANIES
    DYNAMIC COMPANIES
    STARTING BLOCKS
    COMPETITIVE BENCHMARKING
    - Detailed list of key startups/SMEs
    - Competitive benchmarking of key startups/SMEs
  • 11.9 COMPETITIVE SCENARIO AND TRENDS
    PRODUCT LAUNCHES
    DEALS
COMPANY PROFILES
174
  • 12.1 KEY PLAYERS
    PALO ALTO NETWORKS
    - Business overview
    - Products/Solutions/Services offered
    - Recent developments
    - MnM view
    IBM
    - Business overview
    - Products/Solutions/Services offered
    - Recent developments
    - MnM view
    MICROSOFT
    - Business overview
    - Products/Solutions/Services offered
    - Recent developments
    - MnM view
    CISCO
    - Business overview
    - Products/Solutions/Services offered
    - MnM view
    GOOGLE
    - Business overview
    - Products/Solutions/Services offered
    - Recent developments
    - MnM view
    TREND MICRO
    - Business overview
    - Products/Solutions/Services offered
    - Recent developments
    QUALYS
    - Business overview
    - Products/Solutions/Services offered
    TENABLE
    - Business overview
    - Products/Solutions/Services offered
    - Recent developments
    CROWDSTRIKE
    - Business overview
    - Products/Solutions/Services offered
    - Recent developments
    RAPID7
    - Business overview
    - Products/Solutions/Services offered
    BITSIGHT
    - Business overview
    - Products/Solutions/Services offered
    SECURITYSCORECARD
    - Business overview
    - Products/Solutions/Services offered
    CYCOGNITO
    - Business overview
    - Products/Solutions/Services offered
    - Recent developments
    BUGCROWD
    - Business overview
    - Products/Solutions/Services offered
    - Recent developments
  • 12.2 OTHER PLAYERS
    PANORAYS
    CYMULATE
    RECORDED FUTURE
    BISHOP FOX
    CYBERINT
    HACKERONE
    HADRIAN
    IONIX
    IMMUNIWEB
    JUPITERONE
    GROUP-IB
    WATCHGUARD
    CENSYS
    BALBIX
    CYBLE
    UPGUARD
    WITHSECURE
    ARMIS
ADJACENT MARKETS
220
  • 13.1 INTRODUCTION
  • 13.2 LIMITATIONS
  • 13.3 SECURITY AND VULNERABILITY MANAGEMENT MARKET
    INCLUSIONS AND EXCLUSIONS
  • 13.4 SECURITY INFORMATION AND EVENT MANAGEMENT (SIEM) MARKET
    INCLUSIONS AND EXCLUSIONS
APPENDIX
229
  • 14.1 DISCUSSION GUIDE
  • 14.2 KNOWLEDGESTORE: MARKETSANDMARKETS’ SUBSCRIPTION PORTAL
  • 14.3 CUSTOMIZATION OPTIONS
  • 14.4 RELATED REPORTS
  • 14.5 AUTHOR DETAILS
LIST OF TABLES
 
  • TABLE 1 USD EXCHANGE RATES, 2019–2023
  • TABLE 2 FACTOR ANALYSIS
  • TABLE 3 ATTACK SURFACE MANAGEMENT MARKET AND GROWTH RATE, 2021–2029 (USD MILLION, Y-O-Y)
  • TABLE 4 ATTACK SURFACE MANAGEMENT MARKET: ECOSYSTEM
  • TABLE 5 PORTER’S FIVE FORCES’ IMPACT ON ATTACK SURFACE MANAGEMENT MARKET
  • TABLE 6 AVERAGE SELLING PRICE TREND OF KEY PLAYERS, BY OFFERING
  • TABLE 7 INDICATIVE PRICING LEVELS OF ATTACK SURFACE MANAGEMENT SOLUTIONS
  • TABLE 8 NORTH AMERICA: LIST OF REGULATORY BODIES, GOVERNMENT AGENCIES, AND OTHER ORGANIZATIONS
  • TABLE 9 EUROPE: LIST OF REGULATORY BODIES, GOVERNMENT AGENCIES, AND OTHER ORGANIZATIONS
  • TABLE 10 ASIA PACIFIC: LIST OF REGULATORY BODIES, GOVERNMENT AGENCIES, AND OTHER ORGANIZATIONS
  • TABLE 11 MIDDLE EAST & AFRICA: LIST OF REGULATORY BODIES, GOVERNMENT AGENCIES, AND OTHER ORGANIZATIONS
  • TABLE 12 LATIN AMERICA: LIST OF REGULATORY BODIES, GOVERNMENT AGENCIES, AND OTHER ORGANIZATIONS
  • TABLE 13 INFLUENCE OF STAKEHOLDERS ON BUYING PROCESS FOR TOP THREE VERTICALS
  • TABLE 14 KEY BUYING CRITERIA FOR TOP THREE VERTICALS
  • TABLE 15 LIST OF CONFERENCES & EVENTS, 2023–2024
  • TABLE 16 ATTACK SURFACE MANAGEMENT MARKET, BY OFFERING, 2021–2029 (USD MILLION)
  • TABLE 17 ATTACK SURFACE MANAGEMENT SOLUTIONS MARKET, BY REGION, 2021–2029 (USD MILLION)
  • TABLE 18 ATTACK SURFACE MANAGEMENT SERVICES MARKET, BY REGION, 2021–2029 (USD MILLION)
  • TABLE 19 ATTACK SURFACE MANAGEMENT MARKET, BY ORGANIZATION SIZE, 2021–2029 (USD MILLION)
  • TABLE 20 LARGE ENTERPRISES: ATTACK SURFACE MANAGEMENT MARKET, BY REGION, 2021–2029 (USD MILLION)
  • TABLE 21 SMES: ATTACK SURFACE MANAGEMENT MARKET, BY REGION, 2021–2029 (USD MILLION)
  • TABLE 22 ATTACK SURFACE MANAGEMENT MARKET, BY DEPLOYMENT MODE, 2021–2029 (USD MILLION)
  • TABLE 23 ON-PREMISES: ATTACK SURFACE MANAGEMENT MARKET, BY REGION, 2021–2029 (USD MILLION)
  • TABLE 24 CLOUD: ATTACK SURFACE MANAGEMENT MARKET, BY REGION, 2021–2029 (USD MILLION)
  • TABLE 25 ATTACK SURFACE MANAGEMENT MARKET, BY VERTICAL, 2021–2029 (USD MILLION)
  • TABLE 26 BFSI: ATTACK SURFACE MANAGEMENT MARKET, BY REGION, 2021–2029 (USD MILLION)
  • TABLE 27 HEALTHCARE: ATTACK SURFACE MANAGEMENT MARKET, BY REGION, 2021–2029 (USD MILLION)
  • TABLE 28 RETAIL & ECOMMERCE: ATTACK SURFACE MANAGEMENT MARKET, BY REGION, 2021–2029 (USD MILLION)
  • TABLE 29 GOVERNMENT: ATTACK SURFACE MANAGEMENT MARKET, BY REGION, 2021–2029 (USD MILLION)
  • TABLE 30 ENERGY & UTILITIES: ATTACK SURFACE MANAGEMENT MARKET, BY REGION, 2021–2029 (USD MILLION)
  • TABLE 31 IT & ITES: ATTACK SURFACE MANAGEMENT MARKET, BY REGION, 2021–2029 (USD MILLION)
  • TABLE 32 OTHER VERTICALS: ATTACK SURFACE MANAGEMENT MARKET, BY REGION, 2021–2029 (USD MILLION)
  • TABLE 33 ATTACK SURFACE MANAGEMENT MARKET, BY REGION, 2021–2029 (USD MILLION)
  • TABLE 34 NORTH AMERICA: ATTACK SURFACE MANAGEMENT MARKET, BY OFFERING, 2021–2029 (USD MILLION)
  • TABLE 35 NORTH AMERICA: ATTACK SURFACE MANAGEMENT MARKET, BY DEPLOYMENT MODE, 2021–2029 (USD MILLION)
  • TABLE 36 NORTH AMERICA: ATTACK SURFACE MANAGEMENT MARKET, BY ORGANIZATION SIZE, 2021–2029 (USD MILLION)
  • TABLE 37 NORTH AMERICA: ATTACK SURFACE MANAGEMENT MARKET, BY VERTICAL, 2021–2029 (USD MILLION)
  • TABLE 38 NORTH AMERICA: ATTACK SURFACE MANAGEMENT MARKET, BY COUNTRY, 2021–2029 (USD MILLION)
  • TABLE 39 US: ATTACK SURFACE MANAGEMENT MARKET, BY OFFERING, 2021–2029 (USD MILLION)
  • TABLE 40 US: ATTACK SURFACE MANAGEMENT MARKET, BY DEPLOYMENT MODE, 2021–2029 (USD MILLION)
  • TABLE 41 US: ATTACK SURFACE MANAGEMENT MARKET, BY ORGANIZATION SIZE, 2021–2029 (USD MILLION)
  • TABLE 42 US: ATTACK SURFACE MANAGEMENT MARKET, BY VERTICAL, 2021–2029 (USD MILLION)
  • TABLE 43 CANADA: ATTACK SURFACE MANAGEMENT MARKET, BY OFFERING, 2021–2029 (USD MILLION)
  • TABLE 44 CANADA: ATTACK SURFACE MANAGEMENT MARKET, BY DEPLOYMENT MODE, 2021–2029 (USD MILLION)
  • TABLE 45 CANADA: ATTACK SURFACE MANAGEMENT MARKET, BY ORGANIZATION SIZE, 2021–2029 (USD MILLION)
  • TABLE 46 CANADA: ATTACK SURFACE MANAGEMENT MARKET, BY VERTICAL, 2021–2029 (USD MILLION)
  • TABLE 47 EUROPE: ATTACK SURFACE MANAGEMENT MARKET, BY OFFERING, 2021–2029 (USD MILLION)
  • TABLE 48 EUROPE: ATTACK SURFACE MANAGEMENT MARKET, BY DEPLOYMENT MODE, 2021–2029 (USD MILLION)
  • TABLE 49 EUROPE: ATTACK SURFACE MANAGEMENT MARKET, BY ORGANIZATION SIZE, 2021–2029 (USD MILLION)
  • TABLE 50 EUROPE: ATTACK SURFACE MANAGEMENT MARKET, BY VERTICAL, 2021–2029 (USD MILLION)
  • TABLE 51 EUROPE: ATTACK SURFACE MANAGEMENT MARKET, BY COUNTRY, 2021–2029 (USD MILLION)
  • TABLE 52 UK: ATTACK SURFACE MANAGEMENT MARKET, BY OFFERING, 2021–2029 (USD MILLION)
  • TABLE 53 UK: ATTACK SURFACE MANAGEMENT MARKET, BY DEPLOYMENT MODE, 2021–2029 (USD MILLION)
  • TABLE 54 UK: ATTACK SURFACE MANAGEMENT MARKET, BY ORGANIZATION SIZE, 2021–2029 (USD MILLION)
  • TABLE 55 UK: ATTACK SURFACE MANAGEMENT MARKET, BY VERTICAL, 2021–2029 (USD MILLION)
  • TABLE 56 GERMANY: ATTACK SURFACE MANAGEMENT MARKET, BY OFFERING, 2021–2029 (USD MILLION)
  • TABLE 57 GERMANY: ATTACK SURFACE MANAGEMENT MARKET, BY DEPLOYMENT MODE, 2021–2029 (USD MILLION)
  • TABLE 58 GERMANY: ATTACK SURFACE MANAGEMENT MARKET, BY ORGANIZATION SIZE, 2021–2029 (USD MILLION)
  • TABLE 59 GERMANY: ATTACK SURFACE MANAGEMENT MARKET, BY VERTICAL, 2021–2029 (USD MILLION)
  • TABLE 60 ITALY: ATTACK SURFACE MANAGEMENT MARKET, BY OFFERING, 2021–2029 (USD MILLION)
  • TABLE 61 ITALY: ATTACK SURFACE MANAGEMENT MARKET, BY DEPLOYMENT MODE, 2021–2029 (USD MILLION)
  • TABLE 62 ITALY: ATTACK SURFACE MANAGEMENT MARKET, BY ORGANIZATION SIZE, 2021–2029 (USD MILLION)
  • TABLE 63 ITALY: ATTACK SURFACE MANAGEMENT MARKET, BY VERTICAL, 2021–2029 (USD MILLION)
  • TABLE 64 REST OF EUROPE: ATTACK SURFACE MANAGEMENT MARKET, BY OFFERING, 2021–2029 (USD MILLION)
  • TABLE 65 REST OF EUROPE: ATTACK SURFACE MANAGEMENT MARKET, BY DEPLOYMENT MODE, 2021–2029 (USD MILLION)
  • TABLE 66 REST OF EUROPE: ATTACK SURFACE MANAGEMENT MARKET, BY ORGANIZATION SIZE, 2021–2029 (USD MILLION)
  • TABLE 67 REST OF EUROPE: ATTACK SURFACE MANAGEMENT MARKET, BY VERTICAL, 2021–2029 (USD MILLION)
  • TABLE 68 ASIA PACIFIC: ATTACK SURFACE MANAGEMENT MARKET, BY OFFERING, 2021–2029 (USD MILLION)
  • TABLE 69 ASIA PACIFIC: ATTACK SURFACE MANAGEMENT MARKET, BY DEPLOYMENT MODE, 2021–2029 (USD MILLION)
  • TABLE 70 ASIA PACIFIC: ATTACK SURFACE MANAGEMENT MARKET, BY ORGANIZATION SIZE, 2021–2029 (USD MILLION)
  • TABLE 71 ASIA PACIFIC: ATTACK SURFACE MANAGEMENT MARKET, BY VERTICAL, 2021–2029 (USD MILLION)
  • TABLE 72 ASIA PACIFIC: ATTACK SURFACE MANAGEMENT MARKET, BY COUNTRY, 2021–2029 (USD MILLION)
  • TABLE 73 CHINA: ATTACK SURFACE MANAGEMENT MARKET, BY OFFERING, 2021–2029 (USD MILLION)
  • TABLE 74 CHINA: ATTACK SURFACE MANAGEMENT MARKET, BY DEPLOYMENT MODE, 2021–2029 (USD MILLION)
  • TABLE 75 CHINA: ATTACK SURFACE MANAGEMENT MARKET, BY ORGANIZATION SIZE, 2021–2029 (USD MILLION)
  • TABLE 76 CHINA: ATTACK SURFACE MANAGEMENT MARKET, BY VERTICAL, 2021–2029 (USD MILLION)
  • TABLE 77 JAPAN: ATTACK SURFACE MANAGEMENT MARKET, BY OFFERING, 2021–2029 (USD MILLION)
  • TABLE 78 JAPAN: ATTACK SURFACE MANAGEMENT MARKET, BY DEPLOYMENT MODE, 2021–2029 (USD MILLION)
  • TABLE 79 JAPAN: ATTACK SURFACE MANAGEMENT MARKET, BY ORGANIZATION SIZE, 2021–2029 (USD MILLION)
  • TABLE 80 JAPAN: ATTACK SURFACE MANAGEMENT MARKET, BY VERTICAL, 2021–2029 (USD MILLION)
  • TABLE 81 INDIA: ATTACK SURFACE MANAGEMENT MARKET, BY OFFERING, 2021–2029 (USD MILLION)
  • TABLE 82 INDIA: ATTACK SURFACE MANAGEMENT MARKET, BY DEPLOYMENT MODE, 2021–2029 (USD MILLION)
  • TABLE 83 INDIA: ATTACK SURFACE MANAGEMENT MARKET, BY ORGANIZATION SIZE, 2021–2029 (USD MILLION)
  • TABLE 84 INDIA: ATTACK SURFACE MANAGEMENT MARKET, BY VERTICAL, 2021–2029 (USD MILLION)
  • TABLE 85 REST OF ASIA PACIFIC: ATTACK SURFACE MANAGEMENT MARKET, BY OFFERING, 2021–2029 (USD MILLION)
  • TABLE 86 REST OF ASIA PACIFIC: ATTACK SURFACE MANAGEMENT MARKET, BY DEPLOYMENT MODE, 2021–2029 (USD MILLION)
  • TABLE 87 REST OF ASIA PACIFIC: ATTACK SURFACE MANAGEMENT MARKET, BY ORGANIZATION SIZE, 2021–2029 (USD MILLION)
  • TABLE 88 REST OF ASIA PACIFIC: ATTACK SURFACE MANAGEMENT MARKET, BY VERTICAL, 2021–2029 (USD MILLION)
  • TABLE 89 MIDDLE EAST & AFRICA: ATTACK SURFACE MANAGEMENT MARKET, BY OFFERING, 2021–2029 (USD MILLION)
  • TABLE 90 MIDDLE EAST & AFRICA: ATTACK SURFACE MANAGEMENT MARKET, BY DEPLOYMENT MODE, 2021–2029 (USD MILLION)
  • TABLE 91 MIDDLE EAST & AFRICA: ATTACK SURFACE MANAGEMENT MARKET, BY ORGANIZATION SIZE, 2021–2029 (USD MILLION)
  • TABLE 92 MIDDLE EAST & AFRICA: ATTACK SURFACE MANAGEMENT MARKET, BY VERTICAL, 2021–2029 (USD MILLION)
  • TABLE 93 MIDDLE EAST & AFRICA: ATTACK SURFACE MANAGEMENT MARKET, BY COUNTRY, 2021–2029 (USD MILLION)
  • TABLE 94 GCC: ATTACK SURFACE MANAGEMENT MARKET, BY OFFERING, 2021–2029 (USD MILLION)
  • TABLE 95 GCC: ATTACK SURFACE MANAGEMENT MARKET, BY DEPLOYMENT MODE, 2021–2029 (USD MILLION)
  • TABLE 96 GCC: ATTACK SURFACE MANAGEMENT MARKET, BY ORGANIZATION SIZE, 2021–2029 (USD MILLION)
  • TABLE 97 GCC: ATTACK SURFACE MANAGEMENT MARKET, BY VERTICAL, 2021–2029 (USD MILLION)
  • TABLE 98 GCC: ATTACK SURFACE MANAGEMENT MARKET, BY COUNTRY, 2021–2029 (USD MILLION)
  • TABLE 99 KSA: ATTACK SURFACE MANAGEMENT MARKET, BY OFFERING, 2021–2029 (USD MILLION)
  • TABLE 100 KSA: ATTACK SURFACE MANAGEMENT MARKET, BY DEPLOYMENT MODE, 2021–2029 (USD MILLION)
  • TABLE 101 KSA: ATTACK SURFACE MANAGEMENT MARKET, BY ORGANIZATION SIZE, 2021–2029 (USD MILLION)
  • TABLE 102 KSA: ATTACK SURFACE MANAGEMENT MARKET, BY VERTICAL, 2021–2029 (USD MILLION)
  • TABLE 103 UAE: ATTACK SURFACE MANAGEMENT MARKET, BY OFFERING, 2021–2029 (USD MILLION)
  • TABLE 104 UAE: ATTACK SURFACE MANAGEMENT MARKET, BY DEPLOYMENT MODE, 2021–2029 (USD MILLION)
  • TABLE 105 UAE: ATTACK SURFACE MANAGEMENT MARKET, BY ORGANIZATION SIZE, 2021–2029 (USD MILLION)
  • TABLE 106 UAE: ATTACK SURFACE MANAGEMENT MARKET, BY VERTICAL, 2021–2029 (USD MILLION)
  • TABLE 107 REST OF GCC COUNTRIES: ATTACK SURFACE MANAGEMENT MARKET, BY OFFERING, 2021–2029 (USD MILLION)
  • TABLE 108 REST OF GCC COUNTRIES: ATTACK SURFACE MANAGEMENT MARKET, BY DEPLOYMENT MODE, 2021–2029 (USD MILLION)
  • TABLE 109 REST OF GCC COUNTRIES: ATTACK SURFACE MANAGEMENT MARKET, BY ORGANIZATION SIZE, 2021–2029 (USD MILLION)
  • TABLE 110 REST OF GCC COUNTRIES: ATTACK SURFACE MANAGEMENT MARKET, BY VERTICAL, 2021–2029 (USD MILLION)
  • TABLE 111 SOUTH AFRICA: ATTACK SURFACE MANAGEMENT MARKET, BY OFFERING, 2021–2029 (USD MILLION)
  • TABLE 112 SOUTH AFRICA: ATTACK SURFACE MANAGEMENT MARKET, BY DEPLOYMENT MODE, 2021–2029 (USD MILLION)
  • TABLE 113 SOUTH AFRICA: ATTACK SURFACE MANAGEMENT MARKET, BY ORGANIZATION SIZE, 2021–2029 (USD MILLION)
  • TABLE 114 SOUTH AFRICA: ATTACK SURFACE MANAGEMENT MARKET, BY VERTICAL, 2021–2029 (USD MILLION)
  • TABLE 115 REST OF MIDDLE EAST & AFRICA: ATTACK SURFACE MANAGEMENT MARKET, BY OFFERING, 2021–2029 (USD MILLION)
  • TABLE 116 REST OF MIDDLE EAST & AFRICA: ATTACK SURFACE MANAGEMENT MARKET, BY DEPLOYMENT MODE, 2021–2029 (USD MILLION)
  • TABLE 117 REST OF MIDDLE EAST & AFRICA: ATTACK SURFACE MANAGEMENT MARKET, BY ORGANIZATION SIZE, 2021–2029 (USD MILLION)
  • TABLE 118 REST OF MIDDLE EAST & AFRICA: ATTACK SURFACE MANAGEMENT MARKET, BY VERTICAL, 2021–2029 (USD MILLION)
  • TABLE 119 LATIN AMERICA: ATTACK SURFACE MANAGEMENT MARKET, BY OFFERING, 2021–2029 (USD MILLION)
  • TABLE 120 LATIN AMERICA: ATTACK SURFACE MANAGEMENT MARKET, BY DEPLOYMENT MODE, 2021–2029 (USD MILLION)
  • TABLE 121 LATIN AMERICA: ATTACK SURFACE MANAGEMENT MARKET, BY ORGANIZATION SIZE, 2021–2029 (USD MILLION)
  • TABLE 122 LATIN AMERICA: ATTACK SURFACE MANAGEMENT MARKET, BY VERTICAL, 2021–2029 (USD MILLION)
  • TABLE 123 LATIN AMERICA: ATTACK SURFACE MANAGEMENT MARKET, BY COUNTRY, 2021–2029 (USD MILLION)
  • TABLE 124 BRAZIL: ATTACK SURFACE MANAGEMENT MARKET, BY OFFERING, 2021–2029 (USD MILLION)
  • TABLE 125 BRAZIL: ATTACK SURFACE MANAGEMENT MARKET, BY DEPLOYMENT MODE, 2021–2029 (USD MILLION)
  • TABLE 126 BRAZIL: ATTACK SURFACE MANAGEMENT MARKET, BY ORGANIZATION SIZE, 2021–2029 (USD MILLION)
  • TABLE 127 BRAZIL: ATTACK SURFACE MANAGEMENT MARKET, BY VERTICAL, 2021–2029 (USD MILLION)
  • TABLE 128 MEXICO: ATTACK SURFACE MANAGEMENT MARKET, BY OFFERING, 2021–2029 (USD MILLION)
  • TABLE 129 MEXICO: ATTACK SURFACE MANAGEMENT MARKET, BY DEPLOYMENT MODE, 2021–2029 (USD MILLION)
  • TABLE 130 MEXICO: ATTACK SURFACE MANAGEMENT MARKET, BY ORGANIZATION SIZE, 2021–2029 (USD MILLION)
  • TABLE 131 MEXICO: ATTACK SURFACE MANAGEMENT MARKET, BY VERTICAL, 2021–2029 (USD MILLION)
  • TABLE 132 REST OF LATIN AMERICA: ATTACK SURFACE MANAGEMENT MARKET, BY OFFERING, 2021–2029 (USD MILLION)
  • TABLE 133 REST OF LATIN AMERICA: ATTACK SURFACE MANAGEMENT MARKET, BY DEPLOYMENT MODE, 2021–2029 (USD MILLION)
  • TABLE 134 REST OF LATIN AMERICA: ATTACK SURFACE MANAGEMENT MARKET, BY ORGANIZATION SIZE, 2021–2029 (USD MILLION)
  • TABLE 135 REST OF LATIN AMERICA: ATTACK SURFACE MANAGEMENT MARKET, BY VERTICAL, 2021–2029 (USD MILLION)
  • TABLE 136 OVERVIEW OF STRATEGIES ADOPTED BY KEY ATTACK SURFACE MANAGEMENT VENDORS
  • TABLE 137 ATTACK SURFACE MANAGEMENT MARKET: DEGREE OF COMPETITION
  • TABLE 138 ATTACK SURFACE MANAGEMENT MARKET: COMPANY OFFERING FOOTPRINT
  • TABLE 139 ATTACK SURFACE MANAGEMENT MARKET: COMPANY ORGANIZATION SIZE FOOTPRINT
  • TABLE 140 ATTACK SURFACE MANAGEMENT MARKET: COMPANY VERTICAL FOOTPRINT
  • TABLE 141 ATTACK SURFACE MANAGEMENT MARKET: COMPANY REGIONAL FOOTPRINT
  • TABLE 142 ATTACK SURFACE MANAGEMENT MARKET: KEY STARTUPS/SMES
  • TABLE 143 ATTACK SURFACE MANAGEMENT MARKET: STARTUPS/SMES VERTICAL FOOTPRINT
  • TABLE 144 ATTACK SURFACE MANAGEMENT MARKET: STARTUPS/SMES REGIONAL FOOTPRINT
  • TABLE 145 ATTACK SURFACE MANAGEMENT MARKET: PRODUCT LAUNCHES, AUGUST 2022–OCTOBER 2023
  • TABLE 146 ATTACK SURFACE MANAGEMENT MARKET: DEALS, AUGUST 2021–MARCH 2023
  • TABLE 147 PALO ALTO NETWORKS: COMPANY OVERVIEW
  • TABLE 148 PALO ALTO NETWORKS: PRODUCTS/SOLUTIONS/SERVICES OFFERED
  • TABLE 149 PALO ALTO NETWORKS: PRODUCT LAUNCHES
  • TABLE 150 PALO ALTO NETWORKS: DEALS
  • TABLE 151 IBM: COMPANY OVERVIEW
  • TABLE 152 IBM: PRODUCTS/SOLUTIONS/SERVICES OFFERED
  • TABLE 153 IBM: DEALS
  • TABLE 154 MICROSOFT: BUSINESS OVERVIEW
  • TABLE 155 MICROSOFT: PRODUCTS/SOLUTIONS/SERVICES OFFERED
  • TABLE 156 MICROSOFT: PRODUCT LAUNCHES
  • TABLE 157 MICROSOFT: DEALS
  • TABLE 158 CISCO: BUSINESS OVERVIEW
  • TABLE 159 CISCO: PRODUCTS/SOLUTIONS/SERVICES OFFERED
  • TABLE 160 GOOGLE: COMPANY OVERVIEW
  • TABLE 161 GOOGLE: PRODUCTS/SOLUTIONS/SERVICES OFFERED
  • TABLE 162 GOOGLE: DEALS
  • TABLE 163 TREND MICRO: BUSINESS OVERVIEW
  • TABLE 164 TREND MICRO: PRODUCTS/SOLUTIONS/SERVICES OFFERED
  • TABLE 165 TREND MICRO: PRODUCT LAUNCHES
  • TABLE 166 QUALYS: BUSINESS OVERVIEW
  • TABLE 167 QUALYS: PRODUCTS/SOLUTIONS/SERVICES OFFERED
  • TABLE 168 TENABLE: BUSINESS OVERVIEW
  • TABLE 169 TENABLE: PRODUCTS/SOLUTIONS/SERVICES OFFERED
  • TABLE 170 TENABLE: PRODUCT LAUNCHES
  • TABLE 171 TENABLE: DEALS
  • TABLE 172 CROWDSTRIKE: COMPANY OVERVIEW
  • TABLE 173 CROWDSTRIKE: PRODUCTS/SOLUTIONS/SERVICES OFFERED
  • TABLE 174 CROWDSTRIKE: PRODUCT LAUNCHES
  • TABLE 175 CROWDSTRIKE: DEALS
  • TABLE 176 RAPID7: COMPANY OVERVIEW
  • TABLE 177 RAPID7: PRODUCTS/SOLUTIONS/SERVICES OFFERED
  • TABLE 178 RAPID7: DEALS
  • TABLE 179 BITSIGHT: BUSINESS OVERVIEW
  • TABLE 180 BITSIGHT: PRODUCTS/SOLUTIONS/SERVICES OFFERED
  • TABLE 181 SECURITYSCORECARD: BUSINESS OVERVIEW
  • TABLE 182 SECURITYSCORECARD: PRODUCTS/SOLUTIONS/SERVICES OFFERED
  • TABLE 183 CYCOGNITO: COMPANY OVERVIEW
  • TABLE 184 CYCOGNITO: PRODUCTS/SOLUTIONS/SERVICES OFFERED
  • TABLE 185 CYCOGNITO: PRODUCT LAUNCHES
  • TABLE 186 CYCOGNITO: DEALS
  • TABLE 187 BUGCROWD: BUSINESS OVERVIEW
  • TABLE 188 BUGCROWD: PRODUCTS/SOLUTIONS/SERVICES OFFERED
  • TABLE 189 BUGCROWD: DEALS
  • TABLE 190 ADJACENT MARKETS AND FORECASTS
  • TABLE 191 SECURITY AND VULNERABILITY MANAGEMENT MARKET, BY COMPONENT, 2016–2020 (USD MILLION)
  • TABLE 192 SECURITY AND VULNERABILITY MANAGEMENT MARKET, BY COMPONENT, 2021–2026 (USD MILLION)
  • TABLE 193 SECURITY AND VULNERABILITY MANAGEMENT MARKET, BY TARGET, 2016–2020 (USD MILLION)
  • TABLE 194 SECURITY AND VULNERABILITY MANAGEMENT MARKET, BY TARGET, 2021–2026 (USD MILLION)
  • TABLE 195 SECURITY AND VULNERABILITY MANAGEMENT MARKET, BY DEPLOYMENT MODE, 2016–2020 (USD MILLION)
  • TABLE 196 SECURITY AND VULNERABILITY MANAGEMENT MARKET, BY DEPLOYMENT MODE, 2021–2026 (USD MILLION)
  • TABLE 197 SECURITY AND VULNERABILITY MANAGEMENT MARKET, BY ORGANIZATION SIZE, 2016–2020 (USD MILLION)
  • TABLE 198 SECURITY AND VULNERABILITY MANAGEMENT MARKET, BY ORGANIZATION SIZE, 2021–2026 (USD MILLION)
  • TABLE 199 SECURITY AND VULNERABILITY MANAGEMENT MARKET, BY VERTICAL, 2016–2020 (USD MILLION)
  • TABLE 200 SECURITY AND VULNERABILITY MANAGEMENT MARKET, BY VERTICAL, 2021–2026 (USD MILLION)
  • TABLE 201 SECURITY AND VULNERABILITY MANAGEMENT MARKET, BY REGION, 2016–2020 (USD MILLION)
  • TABLE 202 SECURITY AND VULNERABILITY MANAGEMENT MARKET, BY REGION, 2021–2026 (USD MILLION)
  • TABLE 203 SECURITY INFORMATION AND EVENT MANAGEMENT MARKET, BY COMPONENT, 2018–2025 (USD MILLION)
  • TABLE 204 SECURITY INFORMATION AND EVENT MANAGEMENT MARKET, BY APPLICATION, 2018–2025 (USD MILLION)
  • TABLE 205 SECURITY INFORMATION AND EVENT MANAGEMENT MARKET, BY DEPLOYMENT MODE, 2018–2025 (USD MILLION)
  • TABLE 206 SECURITY INFORMATION AND EVENT MANAGEMENT MARKET, BY ORGANIZATION SIZE, 2018–2025 (USD MILLION)
  • TABLE 207 SECURITY INFORMATION AND EVENT MANAGEMENT MARKET, BY VERTICAL, 2018–2025 (USD MILLION)
  • TABLE 208 SECURITY INFORMATION AND EVENT MANAGEMENT MARKET, BY REGION, 2018–2025 (USD MILLION)
LIST OF FIGURES
 
  • FIGURE 1 ATTACK SURFACE MANAGEMENT MARKET: RESEARCH DESIGN
  • FIGURE 2 BREAKDOWN OF PRIMARY INTERVIEWS: BY COMPANY TYPE, DESIGNATION, AND REGION
  • FIGURE 3 ATTACK SURFACE MANAGEMENT MARKET: DATA TRIANGULATION
  • FIGURE 4 ATTACK SURFACE MANAGEMENT MARKET ESTIMATION: RESEARCH FLOW
  • FIGURE 5 APPROACH 1 (SUPPLY-SIDE): REVENUE FROM SOLUTIONS AND SERVICES OFFERED BY ATTACK SURFACE MANAGEMENT VENDORS
  • FIGURE 6 ATTACK SURFACE MANAGEMENT MARKET (APPROACH 1): SUPPLY-SIDE ANALYSIS
  • FIGURE 7 ATTACK SURFACE MANAGEMENT MARKET – APPROACH 2: BOTTOM-UP (DEMAND-SIDE)
  • FIGURE 8 GLOBAL ATTACK SURFACE MANAGEMENT MARKET SIZE AND Y-O-Y GROWTH RATE, 2022–2029
  • FIGURE 9 MARKET SEGMENTS WITH HIGH GROWTH RATES
  • FIGURE 10 NORTH AMERICA TO ACCOUNT FOR LARGEST SHARE IN 2023
  • FIGURE 11 RISE IN COMPANIES’ DIGITAL FOOTPRINTS AND INCREASING ADOPTION OF CLOUD AND SOFTWARE-AS-A-SERVICE (SAAS) SOLUTIONS TO DRIVE MARKET
  • FIGURE 12 SOLUTIONS SEGMENT TO ACCOUNT FOR LARGER MARKET DURING FORECAST PERIOD
  • FIGURE 13 CLOUD SEGMENT TO ACCOUNT FOR LARGER MARKET DURING FORECAST PERIOD
  • FIGURE 14 LARGE ENTERPRISES SEGMENT TO ACCOUNT FOR LARGER SHARE DURING FORECAST PERIOD
  • FIGURE 15 BFSI SEGMENT TO ACCOUNT FOR LARGEST MARKET DURING FORECAST PERIOD
  • FIGURE 16 ASIA PACIFIC TO EMERGE AS LUCRATIVE MARKET FOR INVESTMENTS IN NEXT FIVE YEARS
  • FIGURE 17 ATTACK SURFACE MANAGEMENT MARKET: DRIVERS, RESTRAINTS, OPPORTUNITIES, AND CHALLENGES
  • FIGURE 18 ATTACK SURFACE MANAGEMENT MARKET: VALUE CHAIN ANALYSIS
  • FIGURE 19 KEY PLAYERS IN ATTACK SURFACE MANAGEMENT MARKET ECOSYSTEM
  • FIGURE 20 PORTER’S FIVE FORCES ANALYSIS
  • FIGURE 21 AVERAGE SELLING PRICE TREND OF KEY PLAYERS, BY OFFERING
  • FIGURE 22 NUMBER OF PATENTS GRANTED FOR ATTACK SURFACE MANAGEMENT, 2013–2023
  • FIGURE 23 REGIONAL ANALYSIS OF PATENTS GRANTED FOR ATTACK SURFACE MANAGEMENT
  • FIGURE 24 TRENDS/DISRUPTIONS IMPACTING CUSTOMERS’ BUSINESSES
  • FIGURE 25 INFLUENCE OF STAKEHOLDERS ON BUYING PROCESS FOR TOP THREE VERTICALS
  • FIGURE 26 KEY BUYING CRITERIA FOR TOP THREE VERTICALS
  • FIGURE 27 INVESTMENT IN LEADING GLOBAL ATTACK SURFACE MANAGEMENT STARTUPS/SMES, BY NUMBER OF INVESTORS AND FUNDING (USD MILLION)
  • FIGURE 28 SOLUTIONS SEGMENT TO LEAD MARKET DURING FORECAST PERIOD
  • FIGURE 29 LARGE ENTERPRISES SEGMENT TO LEAD MARKET DURING FORECAST PERIOD
  • FIGURE 30 CLOUD SEGMENT TO LEAD MARKET DURING FORECAST PERIOD
  • FIGURE 31 HEALTHCARE INDUSTRY TO WITNESS FASTEST GROWTH DURING FORECAST PERIOD
  • FIGURE 32 ASIA PACIFIC TO GROW AT HIGHEST CAGR DURING FORECAST PERIOD
  • FIGURE 33 NORTH AMERICA: ATTACK SURFACE MANAGEMENT MARKET SNAPSHOT
  • FIGURE 34 ASIA PACIFIC: ATTACK SURFACE MANAGEMENT MARKET SNAPSHOT
  • FIGURE 35 HISTORICAL REVENUE ANALYSIS OF KEY ATTACK SURFACE MANAGEMENT VENDORS, 2021–2023 (USD MILLION)
  • FIGURE 36 VALUATION AND FINANCIAL METRICS OF KEY ATTACK SURFACE MANAGEMENT VENDORS, 2022
  • FIGURE 37 MARKET SHARE ANALYSIS, 2023
  • FIGURE 38 BRAND COMPARISON/VENDOR PRODUCT LANDSCAPE
  • FIGURE 39 ATTACK SURFACE MANAGEMENT MARKET: COMPANY EVALUATION MATRIX (KEY PLAYERS), 2023
  • FIGURE 40 ATTACK SURFACE MANAGEMENT MARKET: OVERALL COMPANY FOOTPRINT
  • FIGURE 41 ATTACK SURFACE MANAGEMENT MARKET: COMPANY EVALUATION MATRIX (STARTUPS/SMES), 2023
  • FIGURE 42 PALO ALTO NETWORKS: COMPANY SNAPSHOT
  • FIGURE 43 IBM: COMPANY SNAPSHOT
  • FIGURE 44 MICROSOFT: COMPANY SNAPSHOT
  • FIGURE 45 CISCO: COMPANY SNAPSHOT
  • FIGURE 46 GOOGLE: COMPANY SNAPSHOT
  • FIGURE 47 TREND MICRO: COMPANY SNAPSHOT
  • FIGURE 48 QUALYS: COMPANY SNAPSHOT
  • FIGURE 49 TENABLE: COMPANY SNAPSHOT
  • FIGURE 50 CROWDSTRIKE: COMPANY SNAPSHOT
  • FIGURE 51 RAPID7: COMPANY SNAPSHOT


The research encompassed various vital activities to determine the current market size of the Attack Surface Management market. Extensive secondary research was conducted to gather information on the industry. Subsequently, primary research involving industry experts across the value chain validated these findings, assumptions, and estimations. The total market size was estimated using different methodologies, including top-down and bottom-up approaches. Following this, market segmentation and data triangulation techniques were applied to ascertain the size of individual segments and subsegments within the Attack Surface management market.

Secondary Research

During the secondary research phase, various sources were consulted to identify and gather pertinent information for the study. These secondary sources encompassed annual reports, press releases, investor presentations from Attack surface management software and service vendors, online forums, accredited publications, and white papers. This secondary research served as a foundation for acquiring crucial insights into the industry's supply chain, key players, market categorization, segmentation based on prevailing trends down to granular levels, regional markets, and noteworthy developments from both market and technological perspectives. These findings were subsequently corroborated and validated through primary sources. Factors considered in estimating regional market sizes included governmental and technological initiatives, Gross Domestic Product (GDP) growth rates, Information and Communication Technology (ICT) expenditure, recent market

developments, and a comprehensive analysis of significant Attack Surface Management solution providers' market standings.

Primary Research

The comprehensive market engineering process employed a combination of top-down and bottom-up approaches, complemented by various data triangulation methods, to accurately estimate and forecast market trends for overall market segments and subsegments outlined in the report. The report systematically compiled and presented vital insights and information through meticulous qualitative and quantitative analyses conducted throughout the market engineering process.

After completing the market engineering process, which encompassed calculations for market statistics, segmentation breakdowns, market size estimations, forecasts, and data triangulation, thorough primary research was undertaken. This primary research gathered, verified, and validated critical numerical data and identified segmentation types, industry trends, and the competitive landscape within the Attack Surface Management market. Moreover, primary research was instrumental in elucidating fundamental market dynamics, including drivers, restraints, opportunities, challenges, industry trends, and strategic initiatives market players adopt.

Following is the breakup of the primary study:
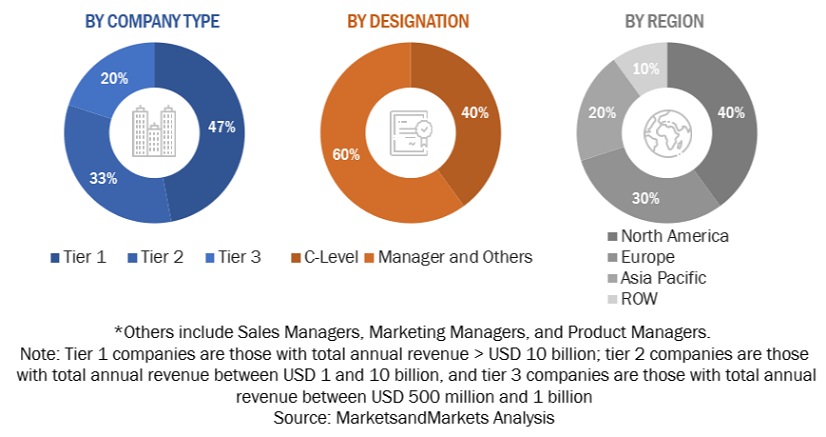
Attack Surface Management  Market Size, and Share

To know about the assumptions considered for the study, download the pdf brochure

Market Size Estimation

Both top-down and bottom-up approaches were employed to accurately estimate and validate the size of the global Attack Surface Management market and determine the sizes of various dependent subsegments within the overarching Attack Surface Management market. The research methodology utilized for estimating market size involved several key steps: Initially, the identification of key players in the market was conducted through comprehensive secondary research. Subsequently, their revenue contributions within respective regions were assessed through a combination of primary and secondary research methods. This process entailed thoroughly examining leading market players' annual and financial reports, supplemented by extensive interviews with industry leaders, including CEOs, VPs, directors, and marketing executives, to gain valuable insights. All percentage splits and segment breakdowns were derived from secondary sources and cross-validated through primary sources to ensure accuracy and reliability.
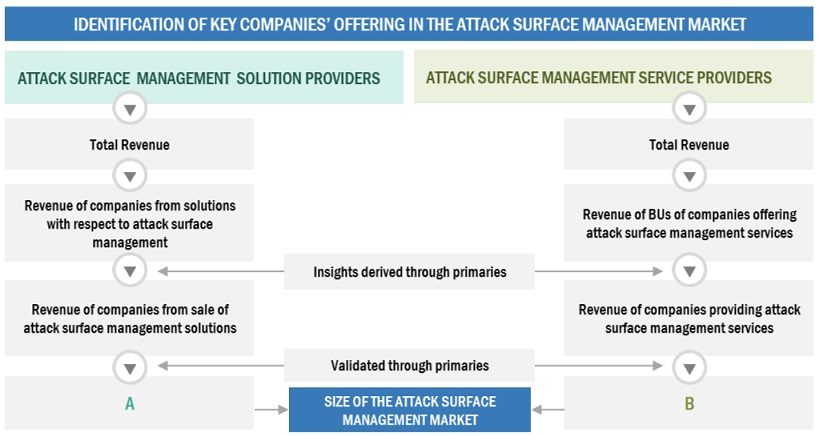
Attack Surface Management  Market Estimation, and Share

To know about the assumptions considered for the study, Request for Free Sample Report

Infographic Depicting Bottom-Up And Top-Down Approaches
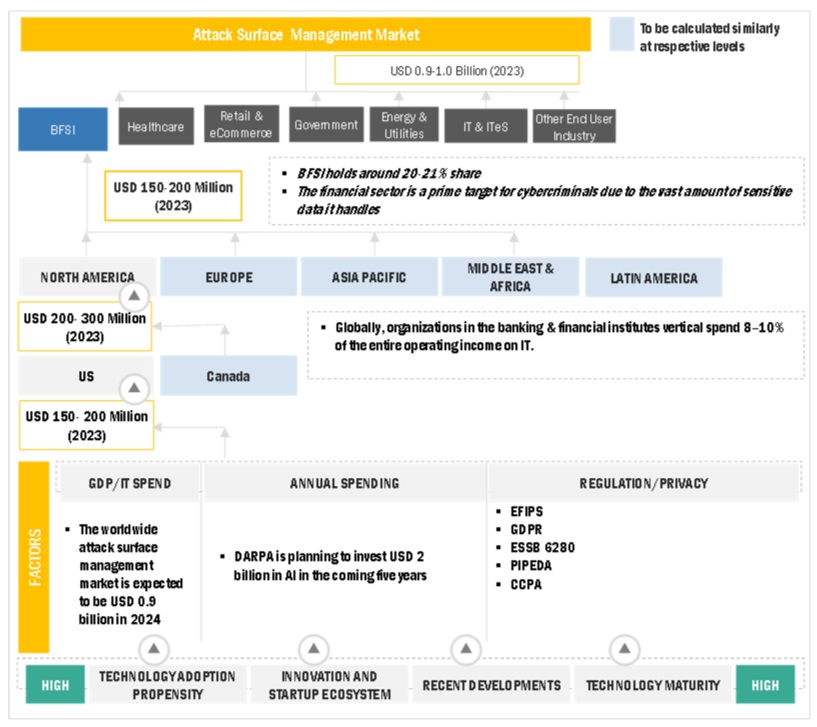
Attack Surface Management  Market Bottom Up and Top Down Approach

Data Triangulation

Following the determination of the overall market size using the market above size estimation methodologies, the market

 was segmented into distinct segments and subsegments. Data triangulation and market segmentation procedures were utilized, as needed, to complete the comprehensive market engineering process and ascertain the precise statistics for each market segment and subsegment. Data triangulation was achieved by analyzing various factors and trends from both the demand and supply sides.

Market Definition

Attack Surface Management (ASM) is the continuous monitoring, remediation, and reduction of all security risks within an organization's attack surface. The ultimate objective of ASM is to keep the attack surface minimal to reduce the number of options hackers have to breach a network perimeter.

According to Palo Alto Networks, Attack Surface Management (ASM) continuously identifies, monitors, and manages all internal and external internet-connected assets for potential attack vectors and exposures.

Report Objectives

  • To define, describe, and forecast the Attack Surface Management market based on offering, organization size, deployment mode, vertical, and region.
  • To forecast the market size of five central regions: North America, Europe, Asia Pacific (APAC), Middle East & Africa (MEA), and Latin America.
  • To analyze the market subsegments concerning individual growth trends, prospects, and contributions to the overall market.
  • To provide detailed information related to the primary factors (drivers, restraints, opportunities, and challenges) influencing the growth of the attack surface management market.
  • To analyze opportunities in the market for stakeholders by identifying high-growth segments of the attack surface management market.
  • To profile the key players of the attack surface management market and comprehensively analyze their market size and core competencies.
  • Track and analyze competitive developments, such as new product launches, mergers and acquisitions, partnerships, agreements, and collaborations in the global attack surface management market.

Customization Options

With the given market data, MarketsandMarkets offers customizations based on company-specific needs. The following customization options are available for the report:

Geographic Analysis

  • Further breakup of the Asia Pacific market into significant countries.
  • Further breakup of the North American market into significant countries.
  • Further breakup of the Latin American market into significant countries.
  • Further breakup of the Middle East African market into significant countries
  • Further breakup of the European market into major countries.

Company Information

  • Detailed analysis and profiling of additional market players (up to 5)
Custom Market Research Services

We will customize the research for you, in case the report listed above does not meet with your exact requirements. Our custom research will comprehensively cover the business information you require to help you arrive at strategic and profitable business decisions.

Request Customization
Report Code
TC 8991
Published ON
Apr, 2024
Choose License Type
BUY NOW
  • SHARE
X
Request Customization
Speak to Analyst
Speak to Analyst
OR FACE-TO-FACE MEETING
PERSONALIZE THIS RESEARCH
  • Triangulate with your Own Data
  • Get Data as per your Format and Definition
  • Gain a Deeper Dive on a Specific Application, Geography, Customer or Competitor
  • Any level of Personalization
REQUEST A FREE CUSTOMIZATION
LET US HELP YOU!
  • What are the Known and Unknown Adjacencies Impacting the Attack Surface Management Market
  • What will your New Revenue Sources be?
  • Who will be your Top Customer; what will make them switch?
  • Defend your Market Share or Win Competitors
  • Get a Scorecard for Target Partners
CUSTOMIZED WORKSHOP REQUEST
knowledgestore logo

Want to explore hidden markets that can drive new revenue in Attack Surface Management Market?

Find Hidden Markets
  • Call Us
  • +1-888-600-6441 (Corporate office hours)
  • +1-888-600-6441 (US/Can toll free)
  • +44-800-368-9399 (UK office hours)
CONNECT WITH US
ABOUT TRUST ONLINE
©2024 MarketsandMarkets Research Private Ltd. All rights reserved
DMCA.com Protection Status
Website Feedback