Protein Alternatives Market

Protein Alternatives Market by Source (Plant Protein, Microbial Protein, Insect Protein), Application (Food & Beverages, Animal Feed, Pet Food), Form, Nature, Production Process (Qualitative), & Region - Global Forecast to 2029

Report Code: FB 9057 Jun, 2024, by marketsandmarkets.com

Protein Alternatives Market Overview (2024-2029)

The global protein alternatives market is estimated at USD 15.7 billion in 2024; it is projected to grow at a CAGR of 9.9% to reach USD 25.2 billion by 2029. The protein alternatives market has experienced rapid growth and diversification in recent years, driven by increasing consumer demand for sustainable, health-conscious, and ethically produced food options. Key drivers of this market include rising concerns over the environmental impact of traditional animal agriculture, health benefits associated with plant-based diets, and ethical considerations regarding animal welfare. Major segments within the protein alternatives market include plant-based proteins, insect-based proteins, microbial protein. Companies like Beyond Meat, Impossible Foods, and Oatly have become household names, reflecting the mainstream acceptance and expanding consumer base for these products. Technological advancements and significant investments from both food industry giants and venture capitalists have further accelerated the development and accessibility of innovative protein alternatives.

Protein Alternatives Market

To know about the assumptions considered for the study, Request for Free Sample Report

Protein Alternatives Market Opportunities

To know about the assumptions considered for the study, download the pdf brochure

Protein Alternatives Market Dynamics

Driver: Increasing Demand for Alternate Protein

The increasing global population underscores the necessity for alternative protein sources. Over the past decade, significant efforts have focused on developing proteins from non-traditional crops and livestock. This trend is particularly noticeable in Europe and North America, where consumer interest and investment in alternative proteins have surged. The conventional sources of animal protein like pork, beef, and chicken are projected to be insufficient to meet future demands, creating opportunities for the expansion of the insect protein market. In addition to proteins and fats, insects are valued for their rich mineral and vitamin content. Among younger demographics, particularly in sports nutrition, insect proteins, such as cricket flour, are gaining popularity and are being incorporated into various nutritious food products. For instance, startups like Next Step Foods in the UK produce cricket protein bars like "Yuana" available in multiple flavors.

The shift to alternative proteins also promises environmental benefits, notably in reducing greenhouse gas emissions compared to traditional meat production, as highlighted by the World Economic Forum in 2019. Moreover, adopting alternative proteins addresses diet-related health concerns in developing countries and promotes healthier lifestyles in developed regions such as North America and Europe. These areas have already embraced alternative protein sources such as edible insects, plant-based meat, plant protein ingredients, and cultured meat. Industry experts predict significant market growth potential for these products, with cultured and plant-based meat alone expected to see over 40% growth in the coming years.

In 2022, a study funded by the European Regional Development Fund revealed that 22% of UK consumers preferred alternative protein sources over meat, with the younger demographic showing an even higher preference exceeding 25%. These trends underscore the growing market opportunities in the insect protein sector..

Restraint: Microbial Risk and Allergic Reactions

Food allergies are widespread globally and have seen increased prevalence. While insects offer nutritional benefits, their introduction into food and feed poses potential allergic risks for both animals and humans. Due to the novelty of incorporating insects into diets, understanding and treating these allergies is currently limited, thereby raising concerns for consumers. Risks associated with insect consumption include possible contamination by chemicals like heavy metals and microbiological agents. Moreover, certain insects can elicit allergic reactions through ingestion, inhalation, direct contact, stings, and bites. Cross-reactivity with allergens from related foods such as crustaceans and environmental allergens like dust mites further complicates the allergy landscape associated with insect consumption.

Research from the University of Nottingham's School of Biosciences and Department of Nutritional Sciences highlights that in North-eastern Thailand's Isan region, approximately 7.4% of individuals reported adverse reactions to edible insects, with 14.7% experiencing multiple reactions. Notably, 46.2% of those affected had pre-existing food allergies exacerbated by insect consumption. Gastrointestinal symptoms such as diarrhea and vomiting were commonly reported. This underscores the significant allergy-related challenges facing insect protein adoption, particularly in Western cultures.

Opportunity: Changes in consumer lifestyles

The global population's expansion is placing heightened strain on limited resources, with escalating energy prices and raw material expenses impacting food costs, particularly affecting lower-income demographics. Additionally, the strain on food resources is being intensified by water scarcity, notably prevalent across Africa and Northern Asia. Within the Asia Pacific region, there exists a cost advantage in terms of both production and processing, fostering high demand and offering favorable conditions for dairy alternative suppliers and manufacturers to target this market.

As lifestyles evolve rapidly, there's a noticeable shift towards more nutritious and health-conscious food options. The distinction between fast food and junk food is anticipated to grow, with consumers increasingly seeking quick yet wholesome alternatives. Recognizing naturally rich nutritional products presents a significant opportunity for suppliers and manufacturers to meet evolving consumer preferences.

Furthermore, the rise in disposable incomes is driving demand for convenient, healthy, and highly nutritious products across Asia Pacific nations. Emerging economies within the region present substantial opportunities for growth within the protein alternatives market.

Challenge: Replicating meat and dairy textures challenges due to consumer expectations

Developing plant-based proteins that convincingly replicate the taste, texture, and mouthfeel of traditional meat and dairy products is a multifaceted challenge in the protein alternatives market. Meat and dairy products are deeply ingrained in culinary cultures worldwide, and consumers have well-established expectations regarding their sensory experiences. Mimicking the savory umami flavor, juicy texture, and tender bite of meat, for example, requires intricate formulation of plant proteins and other ingredients. Achieving a similar experience to dairy products like cheese or yogurt involves not just replicating taste but also mimicking the creamy texture and richness that dairy fats impart.

Texture plays a crucial role in consumer acceptance of plant-based alternatives. The fibrous structure of meat or the smooth consistency of dairy products is often difficult to replicate with plant-derived ingredients alone. Innovations in food science have led to the development of techniques such as extrusion, fermentation, and blending of proteins to enhance texture and mouthfeel. However, balancing these efforts with clean label requirements and natural ingredient preferences adds another layer of complexity. Moreover, ensuring that these products remain stable during cooking or processing without compromising taste or texture is a continuous challenge that requires ongoing research and development.

Protein Alternatives Market Ecosystem

Prominent companies in this market include well-established, financially stable manufacturers of protein alternatives. These companies have been operating in the market for several years and possess a diversified product portfolio, state-of-the-art technologies, and strong global sales and marketing networks. Prominent companies in this market include ADM (US), Cargill Incorporated (US), International Flavors & Fragrances Inc. (US), Roquette Frères (France), Ingredion (US), Wilmar International Ltd. (Singapore).

Top Companies in Protein Alternatives Market

Based on nature, the organic sub segment is estimated to grow at the fastest CAGR during the studied period.

Consumers are increasingly turning towards plant-based and organic protein sources as they become more health-conscious and environmentally aware. This shift is driven by concerns over animal welfare, sustainability, and the desire for cleaner, healthier eating options. Organic protein alternatives, such as plant-based meats, dairy substitutes, and protein-rich grains like quinoa and lentils, are gaining popularity due to their perceived health benefits and minimal environmental impact. Companies in this sector are innovating rapidly to meet rising demand, offering a diverse range of products that cater to various dietary preferences and nutritional needs. As a result, the protein alternatives market is not only expanding in size but also evolving in terms of product offerings and market reach.

Moreover, the growth in the protein alternatives market is bolstered by changing consumer behaviors and preferences towards more sustainable lifestyles. As awareness of climate change and resource depletion increases, consumers are seeking out products that align with their values of sustainability and ethical sourcing.  Protein alternatives not only offer a viable substitute to traditional animal-based proteins but also often boast certifications that ensure they are produced using environmentally friendly practices. This growing market trend is attracting investment from both established food companies and startups alike, driving further innovation and market expansion. Overall, the organic nature of the protein alternatives market reflects a broader societal shift towards healthier, more sustainable food choices, shaping the future landscape of the food industry.

The feed application in the protein alternatives market is forecasted to register the most significant CAGR over the projected period.

The demand for protein alternatives in animal feed is steadily increasing, reflecting the rising consumption of various products in developed countries. North America and Asia Pacific are key players in both livestock production and feed consumption. While plant-based sources have been utilized in the food industry for some time, they have typically been processed and used in a relatively basic protein form. However, there is a noticeable trend towards the development of higher-quality protein-based feeds, such as isolates, indicating an improvement in feed quality. Insect proteins, increasingly favored in poultry and aquaculture feeds, and microbial proteins, widely integrated into compound premixes to enhance nutritional profiles, are gaining traction. This shift towards alternative protein sources in feed applications is driven by mounting concerns about sustainable agricultural practices aimed at reducing the environmental impact of future food production.

In March 2022, Global Bugs' (Thailand) successful partnership with Smart Vet Group (Thailand) highlighted a strategic move towards meeting the rising market demand for alternative protein sources in pet food. By focusing on formulating and producing pet foods and supplements containing whole roasted crickets and cricket powder, they are tapping into a growing trend where consumers are increasingly seeking sustainable and nutritious options for their pets. This collaboration not only underscores the potential of insect-based proteins in the pet food industry but also demonstrates a commitment to innovation and meeting evolving consumer preferences.

The Asia Pacific region is anticipated to experience the most rapid growth between 2024 and 2029.

The protein alternatives market in the Asia Pacific region is witnessing rapid expansion, driven by heightened consumer awareness of health benefits, immunity enhancement, and environmental sustainability. This shift towards protein sources beyond traditional animal products underscores a growing recognition of the health advantages associated with plant-centric diets, including lower risks of chronic illnesses and bolstered immune systems. Concurrently, rising concerns over environmental sustainability, such as the impact of animal agriculture on carbon emissions and land use, are prompting consumers to adopt plant-based alternatives. This evolving trend is bolstered by advanced food technologies that offer a diverse array of plant-based protein products tailored to meet the region's diverse culinary preferences. Consequently, the Asia Pacific region is emerging as a significant force in shaping the global protein alternatives market, poised for sustained growth and continuous innovation in the foreseeable future.

Protein Alternatives Market by Region

Protein Alternatives Market Share

Key Market Players in this include Tate & Lyle PLC (London), Kerry Group PLC (Ireland), DSM Firmenich (Switzerland, ADM (US), Cargill Incorporated (US), International Flavors & Fragrances Inc. (US), Ingredion (US), Roquette Frères (France), Wilmar International Ltd. (Singapore), Glanbia plc (Ireland), Kerry Group PLC (Ireland), DSM-Firmenich (Switzerland), AGT Food and Ingredients (Canada), Burcon (Canada), Ynsect (France), Global bugs (Thailand), and Innovafeed (France).

Other players include BENEO GmbH (Germany), SOTEXPRO (France), Shandong Jianyuan Group (China), AMCO Proteins (US), Australian Plant Proteins Pty Ltd (Australia), nextProtein (France), Mycorena (Sweden), Burcon NutraScience Corporation (Canada), Emsland Group (Germany), COSUCRA (Belgium) and Hexafly (Ireland).

These players in this market are focusing on increasing their presence through agreements and collaborations. These companies have a strong presence in North America, Asia Pacific, and Europe. They also have manufacturing facilities along with strong distribution networks across these regions.

Get online access to the report on the World's First Market Intelligence Cloud

  • Easy to Download Historical Data & Forecast Numbers
  • Company Analysis Dashboard for high growth potential opportunities
  • Research Analyst Access for customization & queries
  • Competitor Analysis with Interactive dashboard
  • Latest News, Updates & Trend analysis
Request Sample

Scope of the Report

:

Report Metric

Details

Market size estimation

2024–2029

Base year considered

2023

Forecast period considered

2024–2029

Units considered

Value (USD), Volume (KT)

Segments Covered

By Source, By Form, By Nature, By Application, By Production process (qualitative) and By Region

Regions covered

North America, Europe, Asia Pacific, South America, and RoW

Companies studied

Key Players:

  • ADM (US)
  • Cargill Incorporated (US)
  • International Flavors & Fragrances Inc. (US)
  • Ingredion (US)
  • Roquette Frères (France)
  • Wilmar International Ltd. (Singapore)
  • Glanbia plc (Ireland)
  • Kerry Group PLC (Ireland)
  • DSM (Netherlands)
  • AGT Food and Ingredients (Canada)
  • Tate & Lyle (UK)
  • Burcon (Canada)
  • InnovaFeed (France)
  • Global bugs (Thailand)
  • Ynsect (France)

Other Players:

  • BENEO GmbH (Germany)
  • SOTEXPRO (France)
  • Shandong Jianyuan group (China)
  • AMCO Proteins (US)
  • Emsland Group (Germany)
  • COSUCRA (Belgium)
  • Australian Plant Proteins Pty Ltd (Australia)
  • PURIS (US)
  • Mycorena (Sweden)
  • nextProtein (France)
  • Hexafly (Ireland)

This research report categorizes the protein alternatives market based on source, form, nature and application, production process (qualitative) and region.

Protein Alternatives Market:

By Source
  • Plant Protein
    • Soy
    • Peas
    • Wheat
    • Canola, Rice, Oats and Potatoes
    • Beans & seeds
    • Other Plant Protein
  • Microbial Protein
    • Algae
    • Fungi
    • Bacteria
    • Other Microbe-based
  • Insect Protein
    • Cricket
    • Mealworm
    • Locust
  • Other Insect protein
By Form
  • Dry
  • Liquid
By Nature
  • Conventional
  • Organic
By Application
  • Food & beverages
    • Meat Alternatives
      • Meatballs & nuggets
      • Sausages
      • Burgers
      • Other Meat Alternatives
    • Dairy Alternatives
      • Milk Substitute
      • Cheese Alternatives
      • Yogurt Substitute
      • Ice-Cream Substitute
      • Other Dairy Alternatives
    • Protein Supplements
      • Bars
      • Powders
      • Protein Shakes
      • Other Protein Supplements
    • Functional Food
      • Fortified Cereals
      • RTD Beverages
      • Other Functional Food
    • Convenience Foods
      • Baked Food
      • Snacks
      • Sauces, Gravies, & Soups
      • Spreads
      • Other Convenience Food
  • Animal Feed/ Nutrition
    • Poultry
    • Swine
    • Ruminants
    • Aquaculture
  • Pet Food
  • Cat food
  • Dog Food
  • Other Pet Food
By Region
  • North America
  • Europe
  • Asia Pacific
  • South America
  • Rest of the World (RoW)

Recent Developments

  • In January 2024, Ÿnsect became the first company authorized to commercialize mealworm proteins for dog food in the United States as of January 24, 2024. This milestone allows Ÿnsect to expand its sustainable insect protein offerings into the US pet food market, meeting the rising consumer demand for eco-friendly pet nutrition. This authorization is expected to enhance Ÿnsect's market presence and support the trend of using insect-based proteins in pet food.
  • In February 2024, Roquette expanded its Nutralys plant protein line by launching four new pea protein products, encompassing isolates, hydrolysates, and textured variants. These versatile pea proteins are designed to address formulation challenges in plant-based foods and high-protein nutritional products. They pave the way for innovation in various items, including nutritional bars, protein beverages, and plant-based meat and dairy alternatives.
  • In May 2023, ADM and Air Protein established a Strategic Development Agreement (SDA) to jointly develop innovative protein sources for nutrition. Air Protein produces protein through air-based techniques that bypass traditional agriculture and farmland, mitigating supply chain risks. This collaboration combines ADM's expertise in nutrition, formulation, and research with Air Protein's pioneering landless agriculture platform to enhance cost-effective protein ingredients for North American meat substitutes. The partnership includes plans to build and run the world's first commercial-scale Air Protein plant. ADM's investment, along with contributions from other partners, has been pivotal in advancing Air Protein's technology, including its Bay Area Air Farm. This agreement underscores the companies' dedication to sustainable food systems and addresses the growing global demand for protein.
  • In June 2022, AMCO Proteins (US) acquired a 40,000-square-foot facility in Mountain Top, Pennsylvania, which includes five food-grade production rooms and storage space for over 500 pallets. This new facility is anticipated to boost and expand the company's spray drying, blending, and milling operations, thereby enhancing its business capabilities in these areas.
  • In April 2022, ADM made a strategic investment of USD 300 million to enhance alternative protein production at its Decatur, Illinois plant, aiming to double the facility's soy extrusion capacity. This investment also includes the construction of a Protein Innovation Center, equipped with labs, test kitchens, and pilot-scale production facilities, to strengthen the company's R&D capabilities.
  • In September 2021, Roquette Frères inaugurated a new plant-protein center of expertise in Vic-Sur-Aisne. This strategic initiative aimed to strengthen the company's R&D capabilities and help them adapt to the evolving needs of their customers.

Frequently Asked Questions (FAQ):

To speak to our analyst for a discussion on the above findings, click Speak to Analyst

TABLE OF CONTENTS
 
1 INTRODUCTION (Page No. - 50)
    1.1 STUDY OBJECTIVES 
    1.2 MARKET DEFINITION 
    1.3 STUDY SCOPE 
           1.3.1 MARKET SEGMENTATION
           1.3.2 INCLUSIONS AND EXCLUSIONS
           1.3.3 REGIONS COVERED
           1.3.4 YEARS CONSIDERED
    1.4 CURRENCY CONSIDERED 
           TABLE 1 USD EXCHANGE RATES, 2020–2023
    1.5 UNITS CONSIDERED 
    1.6 STAKEHOLDERS 
           1.6.1 RECESSION IMPACT ANALYSIS
 
2 RESEARCH METHODOLOGY (Page No. - 57)
    2.1 RESEARCH DATA 
           FIGURE 1 PROTEIN ALTERNATIVES MARKET: RESEARCH DESIGN
           2.1.1 SECONDARY DATA
                    2.1.1.1 Key data from secondary sources
           2.1.2 PRIMARY DATA
                    2.1.2.1 Key data from primary sources
                    2.1.2.2 Breakdown of primary profiles
                               FIGURE 2 BREAKDOWN OF PRIMARY INTERVIEWS, BY COMPANY TYPE, DESIGNATION, AND REGION
                    2.1.2.3 Key insights
                               FIGURE 3 INSIGHTS FROM KEY INDUSTRY EXPERTS
    2.2 MARKET SIZE ESTIMATION 
           2.2.1 TOP-DOWN APPROACH
                    FIGURE 4 MARKET SIZE ESTIMATION METHODOLOGY: TOP-DOWN APPROACH
           2.2.2 SUPPLY-SIDE ANALYSIS
                    FIGURE 5 MARKET SIZE CALCULATION: SUPPLY SIDE
           2.2.3 BOTTOM-UP APPROACH (DEMAND SIDE)
                    FIGURE 6 MARKET SIZE ESTIMATION METHODOLOGY: BOTTOM-UP APPROACH
    2.3 DATA TRIANGULATION 
           FIGURE 7 DATA TRIANGULATION
    2.4 RESEARCH ASSUMPTIONS 
    2.5 LIMITATIONS AND RISK ASSESSMENT 
    2.6 RECESSION IMPACT ANALYSIS 
           2.6.1 MACROECONOMIC INDICATORS OF RECESSION
                    FIGURE 8 MACROECONOMIC INDICATORS OF RECESSION
                    FIGURE 9 GLOBAL INFLATION RATE, 2011–2022
                    FIGURE 10 GLOBAL GDP, 2011–2022 (USD TRILLION)
                    FIGURE 11 RECESSION INDICATORS AND THEIR IMPACT ON PROTEIN ALTERNATIVES MARKET
                    FIGURE 12 GLOBAL PROTEIN ALTERNATIVES MARKET: EARLIER FORECAST VS. RECESSION FORECAST
 
3 EXECUTIVE SUMMARY (Page No. - 72)
    TABLE 2 PROTEIN ALTERNATIVES: MARKET SHARE SNAPSHOT, 2024 VS. 2029 (USD MILLION) 
    FIGURE 13 PROTEIN ALTERNATIVES MARKET, BY SOURCE, 2024 VS. 2029 (USD MILLION) 
    FIGURE 14 PROTEIN ALTERNATIVES MARKET, BY APPLICATION, 2024 VS. 2029 (USD MILLION) 
    FIGURE 15 PROTEIN ALTERNATIVES MARKET, BY NATURE, 2024 VS. 2029 (USD MILLION) 
    FIGURE 16 PROTEIN ALTERNATIVES MARKET, BY FORM, 2024 VS. 2029 
    FIGURE 17 PROTEIN ALTERNATIVES MARKET SHARE AND GROWTH RATE, BY REGION 
 
4 PREMIUM INSIGHTS (Page No. - 77)
    4.1 ATTRACTIVE OPPORTUNITIES FOR PLAYERS IN PROTEIN ALTERNATIVES MARKET 
           FIGURE 18 NEW PRODUCT DEVELOPMENTS AND FACILITY EXPANSION TO DRIVE PROTEIN ALTERNATIVES MARKET
    4.2 ASIA PACIFIC: PROTEIN ALTERNATIVES MARKET, BY APPLICATION AND COUNTRY 
           FIGURE 19 CHINA AND FOOD & BEVERAGES SEGMENT TO ACCOUNT FOR SIGNIFICANT SHARES IN 2024
    4.3 PROTEIN ALTERNATIVES MARKET, BY SOURCE 
           FIGURE 20 PLANT PROTEIN SEGMENT TO DOMINATE MARKET DURING FORECAST PERIOD
    4.4 PROTEIN ALTERNATIVES MARKET, BY FORM 
           FIGURE 21 DRY SEGMENT TO DOMINATE MARKET DURING FORECAST PERIOD
    4.5 PROTEIN ALTERNATIVES MARKET, BY NATURE 
           FIGURE 22 CONVENTIONAL SEGMENT TO DOMINATE MARKET DURING FORECAST PERIOD
    4.6 PROTEIN ALTERNATIVES MARKET, BY APPLICATION 
           FIGURE 23 FOOD & BEVERAGES SEGMENT TO DOMINATE MARKET DURING FORECAST PERIOD
    4.7 PROTEIN ALTERNATIVES MARKET, BY APPLICATION AND REGION 
           FIGURE 24 FOOD & BEVERAGES SEGMENT TO LEAD MARKET DURING FORECAST PERIOD
    4.8 PROTEIN ALTERNATIVES MARKET: REGIONAL SNAPSHOT 
           FIGURE 25 US TO DOMINATE PROTEIN ALTERNATIVES MARKET IN 2024
 
5 PROTEIN ALTERNATIVES MARKET OVERVIEW (Page No. - 82)
    5.1 INTRODUCTION 
    5.2 MACROECONOMIC INDICATORS 
           5.2.1 GLOBAL PRODUCTION OF PEA CROPS AND GREEN PEAS AND BOOST IN INNOVATION
                    FIGURE 26 GLOBAL PRODUCTION OF CHICKPEAS AND GREEN PEAS, 2018–2022 (MILLION TONNES)
                    FIGURE 27 GLOBAL PEA PRODUCTION, BY COUNTRY, 2021 (MILLION TONNES)
           5.2.2 INCREASE IN SOYBEAN PRODUCTION
                    FIGURE 28 SOYBEAN PRODUCTION, BY KEY COUNTRY, 2018–2023 (MILLION TONNES)
           5.2.3 CONSUMER SHIFT TOWARD PROTEIN ALTERNATIVES
           5.2.4 INCREASING COLLABORATIONS & INVESTMENTS IN R&D BETWEEN MARKET LEADERS AND STARTUPS
                    TABLE 3 LIST OF INVESTMENTS IN INSECT PROTEIN MARKET, 2019–2023 (USD MILLION)
    5.3 MARKET DYNAMICS 
           FIGURE 29 PROTEIN ALTERNATIVES MARKET: DRIVERS, RESTRAINTS, OPPORTUNITIES, AND CHALLENGES
           5.3.1 DRIVERS
                    5.3.1.1 Increase in interest in health-centric food and beverages
                    5.3.1.2 Growth in consumer preferences toward veganism
                    5.3.1.3 Rise in cases of lactose intolerance
                               TABLE 4 PERCENTAGE OF LACTOSE-INTOLERANT PEOPLE, BY ETHNICITY
                    5.3.1.4 Increased preference for meat alternatives
                    5.3.1.5 Rise in lactose intolerance to boost use of wheat protein as dairy alternative
                               FIGURE 30 ESTIMATED PREVALENCE OF LACTOSE MALABSORPTION, BY COUNTRY, 2022
           5.3.2 RESTRAINTS
                    5.3.2.1 Allergies associated with plant-based protein sources
                    5.3.2.2 Nutritional and vitamin deficiencies among vegans
                    5.3.2.3 Consumers’ unacceptance of insect-based proteins
           5.3.3 OPPORTUNITIES
                    5.3.3.1 Focus on aquatic plants as new and emerging sources of protein
                    5.3.3.2 Effective marketing strategies and correct positioning of plant-based proteins
                    5.3.3.3 Lifestyle changes
                    5.3.3.4 Opportunities for food equipment manufacturers in insect rearing
           5.3.4 CHALLENGES
                    5.3.4.1 Concerns over quality of food and beverages due to adulteration of GM ingredients
                    5.3.4.2 Economic constraints
                    5.3.4.3 Concerns related to taste and texture offered by plant-based protein
 
6 PROTEIN ALTERNATIVES INDUSTRY TRENDS (Page No. - 96)
    6.1 INTRODUCTION 
    6.2 SUPPLY CHAIN ANALYSIS 
           FIGURE 31 PROTEIN ALTERNATIVES MARKET: SUPPLY CHAIN ANALYSIS
    6.3 VALUE CHAIN ANALYSIS 
           FIGURE 32 PROTEIN ALTERNATIVES MARKET: VALUE CHAIN ANALYSIS
           6.3.1 RESEARCH & PRODUCT DEVELOPMENT
           6.3.2 RAW MATERIAL SOURCING
           6.3.3 PRODUCTION & PROCESSING
           6.3.4 DISTRIBUTION
           6.3.5 MARKETING & SALES
           6.3.6 END USERS
    6.4 TRADE ANALYSIS 
           6.4.1 IMPORT SCENARIO OF SOYBEANS
                    FIGURE 33 IMPORT OF SOYBEANS, BY KEY COUNTRY, 2019–2023 (USD)
                    TABLE 5 IMPORT SCENARIO FOR HS CODE: 1201, BY COUNTRY, 2019–2023 (USD)
           6.4.2 EXPORT SCENARIO OF SOYBEANS
                    FIGURE 34 EXPORT OF SOYBEANS, BY KEY COUNTRY, 2019–2023 (USD)
                    TABLE 6 EXPORT SCENARIO FOR HS CODE: 1201, BY COUNTRY, 2019–2023 (USD)
           6.4.3 IMPORT SCENARIO OF PEAS
                    FIGURE 35 IMPORT OF PEAS, BY KEY COUNTRY, 2019–2023 (USD)
                    TABLE 7 IMPORT SCENARIO FOR HS CODE: 071310, BY COUNTRY, 2019–2023 (USD)
           6.4.4 EXPORT SCENARIO OF PEAS, BY KEY COUNTRY
                    FIGURE 36 EXPORT OF PEAS, BY KEY COUNTRY, 2019–2023 (USD)
                    TABLE 8 EXPORT SCENARIO FOR HS CODE: 071310, BY COUNTRY, 2019–2023 (USD)
           6.4.5 IMPORT SCENARIO OF WHEAT & MESLIN
                    FIGURE 37 IMPORT OF WHEAT & MESLIN, BY KEY COUNTRY, 2019–2023 (USD)
                    TABLE 9 IMPORT SCENARIO FOR HS CODE: 1001, BY COUNTRY, 2019–2023 (USD)
           6.4.6 EXPORT SCENARIO OF WHEAT & MESLIN
                    FIGURE 38 EXPORT OF WHEAT & MESLIN, BY KEY COUNTRY, 2019–2023 (USD)
                    TABLE 10 EXPORT SCENARIO FOR HS CODE: 1001, BY COUNTRY, 2019–2023 (USD)
           6.4.7 IMPORT SCENARIO OF RICE
                    FIGURE 39 IMPORT OF RICE, BY KEY COUNTRY, 2019–2023 (USD)
                    TABLE 11 IMPORT SCENARIO FOR HS CODE: 1006, BY COUNTRY, 2019–2023 (USD)
           6.4.8 EXPORT SCENARIO OF RICE
                    FIGURE 40 EXPORT OF RICE, BY KEY COUNTRY, 2019–2023
                    TABLE 12 EXPORT SCENARIO FOR HS CODE: 1006, BY COUNTRY, 2019–2023 (USD)
           6.4.9 IMPORT SCENARIO OF OATS
                    FIGURE 41 IMPORT OF OATS, BY KEY COUNTRY, 2019–2023
                    TABLE 13 IMPORT SCENARIO FOR HS CODE: 1004, BY COUNTRY, 2019–2023 (USD)
           6.4.10 EXPORT SCENARIO OF OATS
                    FIGURE 42 EXPORT OF OATS, BY KEY COUNTRY, 2019–2023 (USD)
                    TABLE 14 EXPORT SCENARIO FOR HS CODE: 1004, BY COUNTRY, 2019–2023 (USD)
           6.4.11 IMPORT SCENARIO OF MUSHROOMS
                    FIGURE 43 IMPORT OF MUSHROOMS, BY KEY COUNTRY, 2019–2023 (USD)
                    TABLE 15 IMPORT SCENARIO FOR HS CODE: 2003, BY COUNTRY, 2019–2023 (USD)
           6.4.12 EXPORT SCENARIO OF MUSHROOMS
                    FIGURE 44 EXPORT OF MUSHROOMS, BY KEY COUNTRY, 2019–2023 (USD)
                    TABLE 16 EXPORT SCENARIO FOR HS CODE: 2003, BY COUNTRY, 2019–2023 (USD)
    6.5 TECHNOLOGY ANALYSIS 
           6.5.1 KEY TECHNOLOGIES
                    6.5.1.1 Extrusion
                    6.5.1.2 Use of membrane technology to produce differentiated wheat proteins
           6.5.2 COMPLEMENTARY TECHNOLOGIES
                    6.5.2.1 High-pressure Processing (HPP)
                    6.5.2.2 U-Loop
           6.5.3 ADJACENT TECHNOLOGIES
                    6.5.3.1 Wet processing method for producing dairy alternative milk
    6.6 PRICING ANALYSIS 
           6.6.1 AVERAGE SELLING PRICE TRENDS OF KEY PLAYERS, BY SOURCE
                    FIGURE 45 AVERAGE SELLING PRICE TREND OF KEY PLAYERS, BY SOURCE, 2023 (USD/KG)
                    TABLE 17 AVERAGE SELLING PRICE TREND OF KEY PLAYERS, BY SOURCE, 2023 (USD/KG)
           6.6.2 AVERAGE SELLING PRICE TREND, BY REGION
                    FIGURE 46 AVERAGE SELLING PRICE TREND, BY REGION, 2020–2023 (USD/KG)
                    TABLE 18 AVERAGE SELLING PRICE TREND, BY REGION, 2020–2023 (USD/KG)
           6.6.3 AVERAGE SELLING PRICE TREND, BY SOURCE
                    FIGURE 47 AVERAGE SELLING PRICE TREND, BY SOURCE, 2020–2023 (USD/KG)
                    TABLE 19 AVERAGE SELLING PRICE TREND, BY SOURCE, 2020–2023 (USD/KG)
    6.7 ECOSYSTEM 
           6.7.1 DEMAND SIDE
           6.7.2 SUPPLY SIDE
                    FIGURE 48 KEY PLAYERS IN PROTEIN ALTERNATIVES MARKET
                    TABLE 20 PROTEIN ALTERNATIVES MARKET: ECOSYSTEM
    6.8 TRENDS/DISRUPTIONS IMPACTING CUSTOMERS’ BUSINESSES 
           FIGURE 49 TRENDS/DISRUPTIONS IMPACTING CUSTOMERS’ BUSINESSES
    6.9 PATENT ANALYSIS 
           TABLE 21 LIST OF MAJOR PATENTS PERTAINING TO MARKET, 2014–2024
           FIGURE 50 NUMBER OF PATENTS GRANTED FOR PROTEIN ALTERNATIVES, 2014–2024
           FIGURE 51 REGIONAL ANALYSIS OF PATENTS GRANTED FOR PROTEIN ALTERNATIVES
    6.10 KEY CONFERENCES & EVENTS 
           TABLE 22 PROTEIN ALTERNATIVES MARKET: LIST OF KEY CONFERENCES & EVENTS, 2024–2025
    6.11 TARIFF AND REGULATORY LANDSCAPE 
           6.11.1 TARIFF DATA FOR SOY
                    TABLE 23 TARIFF FOR HS CODE: 120190
           6.11.2 TARIFF DATA FOR PEAS
                    TABLE 24 TARIFF FOR HS CODE: 071310
           6.11.3 REGULATORY BODIES, AGENCIES, AND OTHER ORGANIZATIONS
                    TABLE 25 NORTH AMERICA: REGULATORY BODIES, GOVERNMENT AGENCIES, AND OTHER ORGANIZATIONS
                    TABLE 26 EUROPE: REGULATORY BODIES, GOVERNMENT AGENCIES, AND OTHER ORGANIZATIONS
                    TABLE 27 ASIA PACIFIC: REGULATORY BODIES, GOVERNMENT AGENCIES, AND OTHER ORGANIZATIONS
                    TABLE 28 SOUTH AMERICA: REGULATORY BODIES, GOVERNMENT AGENCIES, AND OTHER ORGANIZATIONS
                    TABLE 29 ROW: REGULATORY BODIES, GOVERNMENT AGENCIES, AND OTHER ORGANIZATIONS
           6.11.4 REGULATORY FRAMEWORK
                    6.11.4.1 North America
                               6.11.4.1.1 US
                    6.11.4.2 Feed Application
                    6.11.4.3 Food Application
                               6.11.4.3.1 Canada
                    6.11.4.4 Europe
                    6.11.4.5 Asia Pacific
    6.12 PORTER’S FIVE FORCES ANALYSIS 
                    TABLE 30 PORTER’S FIVE FORCES ANALYSIS
                    FIGURE 52 PORTER’S FIVE FORCES ANALYSIS
           6.12.1 THREAT OF NEW ENTRANTS
           6.12.2 THREAT OF SUBSTITUTES
           6.12.3 BARGAINING POWER OF SUPPLIERS
           6.12.4 BARGAINING POWER OF BUYERS
           6.12.5 INTENSITY OF COMPETITIVE RIVALRY
    6.13 KEY STAKEHOLDERS & BUYING CRITERIA 
           6.13.1 KEY STAKEHOLDERS IN BUYING PROCESS
                    FIGURE 53 INFLUENCE OF STAKEHOLDERS ON BUYING PROCESS FOR TOP THREE SOURCES
                    TABLE 31 INFLUENCE OF STAKEHOLDERS ON BUYING PROCESS FOR TOP THREE SOURCES
           6.13.2 BUYING CRITERIA
                    TABLE 32 KEY CRITERIA FOR SELECTING SUPPLIERS/VENDORS
                    FIGURE 54 KEY CRITERIA FOR SELECTING SUPPLIERS/VENDORS
    6.14 CASE STUDY ANALYSIS 
           6.14.1 BLUE DIAMOND GROWERS PARTNERED WITH GROUP LALA TO ESTABLISH NETWORK IN MEXICO
           6.14.2 KERRY GROUP PLC REVOLUTIONIZED PLANT-BASED PRODUCTS IN ASIA PACIFIC MARKET
           6.14.3 ADM OFFERED NEW PLANT-BASED PROTEINS TO MEET GROWING CONSUMER DEMAND
           6.14.4 GLANBIA LAUNCHED ITS GRAIN PORTFOLIO TO ADDRESS CONSUMERS’ RISING HEALTH CONCERNS
           6.14.5 MGP INGREDIENTS USED WHEAT PROTEIN ISOLATE TO IMPROVE DOUGH STRENGTH AND FREEZER STABILITY
                    TABLE 33 IMPROVED DOUGH POROSITY AND EXTENSIBILITY FOR LONGER PERIOD
    6.15 INVESTMENT AND FUNDING SCENARIO 
                    FIGURE 55 GLOBAL ALTERNATIVE PROTEIN INVESTMENT TREND, 2018–2022
 
7 PROTEIN ALTERNATIVES MARKET, BY SOURCE (Page No. - 142)
    7.1 INTRODUCTION 
           FIGURE 56 PROTEIN ALTERNATIVES MARKET, BY SOURCE, 2024 VS. 2029 (USD MILLION)
           TABLE 34 PROTEIN ALTERNATIVES MARKET, BY SOURCE, 2020–2023 (USD MILLION)
           TABLE 35 MARKET, BY SOURCE, 2024–2029 (USD MILLION)
           TABLE 36 MARKET, BY SOURCE, 2020–2023 (KT)
           TABLE 37 MARKET, BY SOURCE, 2024–2029 (KT)
    7.2 PLANT PROTEIN 
           7.2.1 DIVERSE ARRAY OF PLANT PROTEIN SOURCES WITH SUBSTANTIAL INCREASE IN NEWER SOURCES
                    TABLE 38 PLANT-BASED PROTEIN ALTERNATIVES MARKET, BY SOURCE, 2020–2023 (USD MILLION)
                    TABLE 39 PLANT-BASED PROTEIN ALTERNATIVES MARKET, BY SOURCE, 2024–2029 (USD MILLION)
                    TABLE 40 PLANT-BASED PROTEIN ALTERNATIVES MARKET, BY REGION, 2020–2023 (USD MILLION)
                    TABLE 41 PLANT-BASED PROTEIN ALTERNATIVES MARKET, BY REGION, 2024–2029 (USD MILLION)
                    TABLE 42 PLANT-BASED PROTEIN ALTERNATIVES MARKET, BY REGION, 2020–2023 (KT)
                    TABLE 43 PLANT-BASED PROTEIN ALTERNATIVES MARKET, BY REGION, 2024–2029 (KT)
                    TABLE 44 PLANT-BASED PROTEIN ALTERNATIVES MARKET, BY TYPE, 2020–2023 (USD MILLION)
                    TABLE 45 PLANT-BASED PROTEIN ALTERNATIVES MARKET, BY TYPE, 2024–2029 (USD MILLION)
           7.2.2 SOY
                    TABLE 46 SOY-BASED PROTEIN ALTERNATIVES MARKET, BY REGION, 2020–2023 (USD MILLION)
                    TABLE 47 SOY-BASED PROTEIN ALTERNATIVES MARKET, BY REGION, 2024–2029 (USD MILLION)
                    TABLE 48 SOY-BASED PROTEIN ALTERNATIVES MARKET, BY TYPE, 2020–2023 (USD MILLION)
                    TABLE 49 SOY-BASED PROTEIN ALTERNATIVES MARKET, BY TYPE, 2024–2029 (USD MILLION)
           7.2.3 WHEAT
                    TABLE 50 WHEAT-BASED PROTEIN ALTERNATIVES MARKET, BY REGION, 2020–2023 (USD MILLION)
                    TABLE 51 WHEAT-BASED PROTEIN ALTERNATIVES MARKET, BY REGION, 2024–2029 (USD MILLION)
                    TABLE 52 WHEAT-BASED PROTEIN ALTERNATIVES MARKET, BY TYPE, 2020–2023 (USD MILLION)
                    TABLE 53 WHEAT-BASED PROTEIN ALTERNATIVES MARKET, BY TYPE, 2024–2029 (USD MILLION)
           7.2.4 PEAS
                    TABLE 54 PEA-BASED PROTEIN ALTERNATIVES MARKET, BY REGION, 2020–2023 (USD MILLION)
                    TABLE 55 PEA-BASED PROTEIN ALTERNATIVES MARKET, BY REGION, 2024–2029 (USD MILLION)
                    TABLE 56 PEA-BASED PROTEIN ALTERNATIVES MARKET, BY TYPE, 2020–2023 (USD MILLION)
                    TABLE 57 PEA-BASED PROTEIN ALTERNATIVES MARKET, BY TYPE, 2024–2029 (USD MILLION)
           7.2.5 CANOLA, RICE, OATS, AND POTATOES
                    TABLE 58 CANOLA-, RICE-, OAT-, AND POTATO-BASED PROTEIN ALTERNATIVES MARKET, BY REGION, 2020–2023 (USD MILLION)
                    TABLE 59 CANOLA-, RICE-, OAT-, AND POTATO-BASED PROTEIN ALTERNATIVES MARKET, BY REGION, 2024–2029 (USD MILLION)
                    TABLE 60 CANOLA-, RICE-, OAT-, AND POTATO-BASED PROTEIN ALTERNATIVES MARKET, BY TYPE, 2020–2023 (USD MILLION)
                    TABLE 61 CANOLA-, RICE-, OAT-, AND POTATO-BASED PROTEIN ALTERNATIVES MARKET, BY TYPE, 2024–2029 (USD MILLION)
           7.2.6 BEANS & SEEDS
                    TABLE 62 BEAN- & SEED-BASED PROTEIN ALTERNATIVES MARKET, BY REGION, 2020–2023 (USD MILLION)
                    TABLE 63 BEAN- & SEED-BASED PROTEIN ALTERNATIVES MARKET, BY REGION, 2024–2029 (USD MILLION)
                    TABLE 64 BEAN- & SEED-BASED PROTEIN ALTERNATIVES MARKET, BY TYPE, 2020–2023 (USD MILLION)
                    TABLE 65 BEAN- & SEED-BASED PROTEIN ALTERNATIVES MARKET, BY TYPE, 2024–2029 (USD MILLION)
           7.2.7 OTHER PLANT PROTEINS
                    TABLE 66 OTHER PLANT PROTEIN ALTERNATIVES MARKET, BY REGION, 2020–2023 (USD MILLION)
                    TABLE 67 OTHER PLANT PROTEIN ALTERNATIVES MARKET, BY REGION, 2024–2029 (USD MILLION)
                    TABLE 68 OTHER PLANT PROTEIN ALTERNATIVES MARKET, BY TYPE, 2020–2023 (USD MILLION)
                    TABLE 69 OTHER PLANT PROTEIN ALTERNATIVES MARKET, BY TYPE, 2024–2029 (USD MILLION)
    7.3 INSECT PROTEIN 
           7.3.1 RISE IN AWARENESS OF PROTEIN CONTENT IN EDIBLE INSECTS HAMPERED BY INFRASTRUCTURAL CONSTRAINTS
                    TABLE 70 INSECT PROTEIN ALTERNATIVES MARKET, BY SOURCE, 2020–2023 (USD MILLION)
                    TABLE 71 INSECT PROTEIN ALTERNATIVES MARKET, BY SOURCE, 2024–2029 (USD MILLION)
                    TABLE 72 INSECT PROTEIN ALTERNATIVES MARKET, BY REGION, 2020–2023 (USD MILLION)
                    TABLE 73 INSECT PROTEIN ALTERNATIVES MARKET, BY REGION, 2024–2029 (USD MILLION)
                    TABLE 74 INSECT PROTEIN ALTERNATIVES MARKET, BY REGION, 2020–2023 (KT)
                    TABLE 75 INSECT PROTEIN ALTERNATIVES MARKET, BY REGION, 2024–2029 (KT)
           7.3.2 CRICKETS
                    TABLE 76 CRICKET-BASED PROTEIN ALTERNATIVES MARKET, BY REGION, 2020–2023 (USD MILLION)
                    TABLE 77 CRICKET-BASED PROTEIN ALTERNATIVES MARKET, BY REGION, 2024–2029 (USD MILLION)
           7.3.3 MEALWORMS
                    TABLE 78 MEALWORM-BASED PROTEIN ALTERNATIVES MARKET, BY REGION, 2020–2023 (USD MILLION)
                    TABLE 79 MEALWORM-BASED PROTEIN ALTERNATIVES MARKET, BY REGION, 2024–2029 (USD MILLION)
           7.3.4 LOCUSTS
                    TABLE 80 LOCUST-BASED PROTEIN ALTERNATIVES MARKET, BY REGION, 2020–2023 (USD MILLION)
                    TABLE 81 LOCUST-BASED PROTEIN ALTERNATIVES MARKET, BY REGION, 2024–2029 (USD MILLION)
           7.3.5 OTHER INSECT PROTEINS
                    TABLE 82 OTHER INSECT PROTEIN ALTERNATIVES MARKET, BY REGION, 2020–2023 (USD MILLION)
                    TABLE 83 OTHER INSECT PROTEIN ALTERNATIVES MARKET, BY REGION, 2024–2029 (USD MILLION)
    7.4 MICROBIAL PROTEIN 
           7.4.1 GROWTH IN ACCEPTANCE OF MICROBIAL PROTEIN IN AQUACULTURE AS FISHMEAL REPLACEMENT
                    TABLE 84 MICROBIAL PROTEIN ALTERNATIVES MARKET, BY SOURCE, 2020–2023 (USD MILLION)
                    TABLE 85 MICROBIAL PROTEIN ALTERNATIVES MARKET, BY SOURCE, 2024–2029 (USD MILLION)
                    TABLE 86 MICROBIAL PROTEIN ALTERNATIVES MARKET, BY REGION, 2020–2023 (USD MILLION)
                    TABLE 87 MICROBIAL PROTEIN ALTERNATIVES MARKET, BY REGION, 2024–2029 (USD MILLION)
                    TABLE 88 MICROBIAL PROTEIN ALTERNATIVES MARKET, BY REGION, 2020–2023 (KT)
                    TABLE 89 MICROBIAL PROTEIN ALTERNATIVES MARKET, BY REGION, 2024–2029 (KT)
           7.4.2 ALGAE
                    TABLE 90 ALGAE-BASED PROTEIN ALTERNATIVES MARKET, BY REGION, 2020–2023 (USD MILLION)
                    TABLE 91 ALGAE-BASED PROTEIN ALTERNATIVES MARKET, BY REGION, 2024–2029 (USD MILLION)
           7.4.3 FUNGI
                    TABLE 92 FUNGI-BASED PROTEIN ALTERNATIVES MARKET, BY REGION, 2020–2023 (USD MILLION)
                    TABLE 93 FUNGI-BASED PROTEIN ALTERNATIVES MARKET, BY REGION, 2024–2029 (USD MILLION)
           7.4.4 BACTERIA
                    TABLE 94 BACTERIA-BASED PROTEIN ALTERNATIVES MARKET, BY REGION, 2020–2023 (USD MILLION)
                    TABLE 95 BACTERIA-BASED PROTEIN ALTERNATIVES MARKET, BY REGION, 2024–2029 (USD MILLION)
           7.4.5 OTHER MICROBIAL PROTEINS
                    TABLE 96 OTHER MICROBIAL PROTEIN ALTERNATIVES MARKET, BY REGION, 2020–2023 (USD MILLION)
                    TABLE 97 OTHER MICROBIAL PROTEIN ALTERNATIVES MARKET, BY REGION, 2024–2029 (USD MILLION)
 
8 PROTEIN ALTERNATIVES MARKET, BY NATURE (Page No. - 171)
    8.1 INTRODUCTION 
           FIGURE 57 PROTEIN ALTERNATIVES MARKET, BY NATURE, 2024 VS. 2029 (USD MILLION)
           TABLE 98 MARKET, BY NATURE, 2020–2023 (USD MILLION)
           TABLE 99 MARKET, BY NATURE, 2024–2029 (USD MILLION)
    8.2 CONVENTIONAL 
           8.2.1 GROWTH IN UTILIZATION OF PLANT-BASED FOOD PRODUCTS IN FOOD AND FEED INDUSTRIES
                    TABLE 100 CONVENTIONAL PLANT-BASED PROTEIN MARKET, BY REGION, 2020–2023 (USD MILLION)
                    TABLE 101 CONVENTIONAL PLANT-BASED PROTEIN MARKET, BY REGION, 2024–2029 (USD MILLION)
    8.3 ORGANIC 
           8.3.1 GROWTH OF ORGANIC PLANT-BASED PROTEIN PRODUCTS TO BE FUELED BY RISING DEMAND FOR CLEAN-LABEL INGREDIENTS
                    TABLE 102 ORGANIC PLANT-BASED PROTEIN MARKET, BY REGION, 2020–2023 (USD MILLION)
                    TABLE 103 ORGANIC PLANT-BASED PROTEIN MARKET, BY REGION, 2024–2029 (USD MILLION)
 
9 PROTEIN ALTERNATIVES MARKET, BY FORM (Page No. - 176)
    9.1 INTRODUCTION 
           FIGURE 58 PROTEIN ALTERNATIVES MARKET, BY FORM, 2024 VS. 2029 (USD MILLION)
           TABLE 104 PROTEIN ALTERNATIVES MARKET, BY FORM, 2020–2023 (USD MILLION)
           TABLE 105 MARKET, BY FORM, 2024–2029 (USD MILLION)
    9.2 DRY 
           9.2.1 GREATER VERSATILITY TO INCREASE APPLICATION OF DRY PROTEIN IN PLANT-BASED FOOD & BEVERAGE INDUSTRY
                    TABLE 106 DRY PROTEIN ALTERNATIVES MARKET, BY REGION, 2020–2023 (USD MILLION)
                    TABLE 107 DRY PROTEIN ALTERNATIVES MARKET, BY REGION, 2024–2029 (USD MILLION)
    9.3 LIQUID 
           9.3.1 HIGHER PROTEIN ENRICHMENT REQUIREMENTS IN LIQUID NUTRITIONAL SUPPLEMENTS
                    TABLE 108 LIQUID PROTEIN ALTERNATIVES MARKET, BY REGION, 2020–2023 (USD MILLION)
                    TABLE 109 LIQUID PROTEIN ALTERNATIVES MARKET, BY REGION, 2024–2029 (USD MILLION)
 
10 PROTEIN ALTERNATIVES MARKET, BY APPLICATION (Page No. - 181)
     10.1 INTRODUCTION 
               FIGURE 59 PROTEIN ALTERNATIVES MARKET, BY APPLICATION, 2024 VS. 2029 (USD MILLION)
               TABLE 110 MARKET, BY APPLICATION, 2020–2023 (USD MILLION)
               TABLE 111 MARKET, BY APPLICATION, 2024–2029 (USD MILLION)
     10.2 FOOD & BEVERAGES 
             10.2.1 RISE IN CONSUMPTION OF PLANT-BASED MEAT AND DAIRY ALTERNATIVES
                       TABLE 112 PROTEIN ALTERNATIVES MARKET IN FOOD & BEVERAGES, BY REGION, 2020–2023 (USD MILLION)
                       TABLE 113 MARKET IN FOOD & BEVERAGES, BY REGION, 2024–2029 (USD MILLION)
                       TABLE 114 MARKET IN FOOD & BEVERAGES, BY SUBTYPE, 2020–2023 (USD MILLION)
                       TABLE 115 MARKET IN FOOD & BEVERAGES, BY SUBTYPE, 2024–2029 (USD MILLION)
             10.2.2 MEAT ALTERNATIVES
                       TABLE 116 PROTEIN ALTERNATIVES MARKET IN MEAT ALTERNATIVES, BY REGION, 2020–2023 (USD MILLION)
                       TABLE 117 MARKET IN MEAT ALTERNATIVES, BY REGION, 2024–2029 (USD MILLION)
                       10.2.2.1 Meatballs & nuggets
                       10.2.2.2 Sausages
                       10.2.2.3 Burgers
                       10.2.2.4 Other Meat Alternatives
                                   FIGURE 60 PROTEIN ALTERNATIVES MARKET SHARE IN MEAT ALTERNATIVES, BY SUBAPPLICATION, 2023
             10.2.3 DAIRY ALTERNATIVES
                       TABLE 118 PROTEIN ALTERNATIVES MARKET IN DAIRY ALTERNATIVES, BY REGION, 2020–2023 (USD MILLION)
                       TABLE 119 MARKET IN DAIRY ALTERNATIVES, BY REGION, 2024–2029 (USD MILLION)
                       10.2.3.1 Milk Substitute
                                   FIGURE 61 PLANT-BASED MILK SALES GROWTH, 2016–2022 (USD MILLION)
                       10.2.3.2 Cheese Alternatives
                       10.2.3.3 Yogurt Substitutes
                       10.2.3.4 Ice-cream Substitutes
                                   FIGURE 62 PROTEIN ALTERNATIVES MARKET SHARE IN DAIRY ALTERNATIVES, BY SUBAPPLICATION, 2023
             10.2.4 PROTEIN SUPPLEMENTS
                       TABLE 120 PROTEIN ALTERNATIVES MARKET IN PROTEIN SUPPLEMENTS, BY REGION, 2020–2023 (USD MILLION)
                       TABLE 121 MARKET IN PROTEIN SUPPLEMENTS, BY REGION, 2024–2029 (USD MILLION)
                       10.2.4.1 Bars
                       10.2.4.2 Powders
                       10.2.4.3 Protein Shakes
                       10.2.4.4 Other Protein Supplements
                                   FIGURE 63 PROTEIN ALTERNATIVES MARKET SHARE IN PROTEIN SUPPLEMENTS, BY SUBAPPLICATION, 2023
             10.2.5 FUNCTIONAL FOOD
                       TABLE 122 PROTEIN ALTERNATIVES MARKET IN FUNCTIONAL FOOD, BY REGION, 2020–2023 (USD MILLION)
                       TABLE 123 MARKET IN FUNCTIONAL FOOD, BY REGION, 2024–2029 (USD MILLION)
                       10.2.5.1 Fortified Cereals
                       10.2.5.2 RTD Beverages
                       10.2.5.3 Other Functional Food
                                   FIGURE 64 PROTEIN ALTERNATIVES MARKET IN FUNCTIONAL FOOD, BY SUBAPPLICATION, 2023
             10.2.6 CONVENIENCE FOOD
                       TABLE 124 PROTEIN ALTERNATIVES MARKET IN CONVENIENCE FOOD, BY REGION, 2020–2023 (USD MILLION)
                       TABLE 125 MARKET IN CONVENIENCE FOOD, BY REGION, 2024–2029 (USD MILLION)
                       10.2.6.1 Baked Goods
                       10.2.6.2 Snacks
                       10.2.6.3 Sauces, Gravies, and Soups
                       10.2.6.4 Spreads
                       10.2.6.5 Other Convenience Foods
                                   FIGURE 65 PROTEIN ALTERNATIVES MARKET IN CONVENIENCE FOOD, BY SUBAPPLICATION, 2023
     10.3 ANIMAL FEED 
             10.3.1 GROWING DEMAND FOR CLEAN-LABEL AND SUSTAINABLE FEED PRODUCTS
                       TABLE 126 PROTEIN ALTERNATIVES MARKET IN ANIMAL FEED, BY REGION, 2020–2023 (USD MILLION)
                       TABLE 127 MARKET IN ANIMAL FEED, BY REGION, 2024–2029 (USD MILLION)
                       TABLE 128 MARKET IN ANIMAL FEED, BY SUBTYPE, 2020–2023 (USD MILLION)
                       TABLE 129 MARKET IN ANIMAL FEED, BY SUBTYPE, 2024–2029 (USD MILLION)
             10.3.2 POULTRY
                       TABLE 130 PROTEIN ALTERNATIVES MARKET IN POULTRY FEED, BY REGION, 2020–2023 (USD MILLION)
                       TABLE 131 MARKET IN POULTRY FEED, BY REGION, 2024–2029 (USD MILLION)
             10.3.3 SWINE
                       TABLE 132 PROTEIN ALTERNATIVES MARKET IN SWINE FEED, BY REGION, 2020–2023 (USD MILLION)
                       TABLE 133 MARKET IN SWINE FEED, BY REGION, 2024–2029 (USD MILLION)
             10.3.4 RUMINANTS
                       TABLE 134 PROTEIN ALTERNATIVES MARKET IN RUMINANT FEED, BY REGION, 2020–2023 (USD MILLION)
                       TABLE 135 MARKET IN RUMINANT FEED, BY REGION, 2024–2029 (USD MILLION)
             10.3.5 AQUACULTURE
                       TABLE 136 PROTEIN ALTERNATIVES MARKET IN AQUAFEED, BY REGION, 2020–2023 (USD MILLION)
                       TABLE 137 MARKET IN AQUAFEED, BY REGION, 2024–2029 (USD MILLION)
     10.4 PET FOOD 
             10.4.1 VARIETY OF ALTERNATIVE PROTEINS AVAILABLE ALLOWS FOR DIVERSIFICATION AND INNOVATION IN PET FOOD PRODUCTS
                       TABLE 138 PROTEIN ALTERNATIVES MARKET IN PET FOOD, BY REGION, 2020–2023 (USD MILLION)
                       TABLE 139 MARKET IN PET FOOD, BY REGION, 2024–2029 (USD MILLION)
                       TABLE 140 MARKET IN PET FOOD, BY SUBTYPE, 2020–2023 (USD MILLION)
                       TABLE 141 MARKET IN PET FOOD, BY SUBTYPE, 2024–2029 (USD MILLION)
             10.4.2 CAT FOOD
                       TABLE 142 PROTEIN ALTERNATIVES MARKET IN CAT FOOD, BY REGION, 2020–2023 (USD MILLION)
                       TABLE 143 MARKET IN CAT FOOD, BY REGION, 2024–2029 (USD MILLION)
             10.4.3 DOG FOOD
                       TABLE 144 PROTEIN ALTERNATIVES MARKET IN DOG FOOD, BY REGION, 2020–2023 (USD MILLION)
                       TABLE 145 MARKET IN DOG FOOD, BY REGION, 2024–2029 (USD MILLION)
             10.4.4 OTHER PET FOOD
                       TABLE 146 PROTEIN ALTERNATIVES MARKET IN OTHER PET FOOD, BY REGION, 2020–2023 (USD MILLION)
                       TABLE 147 MARKET IN OTHER PET FOOD, BY REGION, 2024–2029 (USD MILLION)
 
11 PROTEIN ALTERNATIVES MARKET, BY PRODUCTION PROCESS (Page No. - 210)
     11.1 INTRODUCTION 
     11.2 PLANT PROTEIN PRODUCTION PROCESS 
             11.2.1 EXTRUSION
                       11.2.1.1 Protein extraction
                       11.2.1.2 Protein purification
                       11.2.1.3 Heat treatment
                       11.2.1.4 Starch/fiber processing
                       11.2.1.5 Whey treatment system
     11.3 INSECT PROTEIN PRODUCTION PROCESS 
             11.3.1 ULTRASONIC EXTRACTION
                       11.3.1.1 Preparation of Insect Larvae
                       11.3.1.2 Larval Disruption
                       11.3.1.3 Defatting
                       11.3.1.4 Ultrasonication
                       11.3.1.5 Centrifugation or Filtration
                       11.3.1.6 Protein Analysis and Storage
     11.4 MICROBIAL PROTEIN PRODUCTION PROCESS 
             11.4.1 ULTRASOUND-ASSISTED EXTRACTION (UAE)
 
12 PROTEIN ALTERNATIVES MARKET, BY REGION (Page No. - 213)
     12.1 INTRODUCTION 
               FIGURE 66 THAILAND TO RECORD HIGHEST GROWTH DURING FORECAST PERIOD
               TABLE 148 PROTEIN ALTERNATIVES MARKET, BY REGION, 2020–2023 (USD MILLION)
               TABLE 149 MARKET, BY REGION, 2024–2029 (USD MILLION)
               TABLE 150 MARKET, BY REGION, 2020–2023 (KT)
               TABLE 151 MARKET, BY REGION, 2024–2029 (KT)
     12.2 NORTH AMERICA 
               FIGURE 67 NORTH AMERICA: PROTEIN ALTERNATIVES MARKET SNAPSHOT
             12.2.1 NORTH AMERICA: RECESSION IMPACT ANALYSIS
                       FIGURE 68 NORTH AMERICA: INFLATION RATES, BY COUNTRY, 2017–2022
                       FIGURE 69 NORTH AMERICA: RECESSION IMPACT ANALYSIS
                       TABLE 152 NORTH AMERICA: PROTEIN ALTERNATIVES MARKET, BY COUNTRY, 2020–2023 (USD MILLION)
                       TABLE 153 NORTH AMERICA: MARKET, BY COUNTRY, 2024–2029 (USD MILLION)
                       TABLE 154 NORTH AMERICA: MARKET, BY SOURCE, 2020–2023 (USD MILLION)
                       TABLE 155 NORTH AMERICA: MARKET, BY SOURCE, 2024–2029 (USD MILLION)
                       TABLE 156 NORTH AMERICA: MARKET, BY SOURCE, 2020–2023 (KT)
                       TABLE 157 NORTH AMERICA: MARKET, BY SOURCE, 2024–2029 (KT)
                       TABLE 158 NORTH AMERICA: MARKET FOR PLANT PROTEIN, BY TYPE, 2020–2023 (USD MILLION)
                       TABLE 159 NORTH AMERICA: MARKET FOR PLANT PROTEIN, BY TYPE, 2024–2029 (USD MILLION)
                       TABLE 160 NORTH AMERICA: MARKET FOR INSECT PROTEIN, BY TYPE, 2020–2023 (USD MILLION)
                       TABLE 161 NORTH AMERICA: MARKET FOR INSECT PROTEIN, BY TYPE, 2024–2029 (USD MILLION)
                       TABLE 162 NORTH AMERICA: MARKET FOR MICROBIAL PROTEIN, BY TYPE, 2020–2023 (USD MILLION)
                       TABLE 163 NORTH AMERICA: MARKET FOR MICROBIAL PROTEIN, BY TYPE, 2024–2029 (USD MILLION)
                       TABLE 164 NORTH AMERICA: MARKET, BY APPLICATION, 2020–2023 (USD MILLION)
                       TABLE 165 NORTH AMERICA: MARKET, BY APPLICATION, 2024–2029 (USD MILLION)
                       TABLE 166 NORTH AMERICA: MARKET, BY FORM, 2020–2023 (USD MILLION)
                       TABLE 167 NORTH AMERICA: MARKET, BY FORM, 2024–2029 (USD MILLION)
                       TABLE 168 NORTH AMERICA: MARKET, BY NATURE, 2020–2023 (USD MILLION)
                       TABLE 169 NORTH AMERICA: MARKET, BY NATURE, 2024–2029 (USD MILLION)
             12.2.2 US
                       12.2.2.1 Rise in awareness regarding environmental and personal health benefits to drive preference for plant and insect protein
                                   TABLE 170 US: PROTEIN ALTERNATIVES MARKET, BY SOURCE, 2020–2023 (USD MILLION)
                                   TABLE 171 US: MARKET, BY SOURCE, 2024–2029 (USD MILLION)
             12.2.3 CANADA
                       12.2.3.1 Rise in investments by prominent players to drive production
                                   TABLE 172 CANADA: PROTEIN ALTERNATIVES MARKET, BY SOURCE, 2020–2023 (USD MILLION)
                                   TABLE 173 CANADA: MARKET, BY SOURCE, 2024–2029 (USD MILLION)
             12.2.4 MEXICO
                       12.2.4.1 Evolving consumer preferences and increasing demand for nutritious pet foods
                                   TABLE 174 MEXICO: PROTEIN ALTERNATIVES MARKET, BY SOURCE, 2020–2023 (USD MILLION)
                                   TABLE 175 MEXICO: MARKET, BY SOURCE, 2024–2029 (USD MILLION)
     12.3 EUROPE 
             12.3.1 EUROPE: RECESSION IMPACT ANALYSIS
                       FIGURE 70 EUROPE: INFLATION RATES, BY COUNTRY, 2017–2022
                       FIGURE 71 EUROPE: RECESSION IMPACT ANALYSIS
                       TABLE 176 EUROPE: PROTEIN ALTERNATIVES MARKET, BY COUNTRY, 2020–2023 (USD MILLION)
                       TABLE 177 EUROPE: MARKET, BY COUNTRY, 2024–2029 (USD MILLION)
                       TABLE 178 EUROPE: PROTEIN ALTERNATIVES MARKET, BY SOURCE, 2020–2023 (USD MILLION)
                       TABLE 179 EUROPE: MARKET, BY SOURCE, 2024–2029 (USD MILLION)
                       TABLE 180 EUROPE: MARKET, BY SOURCE, 2020–2023 (KT)
                       TABLE 181 EUROPE: MARKET, BY SOURCE, 2024–2029 (KT)
                       TABLE 182 EUROPE: MARKET FOR PLANT PROTEIN, BY TYPE, 2020–2023 (USD MILLION)
                       TABLE 183 EUROPE: MARKET FOR PLANT PROTEIN, BY TYPE, 2024–2029 (USD MILLION)
                       TABLE 184 EUROPE: MARKET FOR INSECT PROTEIN, BY TYPE, 2020–2023 (USD MILLION)
                       TABLE 185 EUROPE: MARKET FOR INSECT PROTEIN, BY TYPE, 2024–2029 (USD MILLION)
                       TABLE 186 EUROPE: MARKET FOR MICROBIAL PROTEIN, BY TYPE, 2020–2023 (USD MILLION)
                       TABLE 187 EUROPE: MARKET FOR MICROBIAL PROTEIN, BY TYPE, 2024–2029 (USD MILLION)
                       TABLE 188 EUROPE: MARKET, BY APPLICATION, 2020–2023 (USD MILLION)
                       TABLE 189 EUROPE: MARKET, BY APPLICATION, 2024–2029 (USD MILLION)
                       TABLE 190 EUROPE: MARKET, BY FORM, 2020–2023 (USD MILLION)
                       TABLE 191 EUROPE: MARKET, BY FORM, 2024–2029 (USD MILLION)
                       TABLE 192 EUROPE: MARKET, BY NATURE, 2020–2023 (USD MILLION)
                       TABLE 193 EUROPE: MARKET, BY NATURE, 2024–2029 (USD MILLION)
             12.3.2 GERMANY
                       12.3.2.1 Greater dependence on plant-based foods and high adoption rate of flexitarian diets
                                   TABLE 194 GERMANY: PROTEIN ALTERNATIVES MARKET, BY SOURCE, 2020–2023 (USD MILLION)
                                   TABLE 195 GERMANY: MARKET, BY SOURCE, 2024–2029 (USD MILLION)
             12.3.3 UK
                       12.3.3.1 Increase in vegan population in UK
                                   TABLE 196 UK: PROTEIN ALTERNATIVES MARKET, BY SOURCE, 2020–2023 (USD MILLION)
                                   TABLE 197 UK: MARKET, BY SOURCE, 2024–2029 (USD MILLION)
             12.3.4 ITALY
                       12.3.4.1 Rapidly changing consumer preferences from conventional to plant-based protein
                                   TABLE 198 ITALY: PROTEIN ALTERNATIVES MARKET, BY SOURCE, 2020–2023 (USD MILLION)
                                   TABLE 199 ITALY: MARKET, BY SOURCE, 2024–2029 (USD MILLION)
             12.3.5 NETHERLANDS
                       12.3.5.1 Increase in popularity of plant-based foods due to their health and environmental benefits
                                   TABLE 200 NETHERLANDS: PROTEIN ALTERNATIVES MARKET, BY SOURCE, 2020–2023 (USD MILLION)
                                   TABLE 201 NETHERLANDS: MARKET, BY SOURCE, 2024–2029 (USD MILLION)
             12.3.6 FRANCE
                       12.3.6.1 Government support to develop domestic plant protein production and reduce imports
                                   TABLE 202 FRANCE: PROTEIN ALTERNATIVES MARKET, BY SOURCE, 2020–2023 (USD MILLION)
                                   TABLE 203 FRANCE: MARKET, BY SOURCE, 2024–2029 (USD MILLION)
             12.3.7 REST OF EUROPE
                       TABLE 204 REST OF EUROPE: PROTEIN ALTERNATIVES MARKET, BY SOURCE, 2020–2023 (USD MILLION)
                       TABLE 205 REST OF EUROPE: MARKET, BY SOURCE, 2024–2029 (USD MILLION)
     12.4 ASIA PACIFIC 
               FIGURE 72 ASIA PACIFIC: PROTEIN ALTERNATIVES MARKET SNAPSHOT
             12.4.1 ASIA PACIFIC: RECESSION IMPACT ANALYSIS
                       FIGURE 73 ASIA PACIFIC: INFLATION RATES, BY KEY COUNTRY, 2017–2022
                       FIGURE 74 ASIA PACIFIC: RECESSION IMPACT ANALYSIS
                       TABLE 206 ASIA PACIFIC: PROTEIN ALTERNATIVES MARKET, BY COUNTRY, 2020–2023 (USD MILLION)
                       TABLE 207 ASIA PACIFIC: MARKET, BY COUNTRY, 2024–2029 (USD MILLION)
                       TABLE 208 ASIA PACIFIC: MARKET, BY SOURCE, 2020–2023 (USD MILLION)
                       TABLE 209 ASIA PACIFIC: MARKET, BY SOURCE, 2024–2029 (USD MILLION)
                       TABLE 210 ASIA PACIFIC: MARKET, BY SOURCE, 2020–2023 (KT)
                       TABLE 211 ASIA PACIFIC: MARKET, BY SOURCE, 2024–2029 (KT)
                       TABLE 212 ASIA PACIFIC: MARKET FOR PLANT PROTEIN, BY TYPE, 2020–2023 (USD MILLION)
                       TABLE 213 ASIA PACIFIC: MARKET FOR PLANT PROTEIN, BY TYPE, 2024–2029 (USD MILLION)
                       TABLE 214 ASIA PACIFIC: MARKET FOR INSECT PROTEIN, BY TYPE, 2020–2023 (USD MILLION)
                       TABLE 215 ASIA PACIFIC: MARKET FOR INSECT PROTEIN, BY TYPE, 2024–2029 (USD MILLION)
                       TABLE 216 ASIA PACIFIC: MARKET FOR MICROBIAL PROTEIN, BY TYPE, 2020–2023 (USD MILLION)
                       TABLE 217 ASIA PACIFIC: MARKET FOR MICROBIAL PROTEIN, BY TYPE, 2024–2029 (USD MILLION)
                       TABLE 218 ASIA PACIFIC: MARKET, BY APPLICATION, 2020–2023 (USD MILLION)
                       TABLE 219 ASIA PACIFIC: MARKET, BY APPLICATION, 2024–2029 (USD MILLION)
                       TABLE 220 ASIA PACIFIC: MARKET, BY FORM, 2020–2023 (USD MILLION)
                       TABLE 221 ASIA PACIFIC: MARKET, BY FORM, 2024–2029 (USD MILLION)
                       TABLE 222 ASIA PACIFIC: MARKET, BY NATURE, 2020–2023 (USD MILLION)
                       TABLE 223 ASIA PACIFIC: MARKET, BY NATURE, 2024–2029 (USD MILLION)
             12.4.2 CHINA
                       12.4.2.1 Demand for products with health benefits to drive market growth
                                   TABLE 224 CHINA: PROTEIN ALTERNATIVES MARKET, BY SOURCE, 2020–2023 (USD MILLION)
                                   TABLE 225 CHINA: MARKET, BY SOURCE, 2024–2029 (USD MILLION)
             12.4.3 JAPAN
                       12.4.3.1 Government support and presence of active players to drive market
                                   TABLE 226 JAPAN: PROTEIN ALTERNATIVES MARKET, BY SOURCE, 2020–2023 (USD MILLION)
                                   TABLE 227 JAPAN: MARKET, BY SOURCE, 2024–2029 (USD MILLION)
             12.4.4 INDIA
                       12.4.4.1 Evolving dietary preferences and rise in incidence of coronary heart diseases to drive demand for plant-based protein
                                   TABLE 228 INDIA: PROTEIN ALTERNATIVES MARKET, BY SOURCE, 2020–2023 (USD MILLION)
                                   TABLE 229 INDIA: MARKET, BY SOURCE, 2024–2029 (USD MILLION)
             12.4.5 AUSTRALIA & NEW ZEALAND
                       12.4.5.1 Investments from key players and rising vegan population to drive growth
                                   TABLE 230 AUSTRALIA & NEW ZEALAND: PROTEIN ALTERNATIVES MARKET, BY SOURCE, 2020–2023 (USD MILLION)
                                   TABLE 231 AUSTRALIA & NEW ZEALAND: MARKET, BY SOURCE, 2024–2029 (USD MILLION)
             12.4.6 MALAYSIA
                       12.4.6.1 Rise in export opportunities for insect protein
                                   TABLE 232 MALAYSIA: PROTEIN ALTERNATIVES MARKET, BY SOURCE, 2020–2023 (USD MILLION)
                                   TABLE 233 MALAYSIA: MARKET, BY SOURCE, 2024–2029 (USD MILLION)
             12.4.7 THAILAND
                       12.4.7.1 Rise in awareness regarding environmental impact of meat industry
                                   TABLE 234 THAILAND: PROTEIN ALTERNATIVES MARKET, BY SOURCE, 2020–2023 (USD MILLION)
                                   TABLE 235 THAILAND: MARKET, BY SOURCE, 2024–2029 (USD MILLION)
             12.4.8 REST OF ASIA PACIFIC
                       TABLE 236 REST OF ASIA PACIFIC: PROTEIN ALTERNATIVES MARKET, BY SOURCE, 2020–2023 (USD MILLION)
                       TABLE 237 REST OF ASIA PACIFIC: MARKET, BY SOURCE, 2024–2029 (USD MILLION)
     12.5 SOUTH AMERICA 
             12.5.1 SOUTH AMERICA: RECESSION IMPACT ANALYSIS
                       FIGURE 75 SOUTH AMERICA: INFLATION RATES, BY KEY COUNTRY, 2017–2022
                       FIGURE 76 SOUTH AMERICA: RECESSION IMPACT ANALYSIS
                       TABLE 238 SOUTH AMERICA: PROTEIN ALTERNATIVES MARKET, BY COUNTRY, 2020–2023 (USD MILLION)
                       TABLE 239 SOUTH AMERICA: MARKET, BY COUNTRY, 2024–2029 (USD MILLION)
                       TABLE 240 SOUTH AMERICA: MARKET, BY SOURCE, 2020–2023 (USD MILLION)
                       TABLE 241 SOUTH AMERICA: MARKET, BY SOURCE, 2024–2029 (USD MILLION)
                       TABLE 242 SOUTH AMERICA: MARKET, BY SOURCE, 2020–2023 (KT)
                       TABLE 243 SOUTH AMERICA: MARKET, BY SOURCE, 2024–2029 (KT)
                       TABLE 244 SOUTH AMERICA: MARKET FOR PLANT PROTEIN, BY TYPE, 2020–2023 (USD MILLION)
                       TABLE 245 SOUTH AMERICA: MARKET FOR PLANT PROTEIN, BY TYPE, 2024–2029 (USD MILLION)
                       TABLE 246 SOUTH AMERICA: MARKET FOR INSECT PROTEIN, BY TYPE, 2020–2023 (USD MILLION)
                       TABLE 247 SOUTH AMERICA: PROTEIN ALTERNATIVES MARKET FOR INSECT PROTEIN, BY TYPE, 2024–2029 (USD MILLION)
                       TABLE 248 SOUTH AMERICA: MARKET FOR MICROBIAL PROTEIN, BY TYPE, 2020–2023 (USD MILLION)
                       TABLE 249 SOUTH AMERICA: MARKET FOR MICROBIAL PROTEIN, BY TYPE, 2024–2029 (USD MILLION)
                       TABLE 250 SOUTH AMERICA: MARKET, BY APPLICATION, 2020–2023 (USD MILLION)
                       TABLE 251 SOUTH AMERICA: MARKET, BY APPLICATION, 2024–2029 (USD MILLION)
                       TABLE 252 SOUTH AMERICA: MARKET, BY FORM, 2020–2023 (USD MILLION)
                       TABLE 253 SOUTH AMERICA: MARKET, BY FORM, 2024–2029 (USD MILLION)
                       TABLE 254 SOUTH AMERICA: MARKET, BY NATURE, 2020–2023 (USD MILLION)
                       TABLE 255 SOUTH AMERICA: MARKET, BY NATURE, 2024–2029 (USD MILLION)
                       12.5.2 BRAZIL
                       12.5.2.1 High processing and export capabilities coupled with increased adoption of plant-based foods
                                   TABLE 256 BRAZIL: PROTEIN ALTERNATIVES MARKET, BY SOURCE, 2020–2023 (USD MILLION)
                                   TABLE 257 BRAZIL: MARKET, BY SOURCE, 2024–2029 (USD MILLION)
             12.5.3 ARGENTINA
                       12.5.3.1 Environmental, nutritional, and animal welfare concerns among youth to drive demand for plant-based protein
                                   TABLE 258 ARGENTINA: PROTEIN ALTERNATIVES MARKET, BY SOURCE, 2020–2023 (USD MILLION)
                                   TABLE 259 ARGENTINA: MARKET, BY SOURCE, 2024–2029 (USD MILLION)
             12.5.4 REST OF SOUTH AMERICA
                       TABLE 260 REST OF SOUTH AMERICA: PROTEIN ALTERNATIVES MARKET, BY SOURCE, 2020–2023 (USD MILLION)
                       TABLE 261 REST OF SOUTH AMERICA: MARKET, BY SOURCE, 2024–2029 (USD MILLION)
     12.6 REST OF THE WORLD (ROW) 
             12.6.1 ROW: RECESSION IMPACT ANALYSIS
                       FIGURE 77 ROW: INFLATION RATES, BY KEY COUNTRY, 2017–2022
                       FIGURE 78 ROW: RECESSION IMPACT ANALYSIS, 2022
                       TABLE 262 ROW: PROTEIN ALTERNATIVES MARKET, BY REGION, 2020–2023 (USD MILLION)
                       TABLE 263 ROW: MARKET, BY REGION, 2024–2029 (USD MILLION)
                       TABLE 264 ROW: MARKET, BY SOURCE, 2020–2023 (USD MILLION)
                       TABLE 265 ROW: MARKET, BY SOURCE, 2024–2029 (USD MILLION)
                       TABLE 266 ROW: MARKET, BY SOURCE, 2020–2023 (KT)
                       TABLE 267 ROW: MARKET, BY SOURCE, 2024–2029 (KT)
                       TABLE 268 ROW: MARKET FOR PLANT PROTEIN, BY TYPE, 2020–2023 (USD MILLION)
                       TABLE 269 ROW: MARKET FOR PLANT PROTEIN, BY TYPE, 2024–2029 (USD MILLION)
                       TABLE 270 ROW: MARKET FOR INSECT PROTEIN, BY TYPE, 2020–2023 (USD MILLION)
                       TABLE 271 ROW: MARKET FOR INSECT PROTEIN, BY TYPE, 2024–2029 (USD MILLION)
                       TABLE 272 ROW: MARKET FOR MICROBIAL PROTEIN, BY TYPE, 2020–2023 (USD MILLION)
                       TABLE 273 ROW: MARKET FOR MICROBIAL PROTEIN, BY TYPE, 2024–2029 (USD MILLION)
                       TABLE 274 ROW: MARKET, BY APPLICATION, 2020–2023 (USD MILLION)
                       TABLE 275 ROW: MARKET, BY APPLICATION, 2024–2029 (USD MILLION)
                       TABLE 276 ROW: MARKET, BY FORM, 2020–2023 (USD MILLION)
                       TABLE 277 ROW: MARKET, BY FORM, 2024–2029 (USD MILLION)
                       TABLE 278 ROW: MARKET, BY NATURE, 2020–2023 (USD MILLION)
                       TABLE 279 ROW: MARKET, BY NATURE, 2024–2029 (USD MILLION)
             12.6.2 AFRICA
                       12.6.2.1 Favorable processing conditions coupled with rising consumer awareness about health issues
                                   TABLE 280 AFRICA: PROTEIN ALTERNATIVES MARKET, BY SOURCE, 2020–2023 (USD MILLION)
                                   TABLE 281 AFRICA: MARKET, BY SOURCE, 2024–2029 (USD MILLION)
             12.6.3 MIDDLE EAST
                       12.6.3.1 Demand for plant-based convenience foods to drive growth of protein alternative industry
                                   TABLE 282 MIDDLE EAST: PROTEIN ALTERNATIVES MARKET, BY SOURCE, 2020–2023 (USD MILLION)
                                   TABLE 283 MIDDLE EAST: MARKET, BY SOURCE, 2024–2029 (USD MILLION)
 
13 COMPETITIVE LANDSCAPE (Page No. - 279)
     13.1 OVERVIEW 
     13.2 KEY PLAYER STRATEGIES/RIGHT TO WIN 
               TABLE 284 OVERVIEW OF STRATEGIES DEPLOYED BY KEY PROTEIN ALTERNATIVE PLAYERS
     13.3 REVENUE ANALYSIS 
               FIGURE 79 REVENUE ANALYSIS FOR KEY COMPANIES IN LAST FIVE YEARS, 2019–2023 (USD BILLION)
     13.4 MARKET SHARE ANALYSIS 
               FIGURE 80 SHARE OF LEADING COMPANIES IN PROTEIN ALTERNATIVES MARKET, 2023
             13.4.1 MARKET RANKING ANALYSIS
                       FIGURE 81 RANKING OF TOP FIVE PLAYERS IN PROTEIN ALTERNATIVES MARKET
                       TABLE 285 PROTEIN ALTERNATIVES MARKET: DEGREE OF COMPETITION, 2023
     13.5 COMPANY EVALUATION MATRIX: KEY PLAYERS, 2023 
             13.5.1 STARS
             13.5.2 EMERGING LEADERS
             13.5.3 PERVASIVE PLAYERS
             13.5.4 PARTICIPANTS
                       FIGURE 82 PROTEIN ALTERNATIVES MARKET: COMPANY EVALUATION MATRIX (KEY PLAYERS), 2023
             13.5.5 COMPANY FOOTPRINT: KEY PLAYERS, 2023
                       13.5.5.1 Company footprint
                                   FIGURE 83 COMPANY FOOTPRINT
                       13.5.5.2 Regional footprint
                                   TABLE 286 REGIONAL FOOTPRINT
                       13.5.5.3 Source footprint
                                   TABLE 287 SOURCE FOOTPRINT
                       13.5.5.4 Application footprint
                                   TABLE 288 APPLICATION FOOTPRINT
                       13.5.5.5 Form footprint
                                   TABLE 289 FORM FOOTPRINT
     13.6 COMPANY EVALUATION MATRIX: START-UPS/SMES, 2023 
             13.6.1 PROGRESSIVE COMPANIES
             13.6.2 RESPONSIVE COMPANIES
             13.6.3 DYNAMIC COMPANIES
             13.6.4 STARTING BLOCKS
                       FIGURE 84 PROTEIN ALTERNATIVES MARKET: COMPANY EVALUATION MATRIX (OTHER PLAYERS), 2023
             13.6.5 COMPETITIVE BENCHMARKING, START-UPS/SMES, 2023
                       13.6.5.1 Detailed list of key start-ups/SMEs
                                   TABLE 290 PROTEIN ALTERNATIVES MARKET: DETAILED LIST OF KEY START-UPS/SMES
                       13.6.5.2 Competitive benchmarking of start-ups/SMEs
                                   TABLE 291 PROTEIN ALTERNATIVES MARKET: COMPETITIVE BENCHMARKING OF START-UPS/SMES
     13.7 COMPANY VALUATION AND FINANCIAL METRICS 
               FIGURE 85 COMPANY VALUATION FOR NINE MAJOR PLAYERS IN PROTEIN ALTERNATIVES MARKET, 2023 (USD BILLION)
               FIGURE 86 EV/EBITDA OF MAJOR PLAYERS, 2023
     13.8 BRAND/PRODUCT COMPARISON 
               FIGURE 87 PROTEIN ALTERNATIVES MARKET: BRAND/PRODUCT COMPARISON
     13.9 COMPETITIVE SCENARIO AND TRENDS 
             13.9.1 PRODUCT LAUNCHES
                       TABLE 292 PROTEIN ALTERNATIVES MARKET: PRODUCT LAUNCHES, JANUARY 2020–FEBRUARY 2024
             13.9.2 DEALS
                       TABLE 293 PROTEIN ALTERNATIVES MARKET: DEALS, JANUARY 2020–FEBRUARY 2024
             13.9.3 EXPANSIONS
                       TABLE 294 PROTEIN ALTERNATIVES MARKET: EXPANSIONS, JANUARY 2020–JUNE 2022
 
14 COMPANY PROFILES (Page No. - 306)
     14.1 KEY PLAYERS 
(Business Overview, Products Offered, Recent Developments, and MnM View (Key strengths/Right to Win, Strategic Choices Made, and Weaknesses and Competitive Threats))*
             14.1.1 CARGILL, INCORPORATED
                       TABLE 295 CARGILL, INCORPORATED: BUSINESS OVERVIEW
                       FIGURE 88 CARGILL, INCORPORATED: COMPANY SNAPSHOT
                       TABLE 296 CARGILL, INCORPORATED: PRODUCTS/SOLUTIONS/SERVICES OFFERED
                       TABLE 297 CARGILL, INCORPORATED: DEALS
                       TABLE 298 CARGILL, INCORPORATED: EXPANSIONS
                       TABLE 299 CARGILL, INCORPORATED: OTHER DEVELOPMENTS
             14.1.2 ADM
                       TABLE 300 ADM: BUSINESS OVERVIEW
                       FIGURE 89 ADM: COMPANY SNAPSHOT
                       TABLE 301 ADM: PRODUCTS/SOLUTIONS/SERVICES OFFERED
                       TABLE 302 ADM: PRODUCT LAUNCHES
                       TABLE 303 ADM: DEALS
                       TABLE 304 ADM: OTHER DEVELOPMENTS
             14.1.3 KERRY GROUP PLC
                       TABLE 305 KERRY GROUP PLC: BUSINESS OVERVIEW
                       FIGURE 90 KERRY GROUP PLC: COMPANY SNAPSHOT
                       TABLE 306 KERRY GROUP PLC: PRODUCTS/SOLUTIONS/SERVICES OFFERED
                       TABLE 307 KERRY GROUP PLC: DEALS
                       TABLE 308 KERRY GROUP PLC: OTHER DEVELOPMENTS
             14.1.4 INTERNATIONAL FLAVORS & FRAGRANCES INC.
                       TABLE 309 INTERNATIONAL FLAVORS & FRAGRANCES INC.: BUSINESS OVERVIEW
                       FIGURE 91 INTERNATIONAL FLAVORS & FRAGRANCES INC.: COMPANY SNAPSHOT
                       TABLE 310 INTERNATIONAL FLAVORS & FRAGRANCES INC: PRODUCTS/SOLUTIONS/SERVICES OFFERED
             14.1.5 INGREDION
                       TABLE 311 INGREDION: BUSINESS OVERVIEW
                       FIGURE 92 INGREDION: COMPANY SNAPSHOT
                       TABLE 312 INGREDION: PRODUCTS/SOLUTIONS/SERVICES OFFERED
                       TABLE 313 INGREDION: PRODUCT LAUNCHES
                       TABLE 314 INGREDION: DEALS
                       TABLE 315 INGREDION: EXPANSIONS
             14.1.6 WILMAR INTERNATIONAL LTD.
                       TABLE 316 WILMAR INTERNATIONAL LTD.: BUSINESS OVERVIEW
                       FIGURE 93 WILMAR INTERNATIONAL LTD.: COMPANY SNAPSHOT
                       TABLE 317 WILMAR INTERNATIONAL LTD.: PRODUCTS/SOLUTIONS/SERVICES OFFERED
             14.1.7 ROQUETTE FRÈRES
                       TABLE 318 ROQUETTE FRÈRES: BUSINESS OVERVIEW
                       TABLE 319 ROQUETTE FRÈRES: PRODUCTS/SOLUTIONS/SERVICES OFFERED
                       TABLE 320 ROQUETTE FRÈRES: PRODUCT LAUNCHES
                       TABLE 321 ROQUETTE FRÈRES: DEALS
                       TABLE 322 ROQUETTE FRÈRES: EXPANSIONS
             14.1.8 GLANBIA PLC
                       TABLE 323 GLANBIA PLC: BUSINESS OVERVIEW
                       FIGURE 94 GLANBIA PLC: COMPANY SNAPSHOT
                       TABLE 324 GLANBIA PLC: PRODUCTS/SOLUTIONS/SERVICES OFFERED
                       TABLE 325 GLANBIA PLC: PRODUCT LAUNCHES
                       TABLE 326 GLANBIA PLC: DEALS
             14.1.9 DSM-FIRMENICH
                       TABLE 327 DSM-FIRMENICH: BUSINESS OVERVIEW
                       FIGURE 95 DSM-FIRMENICH: COMPANY SNAPSHOT
                       TABLE 328 DSM-FIRMENICH: PRODUCTS/SOLUTIONS/SERVICES OFFERED
                       TABLE 329 DSM-FIRMENICH: DEALS
               14.1.10 AGT FOOD AND INGREDIENTS
                                   TABLE 330 AGT FOOD AND INGREDIENTS: BUSINESS OVERVIEW
                                   TABLE 331 AGT FOOD AND INGREDIENTS: PRODUCTS/SOLUTIONS/SERVICES OFFERED
                                   TABLE 332 AGT FOOD AND INGREDIENTS: DEALS
               14.1.11 TATE & LYLE
                                   TABLE 333 TATE & LYLE: BUSINESS OVERVIEW
                                   FIGURE 96 TATE & LYLE: COMPANY SNAPSHOT
                                   TABLE 334 TATE & LYLE: PRODUCTS/SOLUTIONS/SERVICES OFFERED
                                   TABLE 335 TATE & LYLE: DEALS
               14.1.12 BURCON
                                   TABLE 336 BURCON: BUSINESS OVERVIEW
                                   FIGURE 97 BURCON: COMPANY SNAPSHOT
                                   TABLE 337 BURCON: PRODUCTS/SOLUTIONS/SERVICES OFFERED
                                   TABLE 338 BURCON: DEALS
                                   TABLE 339 BURCON: EXPANSIONS
               14.1.13 EMSLAND GROUP
                                   TABLE 340 EMSLAND GROUP: BUSINESS OVERVIEW
                                   TABLE 341 EMSLAND GROUP: PRODUCTS/SOLUTIONS/SERVICES OFFERED
                                   TABLE 342 EMSLAND GROUP: DEALS
               14.1.14 GLOBAL BUGS
                                   TABLE 343 GLOBAL BUGS: BUSINESS OVERVIEW
                                   TABLE 344 GLOBAL BUGS: PRODUCTS/SOLUTIONS/SERVICES OFFERED
                                   TABLE 345 GLOBAL BUGS: DEALS
               14.1.15 YNSECT
                                   TABLE 346 YNSECT: BUSINESS OVERVIEW
                                   TABLE 347 YNSECT: PRODUCTS/SOLUTIONS/SERVICES OFFERED
                                   TABLE 348 YNSECT: PRODUCT LAUNCHES
                                   TABLE 349 YNSECT: DEALS
                                   TABLE 350 YNSECT: EXPANSIONS
                                   TABLE 351 YNSECT: OTHER DEVELOPMENTS
     14.2 OTHER PLAYERS 
             14.2.1 PURIS
                       TABLE 352 PURIS: BUSINESS OVERVIEW
                       TABLE 353 PURIS: PRODUCTS/SOLUTIONS/SERVICES OFFERED
                       TABLE 354 PURIS: EXPANSIONS
                       TABLE 355 PURIS: OTHER DEVELOPMENTS
             14.2.2 COSUCRA
                       TABLE 356 COSUCRA: BUSINESS OVERVIEW
                       TABLE 357 COSUCRA: PRODUCTS/SOLUTIONS/SERVICES OFFERED
                       TABLE 358 COSUCRA: PRODUCT LAUNCHES
                       TABLE 359 COSUCRA: DEALS
                       TABLE 360 COSUCRA: EXPANSIONS
             14.2.3 BENEO GMBH
                       TABLE 361 BENEO GMBH: BUSINESS OVERVIEW
                       TABLE 362 BENEO GMBH: PRODUCTS/SOLUTIONS/SERVICES OFFERED
                       TABLE 363 BENEO GMBH: DEALS
                       TABLE 364 BENEO GMBH: EXPANSIONS
                       TABLE 365 BENEO GMBH: OTHER DEVELOPMENTS
             14.2.4 SOTEXPRO
                       TABLE 366 SOTEXPRO: BUSINESS OVERVIEW
                       TABLE 367 SOTEXPRO: PRODUCTS/SOLUTIONS/SERVICES OFFERED
             14.2.5 AMCO PROTEINS
                       TABLE 368 AMCO PROTEINS: BUSINESS OVERVIEW
                       TABLE 369 AMCO PROTEINS: PRODUCTS/SOLUTIONS/SERVICES OFFERED
                       TABLE 370 AMCO PROTEINS: EXPANSIONS
             14.2.6 HEXAFLY
                       TABLE 371 HEXAFLY: BUSINESS OVERVIEW
                       TABLE 372 HEXAFLY: PRODUCTS/SOLUTIONS/SERVICES OFFERED
                       TABLE 373 HEXAFLY: DEALS
             14.2.7 CHAPUL, LLC
                       TABLE 374 CHAPUL, LLC: BUSINESS OVERVIEW
                       TABLE 375 CHAPUL, LLC: PRODUCTS/SOLUTIONS/SERVICES OFFERED
                       TABLE 376 CHAPUL, LLC: OTHER DEVELOPMENTS
             14.2.8 AUSTRALIAN PLANT PROTEINS PTY LTD.
                       TABLE 377 AUSTRALIAN PLANT PROTEINS PTY LTD.: COMPANY OVERVIEW
             14.2.9 SHANDONG JIANYUAN GROUP
                       TABLE 378 SHANDONG JIANYUAN GROUP: COMPANY OVERVIEW
               14.2.10 MYCORENA
                                   TABLE 379 MYCORENA: COMPANY OVERVIEW
               14.2.11 CALYSTA INC.
                                   TABLE 380 CALYSTA INC.: COMPANY OVERVIEW
               14.2.12 NEXTPROTEIN
                                   TABLE 381 NEXTPROTEIN: COMPANY OVERVIEW
               14.2.13 QUORN
                                   TABLE 382 QUORN: COMPANY OVERVIEW
*Details on Business Overview, Products Offered, Recent Developments, and MnM View (Key strengths/Right to Win, Strategic Choices Made, and Weaknesses and Competitive Threats) might not be captured in case of unlisted companies.
 
15 ADJACENT & RELATED MARKETS (Page No. - 379)
     15.1 INTRODUCTION 
               TABLE 383 ADJACENT MARKETS
     15.2 STUDY LIMITATIONS 
     15.3 PEA PROTEIN MARKET 
             15.3.1 MARKET DEFINITION
             15.3.2 MARKET OVERVIEW
                       TABLE 384 PEA PROTEIN MARKET, BY FORM, 2020–2023 (USD MILLION)
                       TABLE 385 PEA PROTEIN MARKET, BY FORM, 2024–2029 (USD MILLION)
     15.4 SOY PROTEIN INGREDIENTS MARKET 
             15.4.1 MARKET DEFINITION
             15.4.2 MARKET OVERVIEW
                       TABLE 386 SOY PROTEIN INGREDIENTS MARKET, BY NATURE, 2018–2021 (USD MILLION)
                       TABLE 387 SOY PROTEIN INGREDIENTS MARKET, BY NATURE, 2022–2027 (USD MILLION)
     15.5 PROTEIN INGREDIENTS MARKET 
             15.5.1 MARKET DEFINITION
             15.5.2 MARKET OVERVIEW
                       TABLE 388 PROTEIN INGREDIENTS MARKET, BY FORM, 2019–2022 (USD MILLION)
                       TABLE 389 PROTEIN INGREDIENTS MARKET, BY FORM, 2023–2028 (USD MILLION)
     15.6 INSECT PROTEIN MARKET 
             15.6.1 MARKET DEFINITION
             15.6.2 MARKET OVERVIEW
                       TABLE 390 INSECT PROTEIN MARKET, BY DISTRIBUTION CHANNEL, 2019–2021 (USD MILLION)
                       TABLE 391 INSECT PROTEIN MARKET, BY DISTRIBUTION CHANNEL, 2022–2027 (USD MILLION)
 
16 APPENDIX (Page No. - 385)
     16.1 DISCUSSION GUIDE 
     16.2 KNOWLEDGESTORE: MARKETSANDMARKETS’ SUBSCRIPTION PORTAL 
     16.3 CUSTOMIZATION OPTIONS 
     16.4 RELATED REPORTS 
     16.5 AUTHOR DETAILS 

The study involved two major approaches in estimating the current size of the protein alternatives market. Exhaustive secondary research was done to collect information on the market, peer, and parent markets. The next step was to validate these findings, assumptions, and sizing with industry experts across the value chain through primary research. Both top-down and bottom-up approaches were employed to estimate the complete market size. After that, market breakdown and data triangulation were used to estimate the market size of segments and subsegments.

Secondary Research

This research study involved the extensive use of secondary sources—directories and databases such as Bloomberg Businessweek and Factiva—to identify and collect information useful for a technical, market-oriented, and commercial study of the market.

In the secondary research process, various sources such as annual reports, press releases & investor presentations of companies, white papers, food journals, certified publications, articles from recognized authors, directories, and databases were referred to identify and collect information.

Secondary research was mainly used to obtain key information about the industry’s supply chain, the total pool of key players, and market classification and segmentation as per the industry trends to the bottom-most level, regional markets, and key developments from both market- and technology-oriented perspectives.

Primary Research

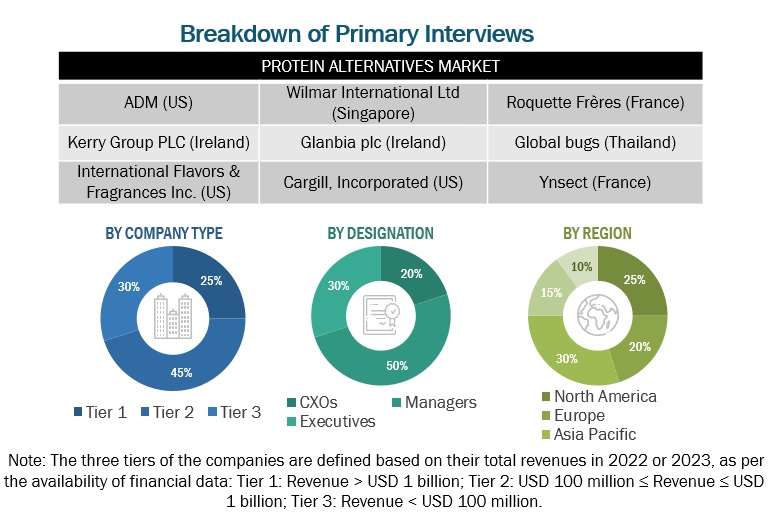
Extensive primary research was conducted after obtaining information regarding the protein alternatives market scenario through secondary research. Several primary interviews were conducted with market experts from both the demand and supply sides across major countries of North America, Europe, Asia Pacific, South America, and the Rest of the World. Primary data was collected through questionnaires, emails, and telephonic interviews. The primary sources from the supply side included various industry experts, such as Chief X Officers (CXOs), Vice Presidents (VPs), Directors from business development, marketing, research, and development teams, and related key executives from distributors and key opinion leaders. Primary interviews were conducted to gather insights such as market statistics, data on revenue collected from the products and services, market breakdowns, market size estimations, market forecasting, and data triangulation. Primary research also helped in understanding the various trends related to protein alternatives sources, application, form, nature, production process (qualitative) and region. Stakeholders from the demand side, such as processed food and functional food products manufacturers, were interviewed to understand the buyer’s perspective on the suppliers, products, and their current usage of protein alternatives and the outlook of their business, which will affect the overall market.
Protein Alternatives Market Size, and Share

To know about the assumptions considered for the study, download the pdf brochure

COMPANY NAME

designation

ADM (US)

General Manager

Cargill Incorporated (US)

Sales Manager

International Flavors & Fragrances Inc. (US)

Manager

Ingredion (US)

Head of processing department

Roquette Frères (France)

Marketing Manager

Wilmar International Ltd. (Singapore)

Sales Executive

Protein Alternatives Market Size Estimation

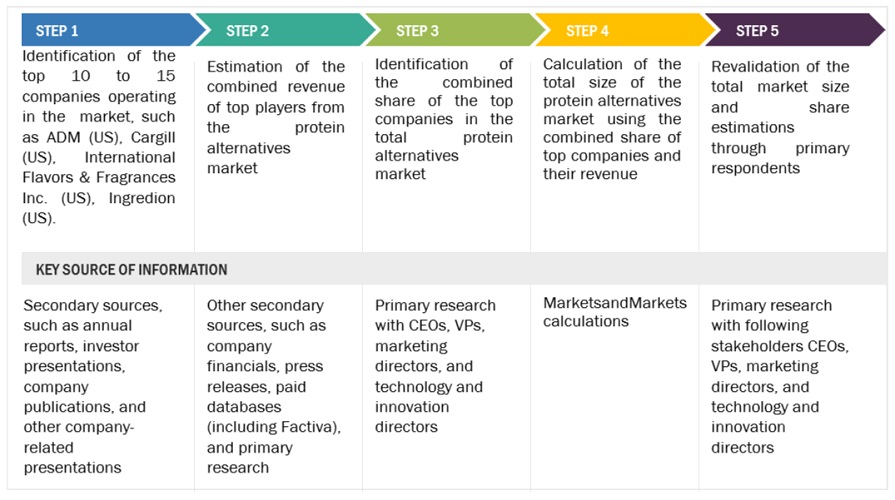
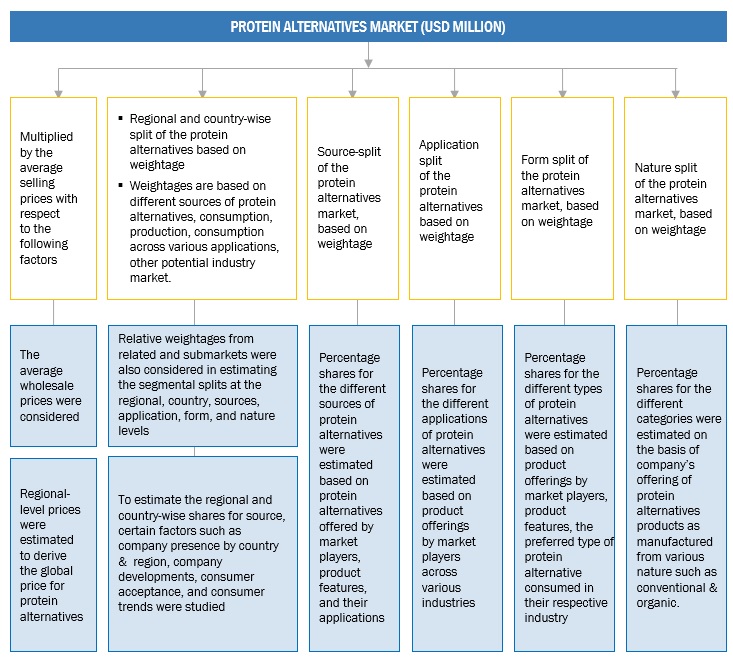
Both the top-down and bottom-up approaches were used to estimate and validate the total size of the protein alternatives market. These approaches were also used extensively to determine the size of various subsegments in the market. The research methodology used to estimate the market size includes the following details:

  • The key players in the industry and the overall markets were identified through extensive secondary research.
  • All shares, splits, and breakdowns were determined using secondary sources and verified through primary sources.
  • All possible parameters that affect the market covered in this research study were accounted for, viewed in extensive detail, verified through primary research, and analyzed to obtain final quantitative and qualitative data.
  • The research included the study of reports, reviews, and newsletters of top market players, along with extensive interviews for opinions from leaders, such as CEOs, directors, and marketing executives.

Global Protein Alternatives Market: Supply-side analysis.
Protein Alternatives Market Supply-side analysis

To know about the assumptions considered for the study, Request for Free Sample Report

Global Protein Alternatives Market: Top-Down Approach.
Protein Alternatives Market Top Down Approach

Data Triangulation

After arriving at the overall market size from the estimation process explained above, the total market was split into several segments and subsegments. The data triangulation and market breakdown procedures were employed, wherever applicable, to estimate the overall protein alternatives market and arrive at the exact statistics for all segments and subsegments. The data was triangulated by studying various factors and trends from the demand and supply sides. The market size was also validated using both the top-down and bottom-up approaches.

Market Definition

According to GFI, alternative proteins are proteins produced from plants or animal cells, or by way of fermentation. These innovative foods are designed to taste the same as or better than conventional animal products while costing the same or less. Compared to conventionally produced proteins, alternative proteins require fewer inputs, such as land and water, and generate far fewer negative externalities, such as greenhouse gas emissions and pollution.

Plant protein refers to the derivation of protein from plant-based sources, such as pulses, grains, and seeds. Different sources of plant-based protein include soy, wheat, pea, canola, oats, rice, and potato. Proteins are polymers of amino acids, which are used in various applications for their nutritional and functional properties. Their potential to increase the nutritional level and the resultant healthy diet makes them one of the key ingredients in both the food and feed industries.

According to the US Agency for International Development (USAID), “Soy protein concentrates (SPC), and soy protein isolates (SPI) are processed food ingredients produced from wholly defatted soy meal through a water extraction process. The resulting concentrates and isolates contain 65%-90% protein, respectively, and are used as ingredients to enrich other food products.”.

According to the European Food Information Council (EUFIC), insects have the potential to produce less greenhouse gas (GHG) emissions and use fewer resources as compared to conventional sources such as plant and animal proteins. Proteins derived from insects, either through consumption of the whole of the insects or through extraction processes, are termed insect proteins. Insect-based protein is considered a viable alternative source for protein, majorly in food and feed applications. Like animal proteins, insects are rich in proteins and essential amino acids, which are easily digestible compared to plant-based proteins.

According to National Center for Biotechnology Information (NCBI), Microbial proteins, commonly known as single-cell proteins (SCP), are derived from several species of microorganisms but are most commonly derived from microalgae, fungi, yeast, or bacteria.

Key Stakeholders

  • Food & beverage manufacturers, suppliers, and processors
  • Research & development institutions
  • Traders & retailers
  • Distributors, importers, and exporters
  • Regulatory bodies
    • Organizations such as the Food and Drug Administration (FDA), United States Department of Agriculture (USDA), European Food Safety Agency (EFSA), EUROPA, and Food Safety Australia and New Zealand (FSANZ)
    • Government agencies
  • Intermediary suppliers
  • Universities and industry bodies
  • End users
  • Insect protein and other protein feed ingredient manufacturers
  • Insect farmers and field experts
  • Feed and feed additive manufacturers
  • Food processors and ingredient manufacturers
  • Food safety agencies such as the Food and Drug Administration (FDA) and the European Food Information Council (EUFIC)
  • Commercial research & development (R&D) institutions and financial institutions
  • Importers and exporters of alternative proteins
  • Traders, distributors, and suppliers
  • Government organizations, research organizations, and consulting firms

Report Objectives

Market Intelligence

  • To determine and project the size of the protein alternatives market with respect to the source, form, nature, application, production process (qualitative) and regions in terms of value and volume over five years, ranging from 2024 to 2029.
  • To identify the attractive opportunities in the market by determining the largest and fastest-growing segments across regions
  • To provide detailed information about the key factors influencing market growth (drivers, restraints, opportunities, and challenges)
  • To analyze the opportunities in the market for stakeholders and provide details of the competitive landscape for market leaders.
  • To analyze the micro-markets with respect to individual growth trends, prospects, and their contribution to the total market.
  • To identify and profile the key players in the protein alternatives market.
  • To understand the competitive landscape and identify the major growth strategies adopted by players across the key regions.

Available Customizations:

With the given market data, MarketsandMarkets offers customizations according to company-specific scientific needs.

The following customization options are available for the report:

Product Analysis

  • Product Matrix, which gives a detailed comparison of the product portfolio of each company.

Geographic Analysis

With the given market data, MarketsandMarkets offers customizations according to company-specific scientific needs.

  • Further breakdown of the European protein alternatives market into key countries.
  • Further breakdown of the Rest of Asia Pacific protein alternatives market into key countries.

Company Information

  • Detailed analyses and profiling of additional market players (up to five)
Custom Market Research Services

We will customize the research for you, in case the report listed above does not meet with your exact requirements. Our custom research will comprehensively cover the business information you require to help you arrive at strategic and profitable business decisions.

Request Customization
Report Code
FB 9057
Published ON
Jun, 2024
Choose License Type
BUY NOW
  • SHARE
X
Request Customization
Speak to Analyst
Speak to Analyst
OR FACE-TO-FACE MEETING
PERSONALIZE THIS RESEARCH
  • Triangulate with your Own Data
  • Get Data as per your Format and Definition
  • Gain a Deeper Dive on a Specific Application, Geography, Customer or Competitor
  • Any level of Personalization
REQUEST A FREE CUSTOMIZATION
LET US HELP YOU!
  • What are the Known and Unknown Adjacencies Impacting the Protein Alternatives Market
  • What will your New Revenue Sources be?
  • Who will be your Top Customer; what will make them switch?
  • Defend your Market Share or Win Competitors
  • Get a Scorecard for Target Partners
CUSTOMIZED WORKSHOP REQUEST
  • Call Us
  • +1-888-600-6441 (Corporate office hours)
  • +1-888-600-6441 (US/Can toll free)
  • +44-800-368-9399 (UK office hours)
CONNECT WITH US
ABOUT TRUST ONLINE
©2024 MarketsandMarkets Research Private Ltd. All rights reserved
DMCA.com Protection Status Website Feedback