We use cookies to enhance your experience. By continuing to visit this site you agree to our use of cookies . More info . X close

AI Vision Market Size, Share & Growth Analysis 2029

Report Code SE 9174
Published in Jan, 2025, By MarketsandMarkets™
Download PDF

Choose License Type

Buy Report Now Inquire Before Buying

AI Vision Market by Vision Software (API, SDK), Vision Platform, Behavioral Analysis, Optical Character Recognition, Spatial Analysis, Image Recognition, Heatmap Analysis, Machine Learning, Deep Learning, CNN, Generative AI – Global Forecast to 2029

Latest Date Updated on : Jan 17, 2025


AI Vision Market Size, Share & Trends

The global AI vision market is expected to reach USD 43.02 billion in 2029 from USD 14.85 billion in 2024, at a CAGR of 23.7% during the forecast period. The AI vision is one of the popular trends as all the industries and companies are in need of automation as well as intelligent decision-making. Both speed and real-time information of operations provide drive towards business attraction to adopt more advanced imaging and analysis technologies. The various operations of companies and related cost management, through AI vision solution been made easier to execute. These include high growth technology since it enables the development of more complex and effective trading systems leading to accelerated rates of market growth. Factors such as increased demand for quality, safety, and reliability, as well as monitoring and preventive maintenance of equipment and processes, especially in industrial settings, are also fueling the market’s growth. The continuous capacity of AI vision to deliver change continually to processes and open up more possibilities is still encouraging investment and advancement in this industry.

AI Vision Market

Attractive Opportunities in the AI Vision Market

ASIA PACIFIC

The growth of the market in Asia Pacific can be attributed to advancements in AI technology, increased adoption across various sectors such as healthcare, manufacturing, and retail in countries like China, South Korea, and Japan.

The growth of the market can be attributed to the strategic initiatives by modernization of manufacturing sector and strong government support and investments.

Presence of established AI vision platform providers in countries like US, known for their technological expertise, contributes to the growth of the market in the North America.

Acquisitions, and developments are expected to offer lucrative growth opportunities for the market players during the next 5 years.

Complexity associated with maintenance and upgrades are some of the challenges in AI vision market.

Global AI Vision Market Dynamics

DRIVER: Growing inclination toward cloud computing

Cloud computing is contributing more and more to the AI vision market growth by providing a scalable and flexible infrastructure for data transferring. Cloud computing has enabled enterprises to easily operate and launch AI vision apps without the use of costly hardware that may result in a slow and costly data analysis process or the development of intricate models. Given that the demand for AI vision is rapidly increasing, this is the crucial reason for which technologies like cloud computing are adopted.

The ample processing power and the storage capacity of cloud platforms are fitted to AI vision applications. For instance, in October 2024, Oracle announced plans to invest more than USD 6.5 billion for building a new public cloud region in Malaysia. This investment is to advance the country's capabilities in artificial intelligence (Al) and cloud computing. Moreover, the investment is expected to benefit in meeting rising demand of Al services and cloud solutions by organizations in Malaysia. All such investments in cloud infrastructure development are expected to drive the Al vision market.

RESTRAINTS: Ethical concerns and bias in AI algorithms

The AI vision market is currently facing some of its greatest challenges in the form of ethical issues and biases in AI algorithms. If a particular AI system happens to be biased or unfair, such as categorizing them based on gender or race inaccurately, not only are ethical concerns raised, but public confidence also falls.

The issues can't be marginalized easily. Mostly it takes extra costs to make development of non-biased algorithm models, and the process may get longer making the timeline longer.

Companies should act in a more responsible way and demonstrate their ethical behavior through AI. The systems should not be utilized until embedded bias within the systems is no longer there. They should not be utilized unless designed to be fair and unbiased. The market is a sector that is growing. The technological advancements in the AI vision sector will enable all sectors to run smoothly. This is if the players in the market strictly adhere to the design of vision systems that are labeled non-existent of bias and are developed such that they are able to optimize their behavior depending on the setting, such as in factories and hospitals.


OPPORTUNITY: Advancements with smart city projects

The advanced visual technologies in urban systems of smart city projects positively impact the Al vision market. Traffic management, public safety improvement, and environment monitoring apply Al vision in such projects. Using Al vision enables improved traffic regulation, better security improvement through surveillance, and environmental monitoring.

With rising smart city project, it's anticipated to spur the development in Al vision among its players in the coming time. Since they have smart cities investment, which includes investing smartly into their infrastructures, that demand Al vision systems from their part. For instance, in May 2024, the Trade and Development Agency have signed a technical assistance grant with Indonesia's Nusantara Capital Authority. Furthermore, in October 2024, global technology and engineering group ST Engineering has already secured a contract worth about USD 44 million from Lusail Real Estate Development Company. This contract is for designing a smart city platform for the Lusail City in Qatar. These contract is a step towards turning the entire city of Lusail into an entirely integrated smart city based on the concept of using completely Al and data-driven technologies. These are likely to boost the Al vision market significantly because demand for advanced Al technologies will be integral to the smart infrastructure of the city.

CHALLENGE: Complexities associated with maintenance and upgrades

AI vision software proves to be functionally challenging as it needs continuous updates and maintenance, which can be expensive and challenging for businesses. In fact, they need specialized hardware of cameras and GPUs for themselves. Still, such hardware tends to degrade over time and must be replaced or upgraded regularly to ensure that captured image quality and processing speeds are maintained. Furthermore, introducing new models of AI to old hardware may cause issues with respect to compatibility to make upgrades much more difficult. However, accurate models change with changes in the visual data patterns. This calls for retraining, which requires high-quality labeled data, is expensive to produce, and is time-consuming.

Updates of software in the AI vision system affect the overall setup, necessitating very extensive testing to ensure that the new software works seamlessly with every other piece in the setup. This factors into the complexity of such systems. Cloud-based AI vision solutions tackle these problems by managing updates remotely, eliminating the need for on-site maintenance. Such scalable AI frameworks compatible with multiple upgrades of diverse hardware components may make it easier and even cheaper in terms of making the AI vision systems easier to be kept up-to-date.

AI Vision Market Ecosystem

The AI vision market is consolidated, with major companies such as NVIDIA Corporation (US), Microsoft Corporation (US), Intel Corporation (US), Alphabet Inc. (US), Amazon.com, Inc. (US), IBM (US), Oracle (US), Cognex Corporation (US), Qualcomm Technologies, Inc. (US), STMicroelectronics (Switzerland), Avnet, Inc. (US), AVEVA Group Limited (UK), and numerous small- and medium-sized enterprises. Almost all players offer various products in the AI vision market. These products are used in applications such as Autonomous Vehicles, Augmented Reality Devices, Robotic Vision Systems, 3D Printers, and others.

Top Companies in AI Vision Market
 

Based on mode of operatrion, the cloud based learning segment is expected to grow fastest during the forecast period.

Cloud-based inferencing leverages cloud platforms to efficiently process visual data, leveraging pre-trained models for various applications, including object detection and facial recognition. Organizations can customize these models with labeled datasets and utilize APIs to quickly incorporate data within applications. Companies operating cloud platforms like Google Cloud and Microsoft Azure provide fundamental tools and infrastructure for building AI vision applications, supported with AI and machine learning algorithms for integrated analysis of images and video.

Google Cloud’s Vertex AI Vision, for example, allows the easy development of computer vision applications using a simple drag-and-drop interface for processing real time video and image streaming anywhere in the world. As the demand for scalable, cost-effective, and accessible AI applications increases, the cloud-based inferencing market will grow. However, more than that, it signifies a strong commitment to new forms of accessibility and innovation in AI technologies across several important sectors from manufacturing, healthcare, retail, and autonomous, putting cloud-based learning applications at the forefront in the progression of what is possible and available for intelligent applications.

Based on the offering, the vision platform segment is projected to dominate during the forecast period.

AI vision platforms can be described as comprehensive methods for analyzing and scrutinizing visual data. They do so by identifying pertinent images of the business and spotting anomalies relevant to business operations. A classic example is Chooch’s AI Vision platform, which enables organizations to see and interpret business-critical anomalies immediately. Alternatively, companies like Qualcomm Technologies, Inc. have established vision platforms that are high-performance integrated image sensor processors or the Vision Intelligence 400 Platform, which offers constant comprehensive camera processing capabilities. The function of AI vision platform methods varies based on the industry in which they are utilized. Retail, manufacturing, logistics, and smart factories, to name a few, use some type of AI vision platform methodology in practice.

Consumer electronics and light vehicles being manufactured has created more demand for real-time data analysis and automation from manufacturing firms, primarily in the food and automotive sectors. AI vision platforms allow manufacturers and operators to analyze visual input in real-time and recognize any type of anomaly, such as product defects, equipment failure, or processing deviations.

Based on Region, the Asia Pacific Region Will Grow Fastest During the Forecasted Period

In the Asia Pacific market, the AI vision sector is rapidly growing due to advancements in technology, the adoption of vision technology in different sectors, and significant governmental sponsorship, where applicable, of AI technologies. In China, rapid development in generative AI and new startup companies have accelerated the growth of the AI vision market. Additionally, Japan is solidifying its position in the AI vision industry through the adaptation of its AI and cloud infrastructure. Moreover, in South Korea, the government is taking the initiative to advance AI vision technology along with other types of AI technology, which will position South Korea to take on a stronger role in the regional growth of the AI vision market.

Emerging economies in the region, e.g., India, Malaysia, Thailand, and Australia, have begun to build AI capabilities through national plans focused on digital transformation. Overall, the regional development in AI has enhanced the growth of AI vision in the Asia Pacific as AI technologies become more developed and commonly adopted. Consequently, businesses across the region are implementing AI vision to improve efficiency, automate processes, and enhance decision-making. Due to the notable growth of the AI vision market in the Asia Pacific, AI and vision technologies will play an important part in innovating, growing, and advancing digital transformation across the region.

LARGEST MARKET SHARE IN 2029
CHINA FASTER-GROWING MARKET IN REGION
AI Vision Market Size and Share

Recent Developments of AI Vision Market

  • In January 2025, NVIDIA Corporation has expanded its partnerships with some of the major automotive players such as Toyota, Aurora, and Continental for enhancing the development of next-generation highly automated and autonomous vehicle fleets. NVIDIA's Al technologies leverage advanced visual processing capabilities to enhance the functionality and safety of self-driving systems.
  • In May 2024, Microsoft Corporation released GPT-4 Turbo with Vision, a multimodal model that processes text and image inputs. It enhances various applications by enabling image and video analysis and text generation. This model supports optical character recognition (OCR) and object grounding, helping businesses innovate and streamline operations.
  • In May 2024, Avnet, Inc. launched the QCS6490 Vision-AI Development Kit, which allows engineering teams to quickly prototype multi-camera, high-performance Edge AI-embedded products. The kit leverages the energy-efficient MSC SM2S-QCS6490 SMARC compute module based on the Qualcomm QCS6490 processor.
  • In April 2024, IBM launched the IBM Z IntelliMagic Vision software platform for z/OS, which is performance analysis software for IBM Z systems. It offers flexible data analysis with custom, no-code visualizations, enabling analysts to identify risks and optimize workloads.
  • In April 2024, Cognex Corporation launched the In-Sight L38 3D Vision System that integrates AI with 2D and 3D vision technologies to streamline inspection and measurement processes. It creates 2D images that incorporate 3D data for easier training and more accurate feature detection. AI tools identify variable features, while rule-based algorithms enable precise 3D measurements for consistent inspection results.

Key Market Players

Want to explore hidden markets that can drive new revenue in AI Vision Market?

Scope of the Report

Report Attribute Details
Estimated Market Size USD 14.85 billion
Projected Market Size USD 43.02 billion
Growth Rate CAGR of 23.7%
Market size available for years 2020–2029
Forecast units Value (USD Million)
Segments Covered By Offering, By Service Type, By Technology, By mode of Operation, By Vertical, and Region
Geographies covered North America, Europe, Asia Pacific, and Rest of the World

Key Questions Addressed by the Report

Which are the major companies in the AI vision market? What are their significant strategies to strengthen their market presence?
The major companies in the AI vision market are NVIDIA Corporation (US), Microsoft Corporation (US), Intel Corporation (US), Alphabet Inc. (US), Amazon.com, Inc. (US), and IBM (US). The major strategies adopted by these players are product launches, developments, and acquisitions.
What is the potential market for the AI vision in terms of the region?
The Asia Pacific region is expected to dominate the AI vision market due to advancements in AI technology, increased adoption across various sectors such as healthcare, manufacturing, and retail in countries like China, South Korea, and Japan.
What are the opportunities for new market entrants?
There are significant opportunities in the AI vision market for start-up companies. These companies provide innovative and diverse product portfolios.
What are the drivers and restraints for the AI vision market?
Factors such as growing inclination toward cloud computing and increasing adoption of edge computing are fueling the growth. Legal and reputational risks, and dependence on high-quality data for accurate results are some of the restraints.
What are the major AI vision applications expected to drive the market's growth in the next five years?
The major applications for the AI vision are Autonomous Vehicles, Augmented Reality Devices, Robotic Vision Systems, and 3D Printers.


Personalize This Research

  • Triangulate with your Own Data
  • Get Data as per your Format and Definition
  • Gain a Deeper Dive on a Specific Application, Geography, Customer or Competitor
  • Any level of Personalization
Request A Free Customisation

Let Us Help You

  • What are the Known and Unknown Adjacencies Impacting the AI Vision Market
  • What will your New Revenue Sources be?
  • Who will be your Top Customer; what will make them switch?
  • Defend your Market Share or Win Competitors
  • Get a Scorecard for Target Partners
Customized Workshop Request

Table of Contents

Exclusive indicates content/data unique to MarketsandMarkets and not available with any competitors.

TITLE
PAGE NO
INTRODUCTION
23
RESEARCH METHODOLOGY
27
EXECUTIVE SUMMARY
39
PREMIUM INSIGHTS
43
MARKET OVERVIEW
46
  • 5.1 INTRODUCTION
  • 5.2 MARKET DYNAMICS
  • 5.3 TRENDS/DISRUPTIONS IMPACTING CUSTOMER’S BUSINESS
  • 5.4 PRICING ANALYSIS
    AVERAGE SELLING PRICE TREND OF KEY PLAYERS, BY OFFERING
    AVERAGE SELLING PRICE TREND, BY REGION
  • 5.5 VALUE CHAIN ANALYSIS
  • 5.6 ECOSYSTEM ANALYSIS
  • 5.7 INVESTMENT AND FUNDING SCENARIO
  • 5.8 FUNDING, BY APPLICATION
  • 5.9 TECHNOLOGY ANALYSIS
    KEY TECHNOLOGY
    COMPLEMENTARY TECHNOLOGY
    ADJACENT TECHNOLOGY
    PATENT ANALYSIS
    TRADE ANALYSIS
    KEY CONFERENCES AND EVENTS (2024-20252026)
    CASE STUDY ANALYSIS
    TOP USE CASES AND BEST PRACTICES OF AI
    TARIFF AND REGULATORY LANDSCAPE
    - Tariff Data (HS Code: 852580) - Television cameras, digital cameras, and video camera recorders)
    - Regulatory Bodies, Government Agencies, and Other Organizations
    - Key Regulations
    PORTERS FIVE FORCE ANALYSIS
    - Threat from New Entrants
    - Threat of Substitutes
    - Bargaining Power of Suppliers
    - Bargaining Power of Buyers
    - Intensity of Competitive Rivalry
    KEY STAKEHOLDERS AND BUYING CRITERIA
    - Key Stakeholders in Buying Process
    - Buying Criteria
USE CASES FOR AI VISION
83
  • 6.1 INTRODUCTION
  • 6.2 AUTONOMOUS VEHICLES
  • 6.3 AUGMENT REALITY
  • 6.4 ROBOTICS
  • 6.5 3D PRINTING
  • 6.6 MEDICAL IMAGING
  • 6.7 TRAFFIC MONITORING
  • 6.8 LICENSE PLATE RECOGNITION
  • 6.9 SECURITY & SURVEILLANCE
    DIGITAL ASSET MANAGEMENT
AI VISION MARKET, BY OFFERING
87
  • 7.1 INTRODUCTION
  • 7.2 VISION SOFTWARE
    APPLICATION PROGRAMMABLE INTERFACE (API)
    SOFTWARE DEVELOPMENT KITS (SDK)
  • 7.3 VISION PLATFORMS
  • 7.4 CUSTOM SOLUTIONS
AI VISION MARKET, BY SERVICE TYPE
94
  • 8.1 INTRODUCTION
  • 8.2 BEHAVIOURAL ANALYSIS
    FACIAL RECOGNITION
  • 8.3 OPTICAL CHARACTER RECOGNITION
  • 8.4 SPATIAL ANALYSIS
    MOTION DETECTION
    INTRUSION DETECTION
    MONITORING SURROUNDINGS
  • 8.5 IMAGE RECOGNITION
  • 8.6 HEATMAP ANALYSIS
    CROWD DENSITY ANALYSIS
AI VISION MARKET, BY TECHNOLOGY
101
  • 9.1 INTRODUCTION
  • 9.2 MACHINE LEARNING
    DEEP LEARNING
    CONVOLUTIONAL NEURAL NETWORKS
  • 9.3 GENERATIVE AI
    AI VISION MARKET, BY MODE OF OPERATION
AI VISION MARKET, BY MODE OF OPERATION
108
  • 10.1 INTRODUCTION
  • 10.2 EDGE INFERENCING/COMPUTING
  • 10.3 CLOUD-BASED LEARNING
AI VISION MARKET, BY VERTICAL
117
  • 11.1 INTRODUCTION
  • 11.2 TRANSPORTATION & LOGISTICS
  • 11.3 RETAIL
  • 11.4 HEALTHCARE
  • 11.5 MANUFACTURING
  • 11.6 AGRICULTURE
  • 11.7 OIL & GAS
  • 11.8 CONSTRUCTION
  • 11.9 OTHERS
AI VISION MARKET, BY REGION
128
  • 12.1 INTRODUCTION
  • 12.2 NORTH AMERICA
    MACROECONOMIC FACTORS
    US
    CANADA
    MEXICO
  • 12.3 EUROPE
    MACROECONOMIC FACTORS
    UK
    GERMANY
    FRANCE
    ITALY
    REST OF EUROPE
  • 12.4 ASIA PACIFIC
    MACROECONOMIC FACTORS
    CHINA
    JAPAN
    SOUTH KOREA
    REST OF ASIA PACIFIC
  • 12.5 ROW
    MACROECONOMIC FACTORS
    MIDDLE EAST
    - GCC Countries
    - Rest of Middle East
    AFRICA
    SOUTH AMERICA
COMPETITIVE LANDSCAPE
163
  • 13.1 INTRODUCTION
  • 13.2 KEY PLAYER STRATEGIES/RIGHT-TO-WIN
  • 13.3 REVENUE ANALYSIS OF TOP 5 PLAYERS
  • 13.4 MARKET SHARE ANALYSIS
  • 13.5 COMPANY VALUATION AND FINANCIAL METRICS
  • 13.6 BRAND/PRODUCT COMPARISON
  • 13.7 COMPANY EVALUATION MATRIX: KEY PLAYERS, 2023
    STARS
    EMERGING LEADERS
    PERVASIVE PLAYERS
    PARTICIPANTS
    COMPANY FOOTPRINT: KEY PLAYERS, 2023
    - Company Footprint
    - Region Footprint
    - Industry Footprint
    - Technology Footprint
    - Mode of Operation Footprint
    - Service Type Footprint
    - Offering Footprint
  • 13.8 COMPANY EVALUATION MATRIX: STARTUPS/SMES, 2023
    PROGRESSIVE COMPANIES
    RESPONSIVE COMPANIES
    DYNAMIC COMPANIES
    STARTING BLOCKS
    COMPETITIVE BENCHMARKING: STARTUPS/SMES, 2023
    - Detailed List of Key Startups/SMEs
    - Competitive Benchmarking of Key Startups/SMEs
  • 13.9 COMPETITIVE SITUATION AND TRENDS
COMPANY PROFILES
184
  • 14.1 KEY PLAYERS
    NVIDIA CORPORATION
    MICROSOFT CORPORATIONAMAZON
    INTEL CORPORATION
    ALPHABET INC.
    AMAZON.COM, INC.
    AVNET INC.IBM
    ORACLE AVEVA?GROUP
    COGNEX CORPORATIONALPHABET (GOOGLE)
    QUALCOMM TECHNOLOGIES, INC.IBM
    - STMicroelectronicsIntel
    - Avnet, Inc.Microsoft
    - STMicroelectronics
  • 14.2 OTHER PLAYERS
    SYMPHONYAI
    APERA AI
    CHOOCH
    IRONYUN INC.
    KYUNGWOO SYSTECH, INC.
    LANDINGAI
    ML6
    OPENSISTEMAS
    ROBOVISION BV
    - SENSETIME
    - SEVENLAB
    - SOLOMON TECHNOLOGY CORPORATION
    - VISO.AI
    ZEBRA TECHNOLOGIES APERA AI
    COGNEX
    CHOOCH
    IRONYUN INC. (VAIDIO AI VISION PLATFORM)
    KYUNGWOO SYSTECH INC. (KIGIS SAFETY TECHNOLOGY)
    LANDING AI
    ML6
    OPENSISTEMAS
    ROBOVISION
    - SenseTime
    - SevenLab
    - SOLOMON Technology Corporation
    - SymphonyAI
    - viso.ai
    - Zebra Technologies
    - AI VISION TECHNOLOGIES
    - HELLBENDER
    MVISION AI
APPENDIX
234
  • 15.1 DISCUSSION GUIDE
  • 15.2 KNOWLEDGE STORE: MARKETSANDMARKETS’ SUBSCRIPTION PORTAL
  • 15.3 AVAILABLE CUSTOMIZATIONS
  • 15.4 RELATED REPORTS
  • 15.5 AUTHOR DETAILS
LIST OF TABLES
 
  • TABLE 1 REPORT LIMITATIONS AND ASSOCIATED RISKS
  • TABLE 2 ROLE OF COMPANIES IN AI VISION ECOSYSTEM
  • TABLE 3 AVERAGE SELLING PRICE TREND OF VISION PLATFORM OFFERINGS OF KEY PLAYERS, BY FEATURE, 2023
  • TABLE 4 AVERAGE SELLING PRICE TREND OF VISION PLATFORMS OFFERED BY KEY PLAYERS, 2023
  • TABLE 5 AI VISION MARKET: PORTER'S FIVE FORCES ANALYSIS
  • TABLE 6 INFLUENCE OF STAKEHOLDERS ON BUYING PROCESS FOR TOP 3 VERTICALS
  • TABLE 7 KEY BUYING CRITERIA FOR TOP 3 VERTICALS
  • TABLE 8 IMPORT SCENARIO FOR HS CODE 852580-COMPLIANT PRODUCTS, BY COUNTRY, 2019–20203 (USD MILLION)
  • TABLE 9 EXPORT SCENARIO FOR HS CODE 852580-COMPLIANT PRODUCTS, BY COUNTRY, 2019–20203 (USD MILLION)
  • TABLE 10 AI VISION MARKET: PATENTS, 2020–2024
  • TABLE 11 AI VISION MARKET: MAJOR CONFERENCES AND EVENTS, 2024–2025
  • TABLE 12 NORTH AMERICA: REGULATORY BODIES, GOVERNMENT AGENCIES, AND OTHER ORGANIZATIONS
  • TABLE 13 EUROPE: REGULATORY BODIES, GOVERNMENT AGENCIES, AND OTHER ORGANIZATIONS
  • TABLE 14 ASIA PACIFIC: REGULATORY BODIES, GOVERNMENT AGENCIES, AND OTHER ORGANIZATIONS
  • TABLE 15 ROW: REGULATORY BODIES, GOVERNMENT AGENCIES, AND OTHER ORGANIZATIONS
  • TABLE 16 MAJOR STANDARDS AND REGULATIONS IN NORTH AMERICA
  • TABLE 17 MAJOR STANDARDS AND REGULATIONS IN EUROPE
  • TABLE 18 MAJOR STANDARDS AND REGULATIONS IN ASIA PACIFIC
  • TABLE 19 MAJOR STANDARDS AND REGULATIONS IN ROW
  • TABLE 20 AI VISION MARKET, BY OFFERING, 2020–2023 (USD MILLION)
  • TABLE 21 AI VISION MARKET, BY OFFERING, 2024–2029 (USD MILLION)
  • TABLE 22 VISION PLATFORMS: AI VISION MARKET, BY REGION, 2020–2023 (USD MILLION)
  • TABLE 23 VISION PLATFORMS: AI VISION MARKET, BY REGION, 2024–2029 (USD MILLION)
  • TABLE 24 VISION SOFTWARE: AI VISION MARKET, BY REGION, 2020–2023 (USD MILLION)
  • TABLE 25 VISION SOFTWARE: AI VISION MARKET, BY REGION, 2024–2029 (USD MILLION)
  • TABLE 26 VISION SOFTWARE: AI VISION MARKET, BY TYPE, 2020–2023 (USD MILLION)
  • TABLE 27 VISION SOFTWARE: AI VISION MARKET, BY TYPE, 2024–2029 (USD MILLION)
  • TABLE 28 CUSTOM SOLUTIONS: AI VISION MARKET, BY REGION, 2020–2023 (USD MILLION)
  • TABLE 29 CUSTOM SOLUTIONS: AI VISION MARKET, BY REGION, 2024–2029 (USD MILLION)
  • TABLE 30 AI VISION MARKET, BY SERVICE TYPE, 2020–2023 (USD MILLION)
  • TABLE 31 AI VISION MARKET, BY SERVICE TYPE, 2024–2029 (USD MILLION)
  • TABLE 32 SPATIAL ANALYSIS: AI VISION MARKET, BY TYPE, 2020–2023 (USD MILLION)
  • TABLE 33 SPATIAL ANALYSIS: AI VISION MARKET, BY TYPE, 2024–2029 (USD MILLION)
  • TABLE 34 AI VISION MARKET, BY TECHNOLOGY, 2020–2023 (USD MILLION)
  • TABLE 35 AI VISION MARKET, BY TECHNOLOGY, 2024–2029 (USD MILLION)
  • TABLE 36 MACHINE LEARNING: AI VISION MARKET, BY TECHNOLOGY TYPE, 2020–2023 (USD MILLION)
  • TABLE 37 MACHINE LEARNING: AI VISION MARKET, BY TECHNOLOGY TYPE, 2024–2029 (USD MILLION)
  • TABLE 38 MACHINE LEARNING: AI VISION MARKET, BY REGION, 2020–2023 (USD MILLION)
  • TABLE 39 MACHINE LEARNING: AI VISION MARKET, BY REGION, 2024–2029 (USD MILLION)
  • TABLE 40 DEEP LEARNING: AI VISION MARKET, BY REGION, 2020–2023 (USD MILLION)
  • TABLE 41 DEEP LEARNING: AI VISION MARKET, BY REGION, 2024–2029 (USD MILLION)
  • TABLE 42 CONVOLUTIONAL NEURAL NETWORKS: AI VISION MARKET, BY REGION, 2020–2023 (USD MILLION)
  • TABLE 43 CONVOLUTIONAL NEURAL NETWORKS: AI VISION MARKET, BY REGION, 2024–2029 (USD MILLION)
  • TABLE 44 GENERATIVE AI: AI VISION MARKET, BY REGION, 2020–2023 (USD MILLION)
  • TABLE 45 GENERATIVE AI: AI VISION MARKET, BY REGION, 2024–2029 (USD MILLION)
  • TABLE 46 AI VISION MARKET, BY MODE OF OPERATION, 2020–2023 (USD MILLION)
  • TABLE 47 AI VISION MARKET, BY MODE OF OPERATION, 2024–2029 (USD MILLION)
  • TABLE 48 EDGE INFERENCING: AI VISION MARKET, BY REGION, 2020–2023 (USD MILLION)
  • TABLE 49 EDGE INFERENCING: AI VISION MARKET, BY REGION, 2024–2029 (USD MILLION)
  • TABLE 50 EDGE INFERENCING: AI VISION MARKET IN NORTH AMERICA, BY COUNTRY, 2020–2023 (USD MILLION)
  • TABLE 51 EDGE INFERENCING: AI VISION MARKET IN NORTH AMERICA, BY COUNTRY, 2024–2029 (USD MILLION)
  • TABLE 52 EDGE INFERENCING: AI VISION MARKET IN EUROPE, BY COUNTRY, 2020–2023 (USD MILLION)
  • TABLE 53 EDGE INFERENCING: AI VISION MARKET IN EUROPE, BY COUNTRY, 2024–2029 (USD MILLION)
  • TABLE 54 EDGE INFERENCING: AI VISION MARKET IN ASIA PACIFIC, BY COUNTRY, 2020–2023 (USD MILLION)
  • TABLE 55 EDGE INFERENCING: AI VISION MARKET IN ASIA PACIFIC, BY COUNTRY, 2024–2029 (USD MILLION)
  • TABLE 56 EDGE INFERENCING: AI VISION MARKET IN ROW, BY REGION, 2020–2023 (USD MILLION)
  • TABLE 57 EDGE INFERENCING: AI VISION MARKET IN ROW, BY REGION, 2024–2029 (USD MILLION)
  • TABLE 58 CLOUD-BASED LEARNING: AI VISION MARKET, BY REGION, 2020–2023 (USD MILLION)
  • TABLE 59 CLOUD-BASED LEARNING: AI VISION MARKET, BY REGION, 2024–2029 (USD MILLION)
  • TABLE 60 CLOUD-BASED LEARNING: AI VISION MARKET IN NORTH AMERICA, BY COUNTRY, 2020–2023 (USD MILLION)
  • TABLE 61 CLOUD-BASED LEARNING: AI VISION MARKET IN NORTH AMERICA, BY COUNTRY, 2024–2029 (USD MILLION)
  • TABLE 62 CLOUD-BASED LEARNING: AI VISION MARKET IN EUROPE, BY COUNTRY, 2020–2023 (USD MILLION)
  • TABLE 63 CLOUD-BASED LEARNING: AI VISION MARKET IN EUROPE, BY COUNTRY, 2024–2029 (USD MILLION)
  • TABLE 64 CLOUD-BASED LEARNING: AI VISION MARKET IN ASIA PACIFIC, BY COUNTRY, 2020–2023 (USD MILLION)
  • TABLE 65 CLOUD-BASED LEARNING: AI VISION MARKET IN ASIA PACIFIC, BY COUNTRY, 2024–2029 (USD MILLION)
  • TABLE 66 CLOUD-BASED LEARNING: AI VISION MARKET IN ROW, BY REGION, 2020–2023 (USD MILLION)
  • TABLE 67 CLOUD-BASED LEARNING: AI VISION MARKET IN ROW, BY REGION, 2024–2029 (USD MILLION)
  • TABLE 68 AI VISION MARKET, BY VERTICAL, 2020–2023 (USD MILLION)
  • TABLE 69 AI VISION MARKET, BY VERTICAL, 2024–2029 (USD MILLION)
  • TABLE 70 TRANSPORTATION & LOGISTICS: AI VISION MARKET, BY REGION, 2020–2023 (USD MILLION)
  • TABLE 71 TRANSPORTATION & LOGISTICS: AI VISION MARKET, BY REGION, 2024–2029 (USD MILLION)
  • TABLE 72 RETAIL: AI VISION MARKET, BY REGION, 2020–2023 (USD MILLION)
  • TABLE 73 RETAIL: AI VISION MARKET, BY REGION, 2024–2029 (USD MILLION)
  • TABLE 74 HEALTHCARE: AI VISION MARKET, BY REGION, 2020–2023 (USD MILLION)
  • TABLE 75 HEALTHCARE: AI VISION MARKET, BY REGION, 2024–2029 (USD MILLION)
  • TABLE 76 MANUFACTURING: AI VISION MARKET, BY REGION, 2020–2023 (USD MILLION)
  • TABLE 77 MANUFACTURING: AI VISION MARKET, BY REGION, 2024–2029 (USD MILLION)
  • TABLE 78 AGRICULTURE: AI VISION MARKET, BY REGION, 2020–2023 (USD MILLION)
  • TABLE 79 AGRICULTURE: AI VISION MARKET, BY REGION, 2024–2029 (USD MILLION)
  • TABLE 80 OIL & GAS: AI VISION MARKET, BY REGION, 2020–2023 (USD MILLION)
  • TABLE 81 OIL & GAS: AI VISION MARKET, BY REGION, 2024–2029 (USD MILLION)
  • TABLE 82 CONSTRUCTION: AI VISION MARKET, BY REGION, 2020–2023 (USD MILLION)
  • TABLE 83 CONSTRUCTION: AI VISION MARKET, BY REGION, 2024–2029 (USD MILLION)
  • TABLE 84 OTHER VERTICALS: AI VISION MARKET, BY REGION, 2020–2023 (USD MILLION)
  • TABLE 85 OTHER VERTICALS: AI VISION MARKET, BY REGION, 2024–2029 (USD MILLION)
  • TABLE 86 AI VISION MARKET, BY REGION, 2020–2023 (USD MILLION)
  • TABLE 87 AI VISION MARKET, BY REGION, 2024–2029 (USD MILLION)
  • TABLE 88 NORTH AMERICA: AI VISION MARKET, BY COUNTRY, 2020–2023 (USD MILLION)
  • TABLE 89 NORTH AMERICA: AI VISION MARKET, BY COUNTRY, 2024–2029 (USD MILLION)
  • TABLE 90 NORTH AMERICA: AI VISION MARKET, BY VERTICAL, 2020–2023 (USD MILLION)
  • TABLE 91 NORTH AMERICA: AI VISION MARKET, BY VERTICAL, 2024–2029 (USD MILLION)
  • TABLE 92 NORTH AMERICA: AI VISION MARKET, BY MODE OF OPERATION, 2020–2023 (USD MILLION)
  • TABLE 93 NORTH AMERICA: AI VISION MARKET, BY MODE OF OPERATION, 2024–2029 (USD MILLION)
  • TABLE 94 NORTH AMERICA: AI VISION MARKET, BY TECHNOLOGY, 2020–2023 (USD MILLION)
  • TABLE 95 NORTH AMERICA: AI VISION MARKET, BY TECHNOLOGY, 2024–2029 (USD MILLION)
  • TABLE 96 NORTH AMERICA: AI VISION MARKET FOR MACHINE LEARNING, BY TECHNOLOGY TYPE, 2020–2023 (USD MILLION)
  • TABLE 97 NORTH AMERICA: AI VISION MARKET FOR MACHINE LEARNING, BY TECHNOLOGY TYPE, 2024–2029 (USD MILLION)
  • TABLE 98 NORTH AMERICA: AI VISION MARKET, BY OFFERING, 2020–2023 (USD MILLION)
  • TABLE 99 NORTH AMERICA: AI VISION MARKET, BY OFFERING, 2024–2029 (USD MILLION)
  • TABLE 100 US: AI VISION MARKET, BY MODE OF OPERATION, 2020–2023 (USD MILLION)
  • TABLE 101 US: AI VISION MARKET, BY MODE OF OPERATION, 2024–2029 (USD MILLION)
  • TABLE 102 CANADA: AI VISION MARKET, BY MODE OF OPERATION, 2020–2023 (USD MILLION)
  • TABLE 103 CANADA: AI VISION MARKET, BY MODE OF OPERATION, 2024–2029 (USD MILLION)
  • TABLE 104 MEXICO: AI VISION MARKET, BY MODE OF OPERATION, 2020–2023 (USD MILLION)
  • TABLE 105 MEXICO: AI VISION MARKET, BY MODE OF OPERATION, 2024–2029 (USD MILLION)
  • TABLE 106 EUROPE: AI VISION MARKET, BY COUNTRY, 2020–2023 (USD MILLION)
  • TABLE 107 EUROPE: AI VISION MARKET, BY COUNTRY, 2024–2029 (USD MILLION)
  • TABLE 108 EUROPE: AI VISION MARKET, BY VERTICAL, 2020–2023 (USD MILLION)
  • TABLE 109 EUROPE: AI VISION MARKET, BY VERTICAL, 2024–2029 (USD MILLION)
  • TABLE 110 EUROPE: AI VISION MARKET, BY MODE OF OPERATION, 2020–2023 (USD MILLION)
  • TABLE 111 EUROPE: AI VISION MARKET, BY MODE OF OPERATION, 2024–2029 (USD MILLION)
  • TABLE 112 EUROPE: AI VISION MARKET, BY TECHNOLOGY, 2020–2023 (USD MILLION)
  • TABLE 113 EUROPE: AI VISION MARKET, BY TECHNOLOGY, 2024–2029 (USD MILLION)
  • TABLE 114 EUROPE: AI VISION MARKET FOR MACHINE LEARNING, BY TECHNOLOGY TYPE, 2020–2023 (USD MILLION)
  • TABLE 115 EUROPE: AI VISION MARKET FOR MACHINE LEARNING, BY TECHNOLOGY TYPE, 2024–2029 (USD MILLION)
  • TABLE 116 EUROPE: AI VISION MARKET, BY OFFERING, 2020–2023 (USD MILLION)
  • TABLE 117 EUROPE: AI VISION MARKET, BY OFFERING, 2024–2029 (USD MILLION)
  • TABLE 118 GERMANY: AI VISION MARKET, BY MODE OF OPERATION, 2020–2023 (USD MILLION)
  • TABLE 119 GERMANY: AI VISION MARKET, BY MODE OF OPERATION, 2024–2029 (USD MILLION)
  • TABLE 120 UK: AI VISION MARKET, BY MODE OF OPERATION, 2020–2023 (USD MILLION)
  • TABLE 121 UK: AI VISION MARKET, BY MODE OF OPERATION, 2024–2029 (USD MILLION)
  • TABLE 122 FRANCE: AI VISION MARKET, BY MODE OF OPERATION, 2020–2023 (USD MILLION)
  • TABLE 123 FRANCE: AI VISION MARKET, BY MODE OF OPERATION, 2024–2029 (USD MILLION)
  • TABLE 124 ITALY: AI VISION MARKET, BY MODE OF OPERATION, 2020–2023 (USD MILLION)
  • TABLE 125 ITALY: AI VISION MARKET, BY MODE OF OPERATION, 2024–2029 (USD MILLION)
  • TABLE 126 REST OF EUROPE: AI VISION MARKET, BY MODE OF OPERATION, 2020–2023 (USD MILLION)
  • TABLE 127 REST OF EUROPE: AI VISION MARKET, BY MODE OF OPERATION, 2024–2029 (USD MILLION)
  • TABLE 128 ASIA PACIFIC: AI VISION MARKET, BY COUNTRY, 2020–2023 (USD MILLION)
  • TABLE 129 ASIA PACIFIC: AI VISION MARKET, BY COUNTRY, 2024–2029 (USD MILLION)
  • TABLE 130 ASIA PACIFIC: AI VISION MARKET, BY VERTICAL, 2020–2023 (USD MILLION)
  • TABLE 131 ASIA PACIFIC: AI VISION MARKET, BY VERTICAL, 2024–2029 (USD MILLION)
  • TABLE 132 ASIA PACIFIC: AI VISION MARKET, BY MODE OF OPERATION, 2020–2023 (USD MILLION)
  • TABLE 133 ASIA PACIFIC: AI VISION MARKET, BY MODE OF OPERATION, 2024–2029 (USD MILLION)
  • TABLE 134 ASIA PACIFIC: AI VISION MARKET, BY TECHNOLOGY, 2020–2023 (USD MILLION)
  • TABLE 135 ASIA PACIFIC: AI VISION MARKET, BY TECHNOLOGY, 2024–2029 (USD MILLION)
  • TABLE 136 ASIA PACIFIC: AI VISION MARKET FOR MACHINE LEARNING, BY TECHNOLOGY TYPE, 2020–2023 (USD MILLION)
  • TABLE 137 ASIA PACIFIC: AI VISION MARKET FOR MACHINE LEARNING, BY TECHNOLOGY TYPE, 2024–2029 (USD MILLION)
  • TABLE 138 ASIA PACIFIC: AI VISION MARKET, BY OFFERING, 2020–2023 (USD MILLION)
  • TABLE 139 ASIA PACIFIC: AI VISION MARKET, BY OFFERING, 2024–2029 (USD MILLION)
  • TABLE 140 CHINA: AI VISION MARKET, BY MODE OF OPERATION, 2020–2023 (USD MILLION)
  • TABLE 141 CHINA: AI VISION MARKET, BY MODE OF OPERATION, 2024–2029 (USD MILLION)
  • TABLE 142 JAPAN: AI VISION MARKET, BY MODE OF OPERATION, 2020–2023 (USD MILLION)
  • TABLE 143 JAPAN: AI VISION MARKET, BY MODE OF OPERATION, 2024–2029 (USD MILLION)
  • TABLE 144 SOUTH KOREA: AI VISION MARKET, BY MODE OF OPERATION, 2020–2023 (USD MILLION)
  • TABLE 145 SOUTH KOREA: AI VISION MARKET, BY MODE OF OPERATION, 2024–2029 (USD MILLION)
  • TABLE 146 REST OF ASIA PACIFIC: AI VISION MARKET, BY MODE OF OPERATION, 2020–2023 (USD MILLION)
  • TABLE 147 REST OF ASIA PACIFIC: AI VISION MARKET, BY MODE OF OPERATION, 2024–2029 (USD MILLION)
  • TABLE 148 ROW: AI VISION MARKET, BY REGION, 2020–2023 (USD MILLION)
  • TABLE 149 ROW: AI VISION MARKET, BY REGION, 2024–2029 (USD MILLION)
  • TABLE 150 ROW: AI VISION MARKET, BY VERTICAL, 2020–2023 (USD MILLION)
  • TABLE 151 ROW: AI VISION MARKET, BY VERTICAL, 2024–2029 (USD MILLION)
  • TABLE 152 ROW: AI VISION MARKET, BY MODE OF OPERATION, 2020–2023 (USD MILLION)
  • TABLE 153 ROW: AI VISION MARKET, BY MODE OF OPERATION, 2024–2029 (USD MILLION)
  • TABLE 154 ROW: AI VISION MARKET, BY TECHNOLOGY, 2020–2023 (USD MILLION)
  • TABLE 155 ROW: AI VISION MARKET, BY TECHNOLOGY, 2024–2029 (USD MILLION)
  • TABLE 156 ROW: AI VISION MARKET FOR MACHINE LEARNING, BY TECHNOLOGY TYPE, 2020–2023 (USD MILLION)
  • TABLE 157 ROW: AI VISION MARKET, FOR MACHINE LEARNING, BY TECHNOLOGY TYPE, 2024–2029 (USD MILLION)
  • TABLE 158 ROW: AI VISION MARKET, BY OFFERING, 2020–2023 (USD MILLION)
  • TABLE 159 ROW: AI VISION MARKET, BY OFFERING, 2024–2029 (USD MILLION)
  • TABLE 160 MIDDLE EAST: AI VISION MARKET, BY MODE OF OPERATION, 2020–2023 (USD MILLION)
  • TABLE 161 MIDDLE EAST: AI VISION MARKET, BY MODE OF OPERATION, 2024–2029 (USD MILLION)
  • TABLE 162 AFRICA: AI VISION MARKET, BY MODE OF OPERATION, 2020–2023 (USD MILLION)
  • TABLE 163 AFRICA: AI VISION MARKET, BY MODE OF OPERATION, 2024–2029 (USD MILLION)
  • TABLE 164 SOUTH AMERICA: AI VISION MARKET, BY MODE OF OPERATION, 2020–2023 (USD MILLION)
  • TABLE 165 SOUTH AMERICA: AI VISION MARKET, BY MODE OF OPERATION, 2024–2029 (USD MILLION)
  • TABLE 166 OVERVIEW OF STRATEGIES ADOPTED BY MAJOR COMPANIES, 2021–2024
  • TABLE 167 AI VISION MARKET: DEGREE OF COMPETITION, 2023
  • TABLE 168 AI VISION MARKET: MODE OF OPERATION FOOTPRINT
  • TABLE 169 AI VISION MARKET: TECHNOLOGY FOOTPRINT
  • TABLE 170 AI VISION MARKET: OFFERING FOOTPRINT
  • TABLE 171 AI VISION MARKET: VERTICAL FOOTPRINT
  • TABLE 172 AI VISION MARKET: REGION FOOTPRINT
  • TABLE 173 AI VISION MARKET: LIST OF KEY STARTUPS/SMES
  • TABLE 174 AI VISION MARKET: COMPETITIVE BENCHMARKING OF KEY STARTUPS/SMES
  • TABLE 175 AI VISION MARKET: PRODUCT LAUNCHES/DEVELOPMENTS, JANUARY 2021–JUNE 2024
  • TABLE 176 AI VISION MARKETS MARKET: DEALS, JANUARY 2021–JUNE 2024
  • TABLE 177 NVIDIA CORPORATION: COMPANY OVERVIEW
  • TABLE 178 NVIDIA CORPORATION: PRODUCTS/SOLUTIONS/SERVICES OFFERED
  • TABLE 179 NVIDIA CORPORATION: PRODUCT LAUNCHES/DEVELOPMENTS
  • TABLE 180 MICROSOFT CORPORATION: COMPANY OVERVIEW
  • TABLE 181 MICROSOFT CORPORATION: PRODUCTS/SOLUTIONS/SERVICES OFFERED
  • TABLE 182 MICROSOFT CORPORATION: PRODUCT LAUNCHES/DEVELOPMENTS
  • TABLE 183 MICROSOFT CORPORATION: DEALS
  • TABLE 184 INTEL CORPORATION: COMPANY OVERVIEW
  • TABLE 185 INTEL CORPORATION: PRODUCTS/SOLUTIONS/SERVICES OFFERED
  • TABLE 186 INTEL CORPORATION: PRODUCT LAUNCHES/DEVELOPMENTS
  • TABLE 187 ALPHABET INC.: COMPANY OVERVIEW
  • TABLE 188 ALPHABET INC.: PRODUCTS/SOLUTIONS/SERVICES OFFERED
  • TABLE 189 AMAZON.COM, INC.: COMPANY OVERVIEW
  • TABLE 190 AMAZON.COM, INC.: PRODUCTS/SOLUTIONS/SERVICES OFFERED
  • TABLE 191 AMAZON.COM, INC.: PRODUCT LAUNCHES/DEVELOPMENTS
  • TABLE 192 IBM: COMPANY OVERVIEW
  • TABLE 193 IBM: PRODUCTS/SOLUTIONS/SERVICES OFFERED
  • TABLE 194 IBM: PRODUCT LAUNCHES/DEVELOPMENTS
  • TABLE 195 ORACLE: COMPANY OVERVIEW
  • TABLE 196 ORACLE: PRODUCTS/SOLUTIONS/SERVICES OFFERED
  • TABLE 197 ORACLE: DEALS
  • TABLE 198 COGNEX CORPORATION: COMPANY OVERVIEW
  • TABLE 199 COGNEX CORPORATION: PRODUCTS/SOLUTIONS/SERVICES OFFERED
  • TABLE 200 COGNEX CORPORATION: PRODUCT LAUNCHES/DEVELOPMENTS
  • TABLE 201 QUALCOMM TECHNOLOGIES, INC.: COMPANY OVERVIEW
  • TABLE 202 QUALCOMM TECHNOLOGIES, INC.: PRODUCTS/SOLUTIONS/SERVICES OFFERED
  • TABLE 203 STMICROELECTRONICS: COMPANY OVERVIEW
  • TABLE 204 STMICROELECTRONICS: PRODUCTS/SOLUTIONS/SERVICES OFFERED
  • TABLE 205 STMICROELECTRONICS: DEALS
  • TABLE 206 AVNET, INC.: COMPANY OVERVIEW
  • TABLE 207 AVNET, INC.: PRODUCTS/SOLUTIONS/SERVICES OFFERED
  • TABLE 208 AVNET, INC.: PRODUCT LAUNCHES/DEVELOPMENTS
  • TABLE 209 AVEVA?GROUP LIMITED: COMPANY OVERVIEW
  • TABLE 210 AVEVA?GROUP LIMITED: PRODUCTS/SOLUTIONS/SERVICES OFFERED
  • TABLE 211 AVEVA?GROUP LIMITED: PRODUCT LAUNCHES/DEVELOPMENTS
  • TABLE 212 SYMPHONYAI: COMPANY OVERVIEW
  • TABLE 213 APERA AI: COMPANY OVERVIEW
  • TABLE 214 CHOOCH: COMPANY OVERVIEW
  • TABLE 215 IRONYUN INC.: COMPANY OVERVIEW
  • TABLE 216 KYUNGWOO SYSTECH, INC.: COMPANY OVERVIEW
  • TABLE 217 LANDINGAI: COMPANY OVERVIEW
  • TABLE 218 ML6: COMPANY OVERVIEW
  • TABLE 219 OPENSISTEMAS: COMPANY OVERVIEW
  • TABLE 220 ROBOVISION BV: COMPANY OVERVIEW
  • TABLE 221 SENSETIME: COMPANY OVERVIEW
  • TABLE 222 SEVENLAB: COMPANY OVERVIEW
  • TABLE 223 SOLOMON TECHNOLOGY CORPORATION: COMPANY OVERVIEW
  • TABLE 224 VISO.AI: COMPANY OVERVIEW
  • TABLE 225 ZEBRA TECHNOLOGIES: COMPANY OVERVIEW
LIST OF FIGURES
 
  • FIGURE 1 AI VISION MARKET: RESEARCH DESIGN
  • FIGURE 2 MARKET SIZE ESTIMATION METHODOLOGY: SUPPLY-SIDE ANALYSIS
  • FIGURE 3 MARKET SIZE ESTIMATION METHODOLOGY: APPROACH 2 (SUPPLY-SIDE)—IDENTIFICATION OF REVENUE GENERATED BY COMPANIES FROM SALES OF AI VISION SOLUTIONS
  • FIGURE 4 MARKET SIZE ESTIMATION METHODOLOGY: BOTTOM-UP APPROACH
  • FIGURE 5 MARKET SIZE ESTIMATION METHODOLOGY: TOP-DOWN APPROACH
  • FIGURE 6 MARKET BREAKDOWN AND DATA TRIANGULATION
  • FIGURE 7 VISION PLATFORMS SEGMENT TO LEAD AI VISION MARKET FROM 2024 TO 2029
  • FIGURE 8 IMAGE RECOGNITION SEGMENT TO ACCOUNT FOR LARGEST MARKET SHARE THROUGHOUT FORECAST PERIOD
  • FIGURE 9 HEALTHCARE SEGMENT TO COMMAND AI VISION MARKET BETWEEN 2024 AND 2029
  • FIGURE 10 NORTH AMERICA TO ACCOUNT FOR LARGEST SHARE OF AI VISION MARKET IN 2024
  • FIGURE 11 INTEGRATION OF AI WITH CLOUD AND EDGE COMPUTING TECHNOLOGIES ACROSS INDUSTRIES TO BOOST AI VISION PLATFORM ADOPTION
  • FIGURE 12 US AND MANUFACTURING VERTICAL TO HOLD LARGEST SHARE OF NORTH AMERICAN AI VISION MARKET IN 2024
  • FIGURE 13 HEALTHCARE VERTICAL TO ACCOUNT FOR LARGEST SHARE OF AI VISION MARKET IN ASIA PACIFIC THROUGHOUT FORECAST PERIOD
  • FIGURE 14 CHINA TO EXHIBIT HIGHEST CAGR IN GLOBAL AI VISION MARKET FROM 2024 TO 2029
  • FIGURE 15 AI VISION MARKET DYNAMICS: DRIVERS, RESTRAINTS, OPPORTUNITIES, AND CHALLENGES
  • FIGURE 16 IMPACT OF DRIVERS ON AI VISION MARKET
  • FIGURE 17 IMPACT OF RESTRAINTS ON AI VISION MARKET
  • FIGURE 18 IMPACT OF OPPORTUNITIES ON AI VISION MARKET
  • FIGURE 19 IMPACT OF CHALLENGES ON AI VISION MARKET
  • FIGURE 20 VALUE CHAIN ANALYSIS: AI VISION MARKET
  • FIGURE 21 AI VISION ECOSYSTEM PARTICIPANTS
  • FIGURE 22 TRENDS/DISRUPTIONS INFLUENCING CUSTOMER BUSINESS
  • FIGURE 23 AVERAGE SELLING PRICE TREND OF VISION PLATFORMS OFFERED BY KEY PLAYERS
  • FIGURE 24 PORTER'S FIVE FORCES ANALYSIS: AI VISION MARKET
  • FIGURE 25 INFLUENCE OF STAKEHOLDERS ON BUYING PROCESS FOR TOP 3 VERTICALS
  • FIGURE 26 KEY BUYING CRITERIA FOR TOP 3 VERTICALS
  • FIGURE 27 FUNDS GATHERED BY COMPANIES IN AI VISION MARKET
  • FIGURE 28 IMPORT DATA FOR HS CODE 852580-COMPLIANT PRODUCTS FOR TOP 5 COUNTRIES, 2019–20203
  • FIGURE 29 EXPORT DATA FOR HS CODE 852580-COMPLIANT PRODUCTS FOR TOP 5 COUNTRIES, 2019–2023
  • FIGURE 30 NUMBER OF PATENTS APPLIED AND GRANTED IN AI VISION MARKET, 2014–2023
  • FIGURE 31 VISION PLATFORMS SEGMENT TO DOMINATE AI VISION MARKET THROUGHOUT FORECAST PERIOD
  • FIGURE 32 IMAGE RECOGNITION TO CAPTURE LARGEST MARKET SHARE THROUGHOUT FORECAST PERIOD
  • FIGURE 33 MACHINE LEARNING TO CAPTURE LARGER SHARE OF AI VISION MARKET DURING FORECAST PERIOD
  • FIGURE 34 CLOUD-BASED LEARNING SEGMENT TO HOLD LARGER SHARE OF AI VISION MARKET DURING FORECAST PERIOD
  • FIGURE 35 HEALTHCARE TO HOLD LARGEST SHARE OF AI VISION MARKET IN 2029
  • FIGURE 36 ASIA PACIFIC TO DOMINATE AI VISION MARKET DURING FORECAST PERIOD
  • FIGURE 37 NORTH AMERICA: AI VISION MARKET SNAPSHOT
  • FIGURE 38 EUROPE: AI VISION MARKET SNAPSHOT
  • FIGURE 39 ASIA PACIFIC: AI VISION MARKET SNAPSHOT
  • FIGURE 40 REVENUE ANALYSIS OF KEY PLAYERS IN AI VISION MARKET, 2019–2023
  • FIGURE 41 MARKET SHARE ANALYSIS OF MAJOR PLAYERS, 2023
  • FIGURE 42 COMPANY VALUATION, JUNE 2024
  • FIGURE 43 FINANCIAL METRICS (EV/EBITDA), 2023
  • FIGURE 44 BRAND/PRODUCT COMPARISON
  • FIGURE 45 AI VISION MARKET: COMPANY EVALUATION MATRIX (KEY PLAYERS), 2023
  • FIGURE 46 AI VISION MARKET: COMPANY FOOTPRINT
  • FIGURE 47 AI VISION MARKET: COMPANY EVALUATION MATRIX (SMES/STARTUPS), 2023
  • FIGURE 48 NVIDIA CORPORATION: COMPANY SNAPSHOT
  • FIGURE 49 MICROSOFT CORPORATION: COMPANY SNAPSHOT
  • FIGURE 50 INTEL CORPORATION: COMPANY SNAPSHOT
  • FIGURE 51 ALPHABET INC.: COMPANY SNAPSHOT
  • FIGURE 52 AMAZON.COM, INC.: COMPANY SNAPSHOT
  • FIGURE 53 IBM: COMPANY SNAPSHOT
  • FIGURE 54 ORACLE: COMPANY SNAPSHOT
  • FIGURE 55 COGNEX CORPORATION: COMPANY SNAPSHOT
  • FIGURE 56 QUALCOMM TECHNOLOGIES, INC.: COMPANY SNAPSHOT
  • FIGURE 57 STMICROELECTRONICS: COMPANY SNAPSHOT
  • FIGURE 58 AVNET, INC.: COMPANY SNAPSHOT

The study used four major activities to estimate the market size of the AI vision. Exhaustive secondary research was conducted to gather information on the market and its peer and parent markets. The next step was to validate these findings, assumptions, and sizing with industry experts across the value chain through primary research. Both top-down and bottom-up approaches were employed to estimate the total market size. Finally, market breakdown and data triangulation methods were utilized to estimate the market size for different segments and subsegments.

Secondary Research

The research methodology used to estimate and forecast the size of the AI vision market began with the acquisition of data related to the revenues of key vendors in the market through secondary research. Various secondary sources have been referred to in the secondary research process to identify and collect information for this study. Secondary sources include annual reports, press releases, and investor presentations of companies; white papers, journals, certified publications, and articles by recognized authors; websites; directories; and databases. Secondary research has mainly been used to obtain key information about the value chain of the AI vision market, key players, market classification, and segmentation according to the industry trends to the bottom-most level, geographic markets, and key developments from market and technology-oriented perspectives. Secondary data has been collected and analyzed to determine the overall market size, further validated through primary research. The secondary research referred to for this research study involves the Institute of Electrical and Electronics Engineers (IEEE), Edge AI and Vision Alliance, International Society of Automation (ISA), Microsoft, General Data Protection Regulation (GDPR), and Partnership on AI. Moreover, the study involved extensive secondary sources, directories, and databases, such as Hoovers, Bloomberg Businessweek, Factiva, and OneSource, to identify and collect valuable information for a technical, market-oriented, and commercial study of the AI vision market. Vendor offerings have been taken into consideration to determine market segmentation.

Primary Research

In the primary research, various stakeholders from both the supply and demand sides have been interviewed to obtain the qualitative and quantitative information relevant to this report. Primary sources from the supply side include the key industry participants, subject-matter experts (SMEs), and C-level executives and consultants from various key companies and organizations in the AI vision ecosystem. After the complete market engineering (including calculations for the market statistics, the market breakdown, the market size estimations, the market forecasting, and the data triangulation), extensive primary research has been conducted to verify and validate the critical market numbers obtained. Extensive qualitative and quantitative analyses have been performed during the market engineering process to list key information/insights throughout the report. Extensive primary research has been conducted after understanding the AI vision market scenario through secondary research. Several primary interviews have been conducted with market experts from the demand and supply-side players across key regions: North America, Europe, Asia Pacific, and the Rest of the World (Middle East, Africa, and South America). Various primary sources from the supply and demand sides of the market have been interviewed to obtain qualitative and quantitative information. Following is the breakdown of the primary respondents.

Primary data has been collected through questionnaires, emails, and telephonic interviews. In the canvassing of primaries, various departments within organizations, such as sales, operations, and administration, were covered to provide a holistic viewpoint in our report. After interacting with industry experts, brief sessions were conducted with highly experienced independent consultants to reinforce the findings from our primaries. This and the in-house subject matter experts’ opinions have led us to the findings described in the remainder of this report.

ai vision market Size, and Share

Note: The three tiers of the companies are defined based on their total revenue in 2023: Tier 1 - revenue greater than or equal to USD 1 billion; Tier 2 - revenue between USD 100 million and USD 1 billion; and Tier 3 revenue less than or equal to USD 100 million. Other designations include sales managers, marketing managers, and product managers.

About the assumptions considered for the study, To know download the pdf brochure

Market Size Estimation

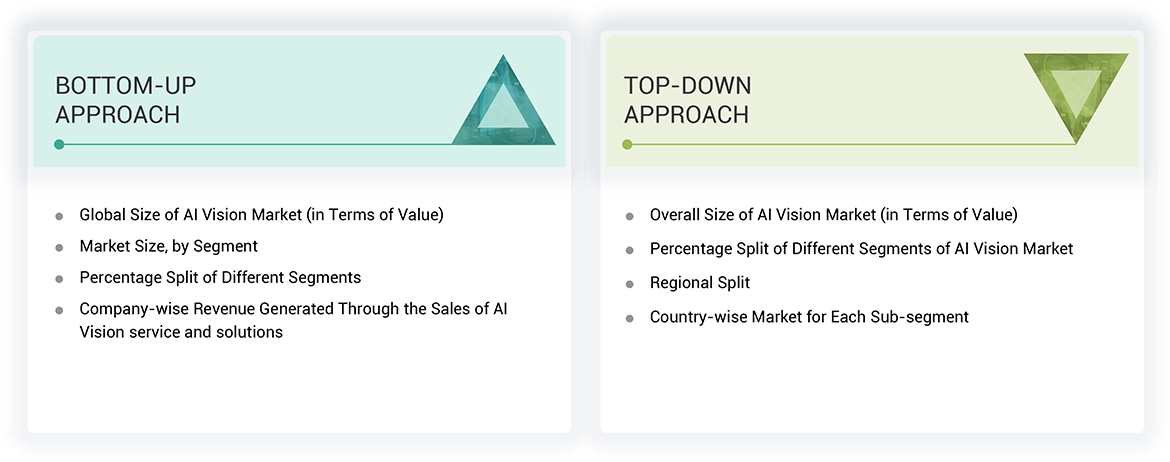
Both top-down and bottom-up approaches were utilized to estimate and validate the size of the AI vision market and its submarkets. Secondary research was conducted to identify the key players in the market, and primary and secondary research was used to determine their market share in specific regions. The entire process involved studying top players' annual and financial reports and conducting extensive interviews with industry leaders such as CEOs, VPs, directors, and marketing executives. Secondary sources were used to determine all percentage shares and breakdowns, which were verified through primary sources. All parameters that could impact the markets covered in this research study were accounted for, analyzed in detail, verified through primary research, and consolidated to obtain the final quantitative and qualitative data.

AI Vision Market Market : Top-Down and Bottom-Up Approach

ai vision market Top Down and Bottom Up Approach

Data Triangulation

Once the overall size of the AI vision market was determined using the methods described above, it was divided into multiple segments and subsegments. Market engineering was performed for each segment and subsegment using market breakdown and data triangulation methods, as applicable, to obtain accurate statistics. To triangulate the data, various factors and trends from the demand and supply sides were studied. The market was validated using both top-down and bottom-up approaches.

Market Definition

AI vision refers to integrating artificial intelligence with computer vision technologies to enable machines to interpret and analyze visual data. It is widely used across various verticals, such as healthcare, manufacturing, transport & logistics, retail, agriculture, oil & gas, construction, and other verticals. AI vision offers several advantages, such as real-time object detection, image recognition, heatmap analysis, optical character recognition, improved accuracy in visual analysis, automation of complex tasks, and enhanced decision-making processes. By leveraging machine learning and deep learning technology, AI vision systems can adapt and improve over time, providing greater efficiency and precision across these applications.

Key Stakeholders

  • Raw data providers
  • Cloud storage providers
  • AI vision system providers
  • AI vision software providers
  • Integrators and solution providers
  • Professional services/solution providers
  • Research institutions and organizations

Report Objectives

  • To estimate and forecast the size of the AI Vision Market, in terms of value, based on offering, service type, technology, mode of operation, vertical, and region
  • To describe use cases of AI vision technology
  • To describe and forecast the market size, in terms of value, for four major regions-North America, Europe, Asia Pacific, and Rest of the World (RoW)
  • To provide detailed information regarding major factors such as drivers, restraints, opportunities, and challenges influencing the market growth
  • To provide a detailed overview of the AI vision value chain
  • To strategically analyze micromarkets regarding individual market trends, growth prospects, and contributions to the total market
  • To strategically profile key players and comprehensively analyze their market position in terms of ranking and core competencies, along with a detailed competitive landscape for the market leaders
  • To analyze major growth strategies such as product launches/developments and acquisitions adopted by the key market players to enhance their market position
  • To analyze the impact of the macroeconomic factors impacting the AI vision market

Available Customizations

With the given market data, MarketsandMarkets offers customizations according to the specific requirements of companies. The following customization options are available for the report:

  • Detailed analysis and profiling of additional market players (up to 5)
  • Additional country-level analysis of the AI vision market

Product Analysis

  • Product matrix, which provides a detailed comparison of the product portfolio of each company in the AI vision market.

Previous Versions of this Report

"Our USP is "providing game-changing business opportunities reports with free customization" - so please feel free to provide us with your specific areas of interest / business challenges in much greater detail !!"

We appreciate your interest in this report. Once you fill out the form, you'll be immediately directed to an exclusive solution tailored to your needs. This high-value offering can help boost your revenue by 30% - a must-see opportunity for anyone looking to maximize growth.


By clicking the "Submit" button, you are agreeing to the Terms of Use and Privacy Policy.

Custom Market Research Services

We Will Customise The Research For You, In Case The Report Listed Above Does Not Meet With Your Requirements

Get 10% Free Customisation

Growth opportunities and latent adjacency in AI Vision Market

DMCA.com Protection Status