Data Virtualization Market by Component (Standalone Software, Data Integration Solution, Application Tool Solution), Deployment Mode (Cloud and On-Premises), Data Consumer, Enterprise Size, End-User, and Region - Global Forecast to 2022


[135 Pages Report] The integration of data from various sources needs a common platform where the data can be accommodated until it is delivered to the client�s premises. Data integration requires much effort, as most of the data sources have different servers that do not support one another. Additionally, the location of all the stored data sources is different, which makes the data integration process even more complicated. Data virtualization solutions offer a common platform where the data consumers can access large volumes of data in the proper format, irrespective of the server and source location. These solutions also help in cost optimization, enhancement of the working capital, process efficiency, and reduction in the time required to develop new products.
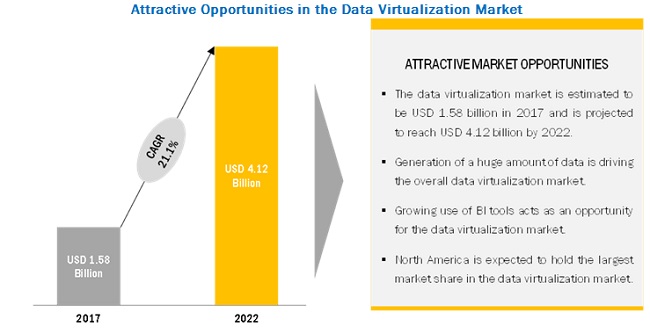
The data virtualization market size is expected to grow to USD 1.58 billion in 2017 and is projected to reach USD 4.12 Billion by 2022, at a Compound Annual Growth Rate (CAGR) of 21.1% during the forecast period. The base year considered for this study is 2016, and the forecast period considered is between 2017 and 2022. The market is estimated to grow at a significant rate over the next five years, due to the need to access large volumes of data stored at heterogeneous sources across an enterprise. Generation of large amounts of data and increasing demand for data integration software tools are some of the major driving factors for the market.
By Component, the data integration solution segment is expected to hold the largest share of the market.
By Deployment Mode, the on-premises segment is projected to hold the largest share of the market.
By Enterprise Size, the large enterprises sector is estimated to hold the largest share of the market.
By Data Consumer, BI tools will continue to dominate the Data Virtualization market
APAC is projected to have the highest growth rate during the forecast period.
According to Market analysis, the data virtualization market in APAC is expected to be the best market to invest in during the forecast period. The generation of huge amounts of data through increasing digitalized infrastructure is one of the primary reasons due to which the APAC region has seen an increasing trend in the data virtualization market.
Market Dynamics
Driver: Generation of huge amounts of data
There is an increase in the amount of data generated in organizations in the past few years due to various reasons, such as digitalization, IoT, and advancement in traditional technologies. Moreover, connected devices, linked to the internet, are one of the significant factors in the generation of vast amounts of data. The data generated through these sources are stored in different formats at various physical locations, due to which quick access to data has become a complicated process. Furthermore, there is an advancement in multiple applications, such as cloud, Software as a Service (SaaS), and IoT, which is contributing to the enormous amount of data generated. As a result, the need to manage and integrate the data from various sources has become pivotal to get real-time availability of data. Moreover, data virtualization solutions offer benefits, such as improved data management, accelerated time-to-market, and enhanced data quality. These are some of the critical factors driving the overall growth of the data virtualization market.
Restraint: Lack of standardization in enterprise data management
Enterprise-level planning and management play a significant role in forming business strategies. The major part of this planning includes the use of data in line with business strategies. To develop these strategies, organizations need to access various data types, such as customer details, transaction data, and healthcare data. This process requires the transmission of large chunks of data from multiple sources; therefore, organizations need to consider different data protection and privacy laws, imposed by the country, to access the data. Different countries apply different norms. For instance, in the European region, the European Union General Data Protection Regulation (EU GDPR) is designed to restrict the companies from accessing the customer data. Moreover, in the US, the Health Insurance Portability and Accountability Act (HIPAA), one of the data privacy and protection laws, provides strict guidelines to secure a patient�s medical data while saving, exchanging or accessing the data electronically. In the APAC region, the Singapore parliament has imposed the Personal Data Protection Act 2012, according to which various industries, such as telecom, healthcare, and banking, will have to meet the data regulations to fulfill an organization�s data requirements. Organizations need to adhere to these rules and regulations strictly. The data virtualization technology is dependent on data, and due to these regulations, there would be limitations on data access, which can act as a restraint for the data virtualization market.
Opportunity: Increasing demand for cloud-based solutions
In the data virtualization space, most of the companies are focused on providing cloud-based solutions to reduce the infrastructure cost required to manage the enormous amount of data. Cloud-based data virtualization solutions are gaining traction due to the benefits they offer, such as scalability, agility, reduced operational cost, and flexibility. Companies such as Denodo and Informatica, have started offering solutions to meet the changing business requirements, such as real-time data availability, and help companies with complex data integration issues. For instance, Informatica offers cloud-based solutions for integrating data on cloud data warehouses, such as SQL Data Warehouse, Azure, or Snowflake. These solutions enable the seamless integration of data from various heterogeneous sources by offering an accessible interface facility. These factors are considered to be increasing the adoption of cloud-based solutions and, thus, act as an opportunity for the growth of the data virtualization market.
Challenge: Lack of expertise in using relational databases
The main focus of organizations is on big data management as well as the extraction of useful information stored in heterogeneous data sources to achieve insights from the data. These insights are useful to remain competitive in the market; hence, various companies are inclined toward the adoption of data virtualization tools and technologies in their organizational systems. However, lack of expertise in using relational databases can restrict organizations from adopting the data virtualization technology. As the data needs to be integrated from various processes and applications, the need for a skilled workforce becomes a necessity. Companies such as Red Hat and Denodo are offering training and certification programs to help data professionals and developers create data solutions. Organizations need to invest in these areas to achieve benefits out of the solutions deployed. This can be seen as a challenge that can be solved by implementing training and certification programs within organizations.
Scope of the Report
|
Report Metric |
Details |
|
Market size available for years |
2015 � 2022 |
|
Base year considered |
2016 |
|
Forecast period |
2017 - 2022 |
|
Forecast units |
Billion (USD) |
|
Segments covered |
Component, Deployment Mode, Data Consumer, Enterprise Size, End-User, and Region |
|
Geographies covered |
North America, Europe, Latin America, APAC, and MEA |
|
Companies covered |
Key market players, including, |
The research report categorizes the Data Virtualization Market to forecast the revenues and analyze the trends in each of the following sub-segments:
By Component:
- Standalone Software
- Data Integration Solution
- Application Tool Solution
By Deployment Mode:
- Cloud
- On-premises
By Data Consumer:
- BI Tools
- Enterprise Applications
- Mobile and Web Applications
By Enterprise Size:
- Large Enterprises
- SMEs
By End User:
- Manufacturing
- Healthcare
- BFSI
- Research and academia
- Media and entertainment
- Retail and ecommerce
- Government and defense
- Telecom and IT
- Others (transportation, and oil and gas)
By Region
- North America
- Canada
- US
- Mexico
- Europe
- UK
- Germany
- France
- Asia Pacific (APAC)
- Japan
- New Zealand
- India
- China
- Australia
- The Middle East and Africa (MEA)
- Latin America
Key Market Players
IBM (US), SAP SE (Germany), Denodo Technologies (US), Oracle Corporation (US), TIBCO Software (US).
Recent Developments
- In October 2017, Oracle launched a new cloud-enabled platform, �Oracle Data Integration Platform Cloud (DIPC),� which aims to offer data transformation, copy, integration, and governance of data. The platform would help customers extract maximum value out of large volumes of data. The platform is the combination of Oracle Data Integration products, such as Oracle Enterprise Data Quality, Oracle Data Integrator, and Oracle GoldenGate.
- In October 2017, SAP made advancements to its SAP Vora solution to help enterprises easily deploy a solution in the public cloud. Moreover, these advancements would provide organizations with a more straightforward deployment process and would also offer flexibility while migrating between various deployment models.
- In September 2017, Datometry launched a new solution, Datometry qShift, an automated schema synthesizer for the data warehouse. The solution offers a fast and complete analysis of data warehouse re-platforming workloads, which would help enterprises in the execution of cloud-native strategies.
- In August 2017, IBM launched a new software, IBM Spectrum Protect Plus, which is designed to fulfill the requirement of data protection as well as the availability of data for large enterprise clients. The software offers benefits, such as data management and recovery, and rapid backup.
- In March 2016, Oracle launched a new product, Virtual Storage Manager (VSM) 7 System, developed to offer data security for heterogeneous as well as mainframe systems. The benefits offered by the solution are Improved security for data Disaster recovery and solution availability sin the cloud.
Critical questions the report answers:
- Which segment or region will lead the market, and why?
- Where will all these developments take the industry in the long run?
- What are the major drivers and challenges in the market?
- What are the key strategies adopted by major market players?
To speak to our analyst for a discussion on the above findings, click Speak to Analyst
 Exclusive indicates content/data unique to MarketsandMarkets and not available with any competitors.
Table of Contents
1 Introduction (Page No. - 14)
1.1 Objectives of the Study
1.2 Market Definition
1.3 Market Scope
1.4 Years Considered for the Study
1.5 Currency
1.6 Stakeholders
2 Research Methodology (Page No. - 17)
2.1 Research Data
2.1.1 Secondary Data
2.1.2 Primary Data
2.1.2.1 Breakdown of Primaries
2.1.2.2 Key Industry Insights
2.2 Market Size Estimation
2.3 Research Assumptions and Limitation
2.3.1 Assumption
2.3.2 Limitation
3 Executive Summary (Page No. - 23)
4 Premium Insights (Page No. - 27)
4.1 Attractive Market Opportunities in the Data Virtualization Market
4.2 Market By End-User, 2017�2022
4.3 Market By Top Three Region and End User
5 Market Overview and Industry Trends (Page No. - 31)
5.1 Introduction
5.2 Data Virtualization Architecture
5.3 Data Virtualization Market: Use Cases
5.3.1 Use Case: Banking Sector
5.3.2 Use Case: Healthcare
5.3.3 Use Case: Retail
5.3.4 Use Case: Research and Academia
5.4 Market Dynamics
5.4.1 Drivers
5.4.1.1 Generation of Huge Amounts of Data
5.4.1.2 Increasing Demand for Data Integration Software Tools
5.4.2 Restraints
5.4.2.1 Lack of Standardization in Enterprise Data Management
5.4.3 Opportunities
5.4.3.1 Increasing Demand for Cloud-Based Solutions
5.4.3.2 Growing Usage of BI Tools
5.4.4 Challenges
5.4.4.1 Lack of Expertise in Using Relational Databases
5.4.4.2 Traditional Architecture and Infrastructure
6 Data Virtualization Market, By Component (Page No. - 38)
6.1 Introduction
6.2 Standalone Software
6.3 Data Integration Solution
6.4 Application Tool Solution
7 Market, By Deployment Mode (Page No. - 44)
7.1 Introduction
7.2 Cloud
7.3 On-Premises
8 Data Virtualization Market, By Data Consumer (Page No. - 47)
8.1 Introduction
8.2 Business Intelligence Tools
8.3 Enterprise Applications
8.4 Mobile and Web Applications
9 Market, By Enterprise Size (Page No. - 52)
9.1 Introduction
9.2 Large Enterprises
9.3 Small and Medium-Sized Enterprises
10 Data Virtualization Market, By End-User (Page No. - 55)
10.1 Introduction
10.2 Manufacturing
10.3 Healthcare
10.4 Banking, Financial Services, and Insurance
10.5 Research and Academia
10.6 Media and Entertainment
10.7 Retail and Ecommerce
10.8 Government and Defense
10.9 Telecom and IT
10.10 Others
11 Data Virtualization Market, By Region (Page No. - 67)
11.1 Introduction
11.2 North America
11.3 Europe
11.4 Asia Pacific
11.5 Middle East and Africa
11.6 Latin America
12 Competitive Landscape (Page No. - 84)
12.1 Overview
12.2 Top Players Operating in the Data Virtualization Market
12.3 Competitive Scenario
12.3.1 New Product Launches and Product Enhancements
12.3.2 Partnerships and Collaborations
12.3.3 Mergers and Acquisitions
12.3.4 Business Expansions
13 Company Profiles (Page No. - 90)
13.1 Introduction
(Business Overview, Products Offered, Recent Developments, MnM View, SWOT Analysis)*
13.2 IBM
13.3 SAP
13.4 Informatica
13.5 Denodo
13.6 Oracle
13.7 Tibco Software
13.8 Microsoft
13.9 Red Hat
13.10 SAS
13.11 Information Builders
13.12 Openlink Software
13.13 Datometry
13.14 Gluent
*Business Overview, Products Offered, Recent Developments, MnM View, SWOT Analysis Might Not Be Captured in Case of Unlisted Companies.
14 Appendix (Page No. - 125)
14.1 Industry Experts
14.2 Discussion Guide
14.3 Knowledge Store: Marketsandmarkets� Subscription Portal
14.4 Introducing RT: Real-Time Market Intelligence
14.5 Available Customizations
14.6 Related Reports
14.7 Author Details
List of Tables (67 Tables)
Table 1 United States Dollar Exchange Rate, 2014�2016
Table 2 Data Virtualization Market Size, By Component, 2015�2022 (USD Million)
Table 3 Standalone Software: Market Size By Deployment Mode, 2015�2022 (USD Million)
Table 4 Standalone Software: Market Size By Region, 2015�2022 (USD Million)
Table 5 Data Integration Solution: Market Size By Deployment Mode, 2015�2022 (USD Million)
Table 6 Data Integration Solution: Market Size By Region, 2015�2022 (USD Million)
Table 7 Application Tool Solution: Market Size By Deployment Mode, 2015�2022 (USD Million)
Table 8 Application Tool Solution: Market Size By Region, 2015�2022 (USD Million)
Table 9 Market Size By Deployment Mode, 2015�2022 (USD Million)
Table 10 Market Size By Data Consumer, 2015�2022 (USD Million)
Table 11 Business Intelligence Tools: Market Size By Deployment Mode, 2015�2022 (USD Million)
Table 12 Business Intelligence Tools: Market Size By Region, 2015�2022 (USD Million)
Table 13 Enterprise Applications: Market Size By Deployment Mode, 2015�2022 (USD Million)
Table 14 Enterprise Applications: Market Size By Region, 2015�2022 (USD Million)
Table 15 Mobile and Web Applications: Market Size By Deployment Mode, 2015�2022 (USD Million)
Table 16 Mobile and Web Applications: Market Size By Region, 2015�2022 (USD Million)
Table 17 Data Virtualization Market Size, By Enterprise Size, 2015�2022 (USD Million)
Table 18 Market Size By End-User, 2015�2022 (USD Million)
Table 19 Manufacturing: Market Size By Deployment Mode, 2015�2022 (USD Million)
Table 20 Manufacturing: Market Size By Component, 2015�2022 (USD Million)
Table 21 Healthcare: Market Size By Deployment Mode, 2015�2022 (USD Million)
Table 22 Healthcare: Market Size By Component, 2015�2022 (USD Million)
Table 23 Banking, Financial Services, and Insurance: Data Virtualization Market Size, By Deployment Mode, 2015�2022 (USD Million)
Table 24 Banking, Financial Services, and Insurance: Market Size By Component , 2015�2022 (USD Million)
Table 25 Research and Academia: Market Size By Deployment Mode, 2015�2022 (USD Million)
Table 26 Research and Academia: Market Size By Component, 2015�2022 (USD Million)
Table 27 Media and Entertainment: Market Size By Deployment Mode, 2015�2022 (USD Million)
Table 28 Media and Entertainment: Market Size By Component, 2015�2022 (USD Million)
Table 29 Retail and Ecommerce: Market Size By Deployment Mode, 2015�2022 (USD Million)
Table 30 Retail and Ecommerce: Market Size By Component, 2015�2022 (USD Million)
Table 31 Government and Defense: Market Size By Deployment Mode, 2015�2022 (USD Million)
Table 32 Government and Defense: Market Size By Component, 2015�2022 (USD Million)
Table 33 Telecom and IT: Market Size By Deployment Mode, 2015�2022 (USD Million)
Table 34 Telecom and IT: Market Size By Component, 2015�2022 (USD Million)
Table 35 Others: Market Size By Deployment Mode, 2015�2022 (USD Million)
Table 36 Others: Market Size By Component, 2015�2022 (USD Million)
Table 37 Data Virtualization Market Size, By Region, 2015�2022 (USD Million)
Table 38 North America: Market Size By Component, 2015�2022 (USD Million)
Table 39 North America: Market Size By Deployment Mode, 2015�2022 (USD Million)
Table 40 North America: Market Size By Data Consumer, 2015�2022 (USD Million)
Table 41 North America: Market Size By Enterprise Size, 2015�2022 (USD Million)
Table 42 North America: Market Size By End-User, 2015�2022 (USD Million)
Table 43 Europe: Market Size, By Component, 2015�2022 (USD Million)
Table 44 Europe: Market Size By Deployment Mode, 2015�2022 (USD Million)
Table 45 Europe: Market Size By Data Consumer, 2015�2022 (USD Million)
Table 46 Europe: Market Size By Enterprise Size, 2015�2022 (USD Million)
Table 47 Europe: Market Size By End-User, 2015�2022 (USD Million)
Table 48 Asia Pacific: Data Virtualization Market Size, By Component, 2015�2022 (USD Million)
Table 49 Asia Pacific: Market Size By Deployment Mode, 2015�2022 (USD Million)
Table 50 Asia Pacific: Market Size By Data Consumer, 2015�2022 (USD Million)
Table 51 Asia Pacific: Market Size By Enterprise Size, 2015�2022 (USD Million)
Table 52 Asia Pacific: Market Size By End-User, 2015�2022 (USD Million)
Table 53 Middle East and Africa: Market Size, By Component, 2015�2022 (USD Million)
Table 54 Middle East and Africa: Market Size By Deployment Mode, 2015�2022 (USD Million)
Table 55 Middle East and Africa: Market Size By Data Consumer, 2015�2022 (USD Million)
Table 56 Middle East and Africa: Market Size By Enterprise Size, 2015�2022 (USD Million)
Table 57 Middle East and Africa: Market Size By End-User, 2015�2022 (USD Million)
Table 58 Latin America: Data Virtualization Market Size, By Component, 2015�2022 (USD Million)
Table 59 Latin America: Market Size By Deployment Mode, 2015�2022 (USD Million)
Table 60 Latin America: Market Size By Data Consumer, 2015�2022 (USD Million)
Table 61 Latin America: Market Size By Enterprise Size, 2015�2022 (USD Million)
Table 62 Latin America: Market Size By End-User, 2015�2022 (USD Million)
Table 63 Data Virtualization Market: Market Ranking
Table 64 New Product Launches and Product Enhancements, 2015�2017
Table 65 Partnerships and Collaborations, 2015�2017
Table 66 Mergers and Acquisitions, 2015�2017
Table 67 Business Expansions, 2016�2017
List of Figures (38 Figures)
Figure 1 Global Data Virtualization Market Segmentation
Figure 2 Global Market: Research Design
Figure 3 Data Triangulation
Figure 4 Market Size Estimation Methodology: Bottom-Up Approach
Figure 5 Market Size Estimation Methodology: Top-Down Approach
Figure 6 Market Snapshot By Component (2017 vs 2022)
Figure 7 Market Snapshot By Deployment Mode
Figure 8 Market Snapshot By Enterprise Size
Figure 9 Market Snapshot By Data Consumer (2017 vs 2022)
Figure 10 Market Snapshot By End-User (2017 vs 2022)
Figure 11 Market Snapshot By Region
Figure 12 Generation of A Huge Amount of Data is Driving the Overall Growth of the Data Virtualization Market During the Forecast Period
Figure 13 Research and Academia End-User is Expected to Have the Highest CAGR During the Forecast Period
Figure 14 BFSI and North America has the Largest Market Share in 2017
Figure 15 Market Investment Scenario: Asia Pacific is Expected to Be the Best Market for Investment in the Next 5 Years
Figure 16 Data Virtualization Architecture
Figure 17 Data Virtualization Market: Drivers, Restraints, Opportunities, and Challenges
Figure 18 Data Integration Solution Segment is Expected to Have the Largest Market Size During the Forecast Period
Figure 19 Cloud Deployment Mode is Expected to Exhibit A Higher CAGR During the Forecast Period
Figure 20 Business Intelligence Tools Segment is Expected to Exhibit the Highest CAGR During the Forecast Period
Figure 21 Large Enterprises Segment is Expected to Exhibit A Higher CAGR During the Forecast Period
Figure 22 Research and Academia End-User is Expected to Exhibit the Highest CAGR During the Forecast Period
Figure 23 Asia Pacific is Expected to Have the Highest CAGR in the Data Virtualization Market
Figure 24 Asia Pacific is Expected to Have the Fastest Growth Rate in the Market During the Forecast Period
Figure 25 North America: Market Snapshot
Figure 26 Asia Pacific: Market Snapshot
Figure 27 Key Developments By Leading Players in the Data Virtualization Market From 2015 to 2017
Figure 28 IBM: Company Snapshot
Figure 29 IBM: SWOT Analysis
Figure 30 SAP: Company Snapshot
Figure 31 SAP: SWOT Analysis
Figure 32 Informatica: SWOT Analysis
Figure 33 Denodo: SWOT Analysis
Figure 34 Oracle: Company Snapshot
Figure 35 Oracle: SWOT Analysis
Figure 36 Microsoft: Company Snapshot
Figure 37 Red Hat: Company Snapshot
Figure 38 SAS: Company Snapshot


Growth opportunities and latent adjacency in Data Virtualization Market