UHT Processing Market

UHT Processing Market by Mode of Operation (Direct, Indirect), End-Product Form (Liquid and Semi Liquid), Application (Milk, Dairy Desserts, Juices, Soups, Dairy Alternatives), and Region (North America, Europe, APAC, RoW) - Global Forecast to 2027

Report Code: FB 5999 Dec, 2022, by marketsandmarkets.com

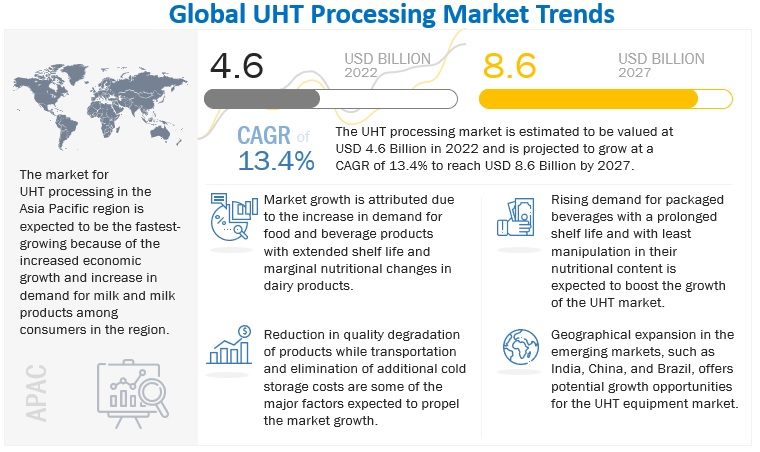
The market for UHT Processing is estimated at USD 4.6 billion in 2022; it is projected to grow at a CAGR of 13.4% to reach USD 8.6 billion by 2027. Ultra-Heat Treatment is a modern technique of extending shelf life of products. The UHT process requires a minimum temperature of rapid heating to 135oC and followed by rapid cooling. UHT processing will extend the shelf life of the product, and many industries adopt for UHT processing and aseptic packaging as the product can be stored for up to 90 days and more, without any chilled condition.
UHT Processing Market

To know about the assumptions considered for the study, Request for Free Sample Report

UHT Processing Market Dynamics

Driver: Increasing demand for food & beverage products with an extended shelf life

Food waste is a worldwide problem. According to United Nations, 2021, Between harvest and retail, around 14% of the food produced globally is lost, and an estimated 17% of the total amount of food produced is wasted (11 percent in households, 5 percent in the food service and 2 percent in retail). A significant part of food loss or waste is due to improper storage. Each food item has a different shelf life, which is greatly influenced by the way that food is stored. The shelf life of food is greatly influenced by the storage temperature, oxygen and moisture exposure, and storage container. Dairy products make up a major category of food waste and food loss. In dairy products, milk accounts for a large percentage of food waste According to a 2018 study conducted at Edinburgh University for The Guardian, one in six pints of milk produced globally is lost or wasted, a total of about 128 million tons of milk each year. Each year, 116 tons of dairy products are lost or discarded globally, with production, distribution, and spoilage accounting for over half of this waste before the product even reaches the store. Dairy makes for one-fifth of all food waste in the UK, with households accounting for 90% of waste. The shelf life of raw milk is only 2 to 3 days because it contains bacteria. Various methods for extending the shelf life of milk have been discovered over the last few decades. According to article published in Quartz, 2018 following are various types of processes to extend the milk life: Pasteurized processing, filtered processing Ultra-high temperature processing. Frozen processing Evaporated/Condensed processing, Dried processing. Of these, ultra-high temperature (UHT) milk has the highest shelf life. UHT milk has a 12-month shelf life when kept at ambient temperature. According to Euromonitor International, around 34 percent of liquid milk consumption today is shelf-stable or UHT milk

Due to higher temperatures, higher humidity, and a lack of resources, processing milk and other liquid and non-liquid products is more difficult in tropical countries such as India, Australia, Africa, and South America than it is in temperate climates with a well-established cold chain infrastructure. As a result, cheese ripens too quickly and milk and other liquid products experience spoilage at a higher rate since it is frequently impossible to maintain sufficient cooling temperatures. The concept of extended shelf life milk, also known as ESL milk, was developed in response to consumer demand for products with longer shelf life – and wider distribution of chilled milk products. This concept has begun to play a significant role in the dynamics of the dairy industry along with the quick development of new processing and packaging concepts.

Liquid and semi-liquid food and beverage products, which are desired for their extended shelf life, can be successfully treated with UHT to remove microbial contamination. This characteristic of UHT-treated products continues to be advantageous for developing nations that are close to the equator or have a tropical climate by aiding them in reducing logistical and refrigeration costs.

Products that have undergone UHT treatment are aseptically packaged, so there is no need to boil them before consumption. These factors have led the UHT processing industry to expand rapidly in both developed and developing nations. In households without access to refrigeration or with insufficient space for chilling, UHT-treated products are frequently used. UHT processed products have been successful in rural, drought-stricken areas with little or no food mobility

Restraint: High capital investment

For the procurement and installation of UHT processing equipment, food and beverage processing enterprises must make a significant capital expenditure. The operational margins and profits of food and beverage processors and manufacturers are impacted by the high installation costs and frequent maintenance associated with certain processing equipment types. Manufacturers avoid installing UHT processing equipment in favour of more cost - effective option. In compared to UHT plants, processing equipment like pasteurizer units require lower capital investment and require less annual maintenance.

Since specialised equipment is needed for both treating the desired products and manufacturing different packages out of diverse raw materials, the initial capital investment needed for UHT processing equipment is high. For the UHT treatment of various products, several types of flash cooling machines, cleaning machines, heaters, homogenizers, and pressurizers are required. This necessitates significant investments, which discourage manufacturers from starting their own UHT processing plants and limit the market for UHT processing.

Opportunity: Emerging markets in Asia Pacific, African, and South American countries

Global population growth is increasing the pressure on developers to manufacture, extract, and maintain limited resources. Low-income customers are being impacted by increased food prices as a result of high energy and raw material costs. Water scarcity is adding the pressure on food supplies, especially in Northern Asia and Africa. Therefore, improvements in science and technology considerably contribute to the expansion of food and beverage shelf life. The market size for the product is also expanding, notably in nations like Zambia, Botswana, and Namibia, where the demand for selling UHT processing equipment to the smallest food and beverage manufacturers is also increasing

Urbanization and globalisation have grown throughout time, increasing literacy and exposure to industrialised nations through foreign media, overseas employment opportunities, and travel. This has brought about a change in the mindset and preferences of urban people in developing countries. The prevalence of nuclear double-income families, particularly in urban areas, is a trend that is influencing these shifting lifestyles. The demand for ready-to-cook and ready-to-eat food has expanded as a result of busy lifestyles and shifting consumption habits. This has raised brand awareness and, in turn, increased use of UHT processing equipment.

Challenge: High product quality requirement for UHT treatment

has alcohol stability of less than 75%, and was stored for longer than a week at low temperatures.

Superior quality products are needed for UHT treatment. For instance, high quality milk is required to withstand high heat treatment when milk is exposed to UHT. For example, it is imperative that raw milk proteins do not result in thermal instability. When treated with high heat, low-quality raw milk degrades both the ability to be processed and the quality of the finished product. Milk with a pH below 6.65 at 20°C has less thermal stability, which affects processing, makes cleaning more difficult, and promotes protein sedimentation in storage containers. Consequently, the required milk quality continues to be a key factor.

If milk was stored at low temperatures for more than a week and has a pH level of less than 6.65, alcohol stability of less than 75%, it is not considered suitable for UHT treatment.

The indirect segment dominated the market and is projected to have higher growth rate during the forecast period of UHT Processing market.

indirect heating UHT systems are reduced energy consumption, long runtimes, and straightforward cleaning. Indirect type heat exchangers use regenerative type of process, which saves more energy. For these factors companies prefer indirect type heat exchangers.

The liquid segment dominated the UHT processing market, with highest market share during the forecast period of UHT Processing market.

As liquid products have low viscosity, they can pass easily through the heat exchangers. The process control such as flow rates can be handled easily for a liquid product to maintain the product temperature. Products such as milk, cream, ice cream mixes, beverages, beer, beer wort, beverages with pulp, and purees are commonly processed using UHT treatment. Thus, their market share is higher during the forecast period of UHT Processing market.

Milk and dairy desserts were the major applications in the UHT processing market, combined having majority of the market share in the by application segment.

Milk and milk products is the most commonly processed product for UHT treatment, as milk is highly perishable and has high demand. Temporary surpluses due to seasonal variations can be covered by subjecting milk to UHT treatment and can be stored for off season. Thus UHT processing can help industries to stabilize their demand and supply chain in all seasons.
UHT Processing Market Size, and Share

To know about the assumptions considered for the study, download the pdf brochure

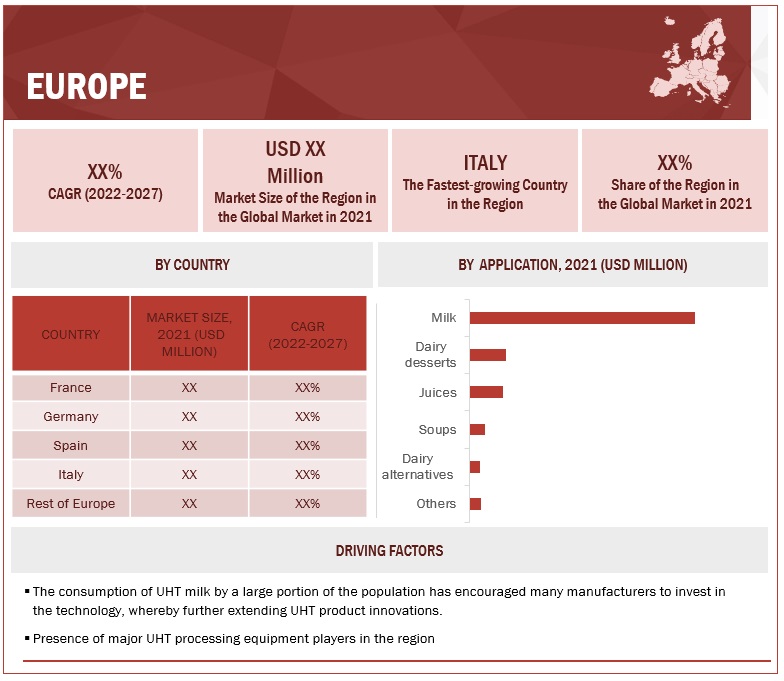
Europe was the most prominent region for the UHT processing market, occupying majority of the market share in the region segment of UHT Processing market.

UHT milk is also one of the most preferred choices of processed milk form in the European countries, due to several advantages associated with it. Europe is also home for large dairy corporations such as Lactalis, Danone, Savencia, and others. These companies prefer Hi-tech technology with higher efficiency. Thus the market for UHT processing equipment manufacturers in these region is accounted high.

Key Market Players

The key players in this market Tetra Laval (Switzerland), GEA Group (Germany), Alfa Laval (Sweden), SPX Flow (Us), Elecster Oyj (Finland), Shanghai Triowin Intelligent Machinery Co., Ltd (China), Microthermics, Inc (US), Reda S.P.A. (Italy), Shanghai Jimei Food Machinery Co. Ltd (China), Proxes Gmbh (Germany), Goma (India), JBT (Us), Neologic Engineers Private Limited (India), Highland Equipment Inc. (Canada), Krones Ag (Germany). These Companies are focusing developing technology and efficiency to provide their customers a hi-tech processing equipment’s. The companies are also focusing on providing after sale maintenance and spare part services. These companies have a strong presence in North America, Asia Pacific and Europe.

Want to explore hidden markets that can drive new revenue in UHT Processing Market?

Scope of the Report

Report Metrics

Details

Market size estimation 2022–2027
Base year considered 2021
Forecast period considered 2022–2027
Units considered Value (USD)
Segments covered By mode of operations, By end product form, By applications, and Region
Regions covered North America, Europe, Asia Pacific, South America and RoW
Companies studied SGS SA (Switzerland), Eurofins Scientific (Luxembourg), Intertek Group plc (UK), Bureau Veritas (France), ALS Limited (Australia),

This research report categorizes the UHT Processing market based on By food tested, By target tested, By technology and Region


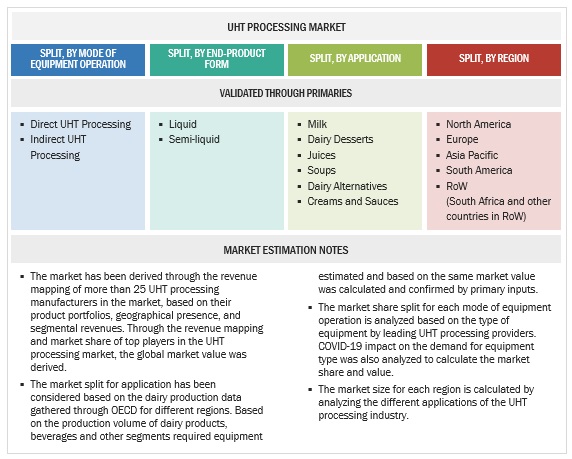
Based on mode of operations, the UHT Processing market has been segmented as follows:
  • Direct UHT processing
  • Indirect UHT processing
Based on end product form, the UHT Processing market has been segmented as follows:
  • Liquid
  • Semi-liquid
Based on applications, the UHT Processing market has been segmented as follows:
Based on the Region, the UHT Processing market has been segmented as follows:
  • North America
  • Europe
  • Asia Pacific
  • South America
  • RoW (Middle East & Africa)


Frequently Asked Questions (FAQ):

To speak to our analyst for a discussion on the above findings, click Speak to Analyst

Exclusive indicates content/data unique to MarketsandMarkets and not available with any competitors.

TABLE OF CONTENTS
 
1 INTRODUCTION (Page No. - 35)
    1.1 STUDY OBJECTIVES 
    1.2 MARKET DEFINITION 
    1.3 STUDY SCOPE 
           1.3.1 MARKET SEGMENTATION
           1.3.2 INCLUSIONS & EXCLUSIONS
           1.3.3 REGIONS COVERED
    1.4 YEARS CONSIDERED 
    1.5 CURRENCY CONSIDERED 
           TABLE 1 USD EXCHANGE RATE, 2018–2021
    1.6 STAKEHOLDERS 
    1.7 SUMMARY OF CHANGES 
 
2 RESEARCH METHODOLOGY (Page No. - 41)
    2.1 RESEARCH DATA 
           FIGURE 1 RESEARCH DESIGN
           2.1.1 SECONDARY RESEARCH
                    2.1.1.1 Key data from secondary sources
           2.1.2 PRIMARY RESEARCH
                    2.1.2.1 Key industry insights
                    2.1.2.2 Breakdown of primaries
                               FIGURE 2 BREAKDOWN OF PRIMARY INTERVIEWS: BY COMPANY TYPE, DESIGNATION, AND REGION
    2.2 MARKET SIZE ESTIMATION 
           2.2.1 BOTTOM-UP APPROACH
                    FIGURE 3 MARKET SIZE ESTIMATION METHODOLOGY: BOTTOM-UP APPROACH
                    FIGURE 4 MARKET SIZE ESTIMATION METHODOLOGY: TOP-DOWN APPROACH
           2.2.2 SUPPLY-SIDE ANALYSIS
                    FIGURE 5 DATA TRIANGULATION: SUPPLY-SIDE ANALYSIS
           2.2.3 DEMAND-SIDE ANALYSIS
                    FIGURE 6 DATA TRIANGULATION: DEMAND-SIDE ANALYSIS
    2.3 MARKET BREAKDOWN AND DATA TRIANGULATION 
           FIGURE 7 DATA TRIANGULATION METHODOLOGY
    2.4 RESEARCH ASSUMPTIONS 
    2.5 LIMITATIONS AND RISK ASSESSMENT 
 
3 EXECUTIVE SUMMARY (Page No. - 52)
    TABLE 2 UHT PROCESSING MARKET SNAPSHOT, 2022 VS. 2027 
                    FIGURE 8 LIQUID SEGMENT TO ACCOUNT FOR LARGER SHARE BY 2027
    FIGURE 9 INDIRECT SEGMENT TO ACCOUNT FOR LARGER SHARE BY 2027 
    FIGURE 10 MILK SEGMENT TO DOMINATE MARKET BY 2027 
    FIGURE 11 EUROPE DOMINATED MARKET IN 2021 
 
4 PREMIUM INSIGHTS (Page No. - 56)
    4.1 ATTRACTIVE OPPORTUNITIES FOR PLAYERS IN UHT PROCESSING MARKET 
           FIGURE 12 INCREASED DEMAND FOR STERILIZED PRODUCTS WITH HIGH SHELF-LIFE
    4.2 ASIA PACIFIC: UHT PROCESSING MARKET, BY KEY APPLICATIONS AND COUNTRIES 
           FIGURE 13 AUSTRALIA AND MILK ACCOUNTED FOR SIGNIFICANT MARKET SHARE IN 2021
    4.3 UHT PROCESSING MARKET, BY REGION 
           FIGURE 14 NEW ZEALAND AND ITALY TO GROW AT SIGNIFICANT CAGRS DURING FORECAST PERIOD
    4.4 UHT PROCESSING MARKET, BY APPLICATION AND REGION, 2022 VS. 2027 
           FIGURE 15 ASIA PACIFIC TO DOMINATE MARKET ACROSS ALL APPLICATIONS
    4.5 UHT PROCESSING MARKET, BY MODE OF EQUIPMENT OPERATION, 2022 VS. 2027 
           FIGURE 16 INDIRECT SEGMENT TO ACCOUNT FOR LARGER SHARE BY 2027
    4.6 UHT PROCESSING MARKET, BY END-PRODUCT FORM, 2022 VS. 2027 
           FIGURE 17 LIQUID SEGMENT TO ACCOUNT FOR LARGER SHARE BY 2027
 
5 MARKET OVERVIEW (Page No. - 60)
    5.1 INTRODUCTION 
    5.2 MACROECONOMIC INDICATORS 
           5.2.1 INCREASE IN GLOBAL MILK PRODUCTION
                    FIGURE 18 MILK PRODUCTION AND YIELD, BY REGION
                    FIGURE 19 TOTAL MILK PRODUCTION IN US, 2017–2022 (BILLION POUNDS)
                    FIGURE 20 ALL-MILK PRICES, 2017–2022 (USD PER HUNDREDWEIGHT)
           5.2.2 GROWING URBANIZATION AND POPULATION
                    FIGURE 21 GLOBAL URBAN AND RURAL POPULATION, 2010–2050
                    FIGURE 22 URBAN POPULATION, BY GROUP OF ECONOMIES, 2010 VS. 2020 (PERCENTAGE OF TOTAL POPULATION)
    5.3 MARKET DYNAMICS 
           FIGURE 23 UHT PROCESSING MARKET: DRIVERS, RESTRAINTS, OPPORTUNITIES, AND CHALLENGES
           5.3.1 DRIVERS
                    5.3.1.1 Rising demand for food and beverages with extended shelf life
                    5.3.1.2 High cost of storage and logistics
                    5.3.1.3 Growth in number of outbreaks related to consumption of raw milk
                               TABLE 3 DISEASES ASSOCIATED WITH DRINKING RAW MILK
                    5.3.1.4 Rising need for advanced milk processing technologies
           5.3.2 RESTRAINTS
                    5.3.2.1 High installation and maintenance costs
           5.3.3 OPPORTUNITIES
                    5.3.3.1 Rising awareness regarding consumption of healthy food and beverages
                    5.3.3.2 Growth of science and technology in emerging markets
                               TABLE 4 DRINKING MILK SALES IN AUSTRALIA, BY TYPE, 2017–2021 (MILLION LITERS)
                               TABLE 5 SUPERMARKET MILK SALES IN AUSTRALIA, BY TYPE, 2020–2021 ('000 LITERS)
           5.3.4 CHALLENGES
                    5.3.4.1 High-quality requirements from UHT treatment
    5.4 IMPACT OF RUSSIA-UKRAINE WAR 
    5.5 USE OF UHT IN PLANT-BASED BEVERAGES 
           FIGURE 24 GLOBAL VOLUME OF PLANT-BASED BEVERAGES PRODUCED, 2017–2022 (MILLION LITERS)
 
6 INDUSTRY TRENDS (Page No. - 75)
    6.1 INTRODUCTION 
    6.2 VALUE CHAIN ANALYSIS 
           FIGURE 25 VALUE CHAIN ANALYSIS
           6.2.1 MATERIAL INPUT
           6.2.2 PRODUCTION/PROCESSING
           6.2.3 PACKAGING/LOADING
           6.2.4 DISTRIBUTION AND MARKETING OF UHT-PROCESSED PRODUCTS
    6.3 TRENDS/DISRUPTIONS IMPACTING CUSTOMER BUSINESSES 
           FIGURE 26 REVENUE SHIFT FOR UHT PROCESSING MARKET
    6.4 PATENT ANALYSIS 
           FIGURE 27 PATENTS ANALYSIS, 2011–2021
           FIGURE 28 PATENTS GRANTED, BY REGION, 2011–2021
           TABLE 6 KEY PATENTS GRANTED, 2021
    6.5 MARKET MAP 
           6.5.1 UPSTREAM
                    6.5.1.1 Equipment manufacturers
                    6.5.1.2 Startups/Emerging companies
           6.5.2 DOWNSTREAM
                    6.5.2.1 Regulatory bodies
                    6.5.2.2 Dairy processors
                               FIGURE 29 UHT PROCESSING MARKET MAP
                               TABLE 7 ECOSYSTEM ANALYSIS
    6.6 PORTER’S FIVE FORCES ANALYSIS 
           TABLE 8 PORTER’S FIVE FORCES ANALYSIS
           6.6.1 DEGREE OF COMPETITION
           6.6.2 BARGAINING POWER OF BUYERS
           6.6.3 BARGAINING POWER OF SUPPLIERS
           6.6.4 THREAT OF SUBSTITUTES
           6.6.5 THREAT OF NEW ENTRANTS
    6.7 TRADE SCENARIO 
           FIGURE 30 DAIRY PRODUCTS: IMPORT VALUE, BY KEY COUNTRIES, 2017–2021 (USD THOUSAND)
           TABLE 9 IMPORT DATA OF DAIRY PRODUCTS, BY KEY COUNTRY, 2021 (VALUE)
           FIGURE 31 DAIRY PRODUCTS: EXPORT VALUE, BY KEY COUNTRIES, 2017–2021 (USD THOUSAND)
           TABLE 10 EXPORT DATA OF DAIRY PRODUCTS, BY KEY COUNTRY, 2021 (VALUE)
    6.8 KEY CONFERENCES AND EVENTS, 2022–2023 
           TABLE 11 KEY CONFERENCES AND EVENTS, 2022–2023
    6.9 TARIFF AND REGULATORY LANDSCAPE 
           6.9.1 REGULATORY BODIES, GOVERNMENT AGENCIES, AND OTHER ORGANIZATIONS
                    TABLE 12 NORTH AMERICA: LIST OF REGULATORY BODIES, GOVERNMENT AGENCIES, AND OTHER ORGANIZATIONS
                    TABLE 13 EUROPE: LIST OF REGULATORY BODIES, GOVERNMENT AGENCIES, AND OTHER ORGANIZATIONS
                    TABLE 14 ASIA PACIFIC: LIST OF REGULATORY BODIES, GOVERNMENT AGENCIES, AND OTHER ORGANIZATIONS
                    TABLE 15 REST OF THE WORLD: LIST OF REGULATORY BODIES, GOVERNMENT AGENCIES, AND OTHER ORGANIZATIONS
           6.9.2 REGULATORY FRAMEWORK
                    6.9.2.1 North America
                               6.9.2.1.1 USFDA - US Food and Drug Administration Inspection Guide
                                             6.9.2.1.1.1 CFR - Code of Federal Regulations Title 21
                               6.9.2.1.2 Department of Justice, Canada
                    6.9.2.2 European Union (EU)
    6.10 CASE STUDY ANALYSIS 
    6.11 KEY STAKEHOLDERS AND BUYING CRITERIA 
           6.11.1 KEY STAKEHOLDERS IN BUYING PROCESS
                    FIGURE 32 INFLUENCE OF STAKEHOLDERS ON BUYING PROCESS FOR MODES OF EQUIPMENT OPERATION
                    TABLE 16 INFLUENCE OF STAKEHOLDERS ON BUYING PROCESS FOR MODES OF EQUIPMENT OPERATION (%)
           6.11.2 BUYING CRITERIA
                    TABLE 17 KEY CRITERIA FOR SELECTING SUPPLIER/VENDOR
                    FIGURE 33 KEY CRITERIA FOR SELECTING SUPPLIER/VENDOR
 
7 UHT PROCESSING MARKET, BY TECHNOLOGY (Page No. - 95)
    7.1 INTRODUCTION 
    7.2 HEATING 
    7.3 HOMOGENIZATION 
    7.4 FLASH COOLING 
    7.5 ASEPTIC PACKAGING 
    7.6 OTHER TECHNOLOGIES 
 
8 UHT PROCESSING MARKET, BY MODE OF EQUIPMENT OPERATION (Page No. - 98)
    8.1 INTRODUCTION 
           FIGURE 34 UHT PROCESSING MARKET, BY MODE OF EQUIPMENT OPERATION, 2022 VS. 2027 (USD MILLION)
           TABLE 18 UHT PROCESSING MARKET, BY MODE OF EQUIPMENT OPERATION, 2017–2021 (USD MILLION)
           TABLE 19 UHT PROCESSING MARKET, BY MODE OF EQUIPMENT OPERATION, 2022–2027 (USD MILLION)
    8.2 DIRECT 
           8.2.1 SUITABLE FOR IMMISCIBLE FLUIDS
                    8.2.1.1 Steam injection
                    8.2.1.2 Steam infusion
                               TABLE 20 DIRECT: UHT PROCESSING MARKET, BY REGION, 2017–2021 (USD MILLION)
                               TABLE 21 DIRECT: UHT PROCESSING MARKET, BY REGION, 2022–2027 (USD MILLION)
    8.3 INDIRECT 
           8.3.1 GROWING NEED FOR REDUCED ENERGY CONSUMPTION AND EASY PROCESS CONTROL
                    8.3.1.1 Tubular heat exchangers
                    8.3.1.2 Plate heat exchangers
                    8.3.1.3 Scraped surface heat exchangers
                               TABLE 22 INDIRECT: UHT PROCESSING MARKET, BY REGION, 2017–2021 (USD MILLION)
                               TABLE 23 INDIRECT: UHT PROCESSING MARKET, BY REGION, 2022–2027 (USD MILLION)
 
9 UHT PROCESSING MARKET, BY APPLICATION (Page No. - 105)
    9.1 INTRODUCTION 
           FIGURE 35 MILK SEGMENT TO EXHIBIT HIGHEST GROWTH AMONG ALL APPLICATIONS BY 2027
           TABLE 24 UHT PROCESSING MARKET, BY APPLICATION, 2017–2021 (USD MILLION)
           TABLE 25 UHT PROCESSING MARKET, BY APPLICATION, 2022–2027 (USD MILLION)
    9.2 MILK 
           TABLE 26 MILK: UHT PROCESSING MARKET, BY REGION, 2017–2021 (USD MILLION)
           TABLE 27 MILK: UHT PROCESSING MARKET, BY REGION, 2022–2027 (USD MILLION)
           TABLE 28 MILK: UHT PROCESSING MARKET, BY SUBAPPLICATION, 2017–2021 (USD MILLION)
           TABLE 29 MILK: UHT PROCESSING MARKET, BY SUBAPPLICATION, 2022–2027 (USD MILLION)
           9.2.1 REGULAR MILK
                    9.2.1.1 Need to preserve nutrients in regular milk
           TABLE 30 REGULAR MILK: UHT PROCESSING MARKET, BY REGION, 2017–2021 (USD MILLION)
           TABLE 31 REGULAR MILK: UHT PROCESSING MARKET, BY REGION, 2022–2027 (USD MILLION)
           9.2.2 FLAVORED MILK
                    9.2.2.1 Increased consumption of flavored milk among youth
           TABLE 32 FLAVORED MILK: UHT PROCESSING MARKET, BY REGION, 2017–2021 (USD MILLION)
           TABLE 33 FLAVORED MILK: UHT PROCESSING MARKET, BY REGION, 2022–2027 (USD MILLION)
           9.2.3 CONDENSED MILK
                    9.2.3.1 Growing demand for increased storage of condensed milk
                               TABLE 34 CONDENSED MILK: UHT PROCESSING MARKET, BY REGION, 2017–2021 (USD MILLION)
                               TABLE 35 CONDENSED MILK: UHT PROCESSING MARKET, BY REGION, 2022–2027 (USD MILLION)
           9.2.4 EVAPORATED MILK
                    9.2.4.1 Rising demand for fresh evaporated milk with long shelf-life
                               TABLE 36 EVAPORATED MILK: UHT PROCESSING MARKET, BY REGION, 2017–2021 (USD MILLION)
                               TABLE 37 EVAPORATED MILK: UHT PROCESSING MARKET, BY REGION, 2022–2027 (USD MILLION)
           9.2.5 OTHER MILK APPLICATIONS
                    TABLE 38 OTHER MILK SUBAPPLICATIONS: UHT PROCESSING MARKET, BY REGION, 2017–2021 (USD MILLION)
                    TABLE 39 OTHER MILK SUBAPPLICATIONS: UHT PROCESSING MARKET, BY REGION, 2022–2027 (USD MILLION)
    9.3 DAIRY DESSERTS 
           TABLE 40 DAIRY DESSERTS: UHT PROCESSING MARKET, BY REGION, 2017–2021 (USD MILLION)
           TABLE 41 DAIRY DESSERTS: UHT PROCESSING MARKET, BY REGION, 2022–2027 (USD MILLION)
           TABLE 42 DAIRY DESSERTS: UHT PROCESSING MARKET, BY SUBAPPLICATION, 2017–2021 (USD MILLION)
           TABLE 43 DAIRY DESSERTS: UHT PROCESSING MARKET, BY SUBAPPLICATION, 2022–2027 (USD MILLION)
           9.3.1 YOGURT
                    9.3.1.1 Rising popularity of yogurt as healthy dessert
                               TABLE 44 YOGURT: UHT PROCESSING MARKET, BY REGION, 2017–2021 (USD MILLION)
                               TABLE 45 YOGURT: UHT PROCESSING MARKET, BY REGION, 2022–2027 (USD MILLION)
           9.3.2 CREAM
                    9.3.2.1 Rising demand for creams with increased shelf-life
                               TABLE 46 CREAM: UHT PROCESSING MARKET, BY REGION, 2017–2021 (USD MILLION)
                               TABLE 47 CREAM: UHT PROCESSING MARKET, BY REGION, 2022–2027 (USD MILLION)
           9.3.3 AMBIENT DRINKING YOGURT
                    9.3.3.1 Increased acceptance among youth
                               TABLE 48 AMBIENT DRINKING YOGURT: UHT PROCESSING MARKET, BY REGION, 2017–2021 (USD MILLION)
                               TABLE 49 AMBIENT DRINKING YOGURT: UHT PROCESSING MARKET, BY REGION, 2022–2027 (USD MILLION)
           9.3.4 CUSTARD
                    9.3.4.1 Growing popularity of custards in bakery industry
                               TABLE 50 CUSTARD: UHT PROCESSING MARKET, BY REGION, 2017–2021 (USD MILLION)
                               TABLE 51 CUSTARD: UHT PROCESSING MARKET, BY REGION, 2022–2027 (USD MILLION)
           9.3.5 PUDDING
                    9.3.5.1 Heat-treated, ready-to-eat puddings more popular compared to regular pudding
                               TABLE 52 PUDDING: UHT PROCESSING MARKET, BY REGION, 2017–2021 (USD MILLION)
                               TABLE 53 PUDDING: UHT PROCESSING MARKET, BY REGION, 2022–2027 (USD MILLION)
    9.4 JUICES 
           9.4.1 HEAT TREATMENT MAKES JUICES FREE FROM BACTERIA
                    TABLE 54 JUICES: UHT PROCESSING MARKET, BY REGION, 2017–2021 (USD MILLION)
                    TABLE 55 JUICES: UHT PROCESSING MARKET, BY REGION, 2022–2027 (USD MILLION)
                    TABLE 56 JUICES: UHT PROCESSING MARKET, BY SUBAPPLICATION, 2017–2021 (USD MILLION)
                    TABLE 57 JUICES: UHT PROCESSING MARKET, BY SUBAPPLICATION, 2022–2027 (USD MILLION)
           9.4.2 NECTAR
                    9.4.2.1 Benefits associated with UHT-treated nectars
                               TABLE 58 NECTAR: UHT PROCESSING MARKET, BY REGION, 2017–2021 (USD MILLION)
                               TABLE 59 NECTAR: UHT PROCESSING MARKET, BY REGION, 2022–2027 (USD MILLION)
           9.4.3 STILL DRINKS
                    9.4.3.1 UHT-treated still drinks safe for consumption
                               TABLE 60 STILL DRINKS: UHT PROCESSING MARKET, BY REGION, 2017–2021 (USD MILLION)
                               TABLE 61 STILL DRINKS: UHT PROCESSING MARKET, BY REGION, 2022–2027 (USD MILLION)
    9.5 SOUPS 
           9.5.1 HIGH MICROBIOLOGICAL QUALITY OF UHT-TREATED SOUPS TO BOOST DEMAND
                    TABLE 62 SOUPS: UHT PROCESSING MARKET, BY REGION, 2017–2021 (USD MILLION)
                    TABLE 63 SOUPS: UHT PROCESSING MARKET, BY REGION, 2022–2027 (USD MILLION)
    9.6 DAIRY ALTERNATIVES 
           9.6.1 GROWING INCIDENCE OF LACTOSE-INTOLERANCE
                    TABLE 64 DAIRY ALTERNATIVES: UHT PROCESSING MARKET, BY REGION, 2017–2021 (USD MILLION)
                    TABLE 65 DAIRY ALTERNATIVES: UHT PROCESSING MARKET, BY REGION, 2022–2027 (USD MILLION)
                    TABLE 66 DAIRY ALTERNATIVES: UHT PROCESSING MARKET, BY SUBAPPLICATION, 2017–2021 (USD MILLION)
                    TABLE 67 DAIRY ALTERNATIVES: UHT PROCESSING MARKET, BY SUBAPPLICATION, 2022–2027 (USD MILLION)
           9.6.2 SOY
                    9.6.2.1 Growing consumption of soy milk as healthy milk substitute
                               TABLE 68 SOY: UHT PROCESSING MARKET, BY REGION, 2017–2021 (USD MILLION)
                               TABLE 69 SOY: UHT PROCESSING MARKET, BY REGION, 2022–2027 (USD MILLION)
           9.6.3 ALMOND
                    9.6.3.1 Rising popularity of UHT-treated almond milk
                               TABLE 70 ALMOND: UHT PROCESSING MARKET, BY REGION, 2017–2021 (USD MILLION)
                               TABLE 71 ALMOND: UHT PROCESSING MARKET, BY REGION, 2022–2027 (USD MILLION)
           9.6.4 COCONUT
                    9.6.4.1 Prolonged shelf-life of UHT-treated coconut milk
                               TABLE 72 COCONUT: UHT PROCESSING MARKET, BY REGION, 2017–2021 (USD MILLION)
                               TABLE 73 COCONUT: UHT PROCESSING MARKET, BY REGION, 2022–2027 (USD MILLION)
           9.6.5 RICE
                    9.6.5.1 Rising demand for gluten-free and lactose-free rice milk
                               TABLE 74 RICE: UHT PROCESSING MARKET, BY REGION, 2017–2021 (USD MILLION)
                               TABLE 75 RICE: UHT PROCESSING MARKET, BY REGION, 2022–2027 (USD MILLION)
           9.6.6 OAT
                    9.6.6.1 Therapeutic benefits of oat milk
                               TABLE 76 OAT: UHT PROCESSING MARKET, BY REGION, 2017–2021 (USD MILLION)
                               TABLE 77 OAT: UHT PROCESSING MARKET, BY REGION, 2022–2027 (USD MILLION)
           9.6.7 HEMP
                    9.6.7.1 Global acceptance of hemp milk as cow milk substitute
                               TABLE 78 HEMP: UHT PROCESSING MARKET, BY REGION, 2017–2021 (USD MILLION)
                               TABLE 79 HEMP: UHT PROCESSING MARKET, BY REGION, 2022–2027 (USD MILLION)
           9.6.8 OTHER DAIRY ALTERNATIVES
                    TABLE 80 OTHER DAIRY ALTERNATIVES: UHT PROCESSING MARKET, BY REGION, 2017–2021 (USD MILLION)
                    TABLE 81 OTHER DAIRY ALTERNATIVES: UHT PROCESSING MARKET, BY REGION, 2022–2027 (USD MILLION)
    9.7 OTHER APPLICATIONS 
           TABLE 82 OTHER APPLICATIONS: UHT PROCESSING MARKET, BY REGION, 2017–2021 (USD MILLION)
           TABLE 83 OTHER APPLICATIONS: UHT PROCESSING MARKET, BY REGION, 2022–2027 (USD MILLION)
 
10 UHT PROCESSING MARKET, BY END-PRODUCT FORM (Page No. - 136)
     10.1 INTRODUCTION 
               FIGURE 36 SEMI-LIQUID SEGMENT TO EXHIBIT HIGHER GROWTH BY 2027
               TABLE 84 UHT PROCESSING MARKET, BY END-PRODUCT FORM, 2017–2021 (USD MILLION)
               TABLE 85 UHT PROCESSING MARKET, BY END-PRODUCT FORM, 2022–2027 (USD MILLION)
     10.2 LIQUID 
             10.2.1 HIGH VISCOSITY OF MILK AND DAIRY ALTERNATIVES MAKE THEM SUITABLE FOR UHT PROCESSING
                       TABLE 86 LIQUID: UHT PROCESSING MARKET, BY REGION, 2017–2021 (USD MILLION)
                       TABLE 87 LIQUID: UHT PROCESSING MARKET, BY REGION, 2022–2027 (USD MILLION)
     10.3 SEMI-LIQUID 
             10.3.1 NEED FOR INCREASED SHELF-LIFE OF SEMI-LIQUID PRODUCTS
                       TABLE 88 SEMI-LIQUID: UHT PROCESSING MARKET, BY REGION, 2017–2021 (USD MILLION)
                       TABLE 89 SEMI-LIQUID: UHT PROCESSING MARKET, BY REGION, 2022–2027 (USD MILLION)
 
11 UHT PROCESSING MARKET, BY REGION (Page No. - 141)
     11.1 INTRODUCTION 
               FIGURE 37 FRANCE ACCOUNTED FOR LARGEST SHARE IN 2021
               TABLE 90 UHT PROCESSING MARKET, BY REGION, 2017–2021 (USD MILLION)
               TABLE 91 UHT PROCESSING MARKET, BY REGION, 2022–2027 (USD MILLION)
     11.2 NORTH AMERICA 
               TABLE 92 NORTH AMERICA: UHT PROCESSING MARKET, BY COUNTRY, 2017–2021 (USD MILLION)
               TABLE 93 NORTH AMERICA: UHT PROCESSING MARKET, BY COUNTRY, 2022–2027 (USD MILLION)
               TABLE 94 NORTH AMERICA: UHT PROCESSING MARKET, BY MODE OF EQUIPMENT OPERATION, 2017–2021 (USD MILLION)
               TABLE 95 NORTH AMERICA: UHT PROCESSING MARKET, BY MODE OF EQUIPMENT OPERATION, 2022–2027 (USD MILLION)
               TABLE 96 NORTH AMERICA: UHT PROCESSING MARKET, BY APPLICATION, 2017–2021 (USD MILLION)
               TABLE 97 NORTH AMERICA: UHT PROCESSING MARKET, BY APPLICATION, 2022–2027 (USD MILLION)
               TABLE 98 NORTH AMERICA: UHT PROCESSING MARKET, BY END-PRODUCT FORM, 2017–2021 (USD MILLION)
               TABLE 99 NORTH AMERICA: UHT PROCESSING MARKET, BY END-PRODUCT FORM, 2022–2027 (USD MILLION)
             11.2.1 US
                       11.2.1.1 Product developments and growth in use of technology
                                   TABLE 100 US: UHT PROCESSING MARKET, BY MODE OF EQUIPMENT OPERATION, 2017–2021 (USD MILLION)
                                   TABLE 101 US: UHT PROCESSING MARKET, BY MODE OF EQUIPMENT OPERATION, 2022–2027 (USD MILLION)
                                   TABLE 102 US: UHT PROCESSING MARKET, BY APPLICATION, 2017–2021 (USD MILLION)
                                   TABLE 103 US: UHT PROCESSING MARKET, BY APPLICATION, 2022–2027 (USD MILLION)
             11.2.2 CANADA
                       11.2.2.1 Increased consumption of dairy products
                                   TABLE 104 CANADA: UHT PROCESSING MARKET, BY MODE OF EQUIPMENT OPERATION, 2017–2021 (USD MILLION)
                                   TABLE 105 CANADA: UHT PROCESSING MARKET, BY MODE OF EQUIPMENT OPERATION, 2022–2027 (USD MILLION)
                                   TABLE 106 CANADA: UHT PROCESSING MARKET, BY APPLICATION, 2017–2021 (USD MILLION)
                                   TABLE 107 CANADA: UHT PROCESSING MARKET, BY APPLICATION, 2022–2027 (USD MILLION)
             11.2.3 MEXICO
                       11.2.3.1 Rising awareness regarding benefits of UHT-processed products
                                   TABLE 108 MEXICO: UHT PROCESSING MARKET, BY MODE OF EQUIPMENT OPERATION, 2017–2021 (USD MILLION)
                                   TABLE 109 MEXICO: UHT PROCESSING MARKET, BY MODE OF EQUIPMENT OPERATION, 2022–2027 (USD MILLION)
                                   TABLE 110 MEXICO: UHT PROCESSING MARKET, BY APPLICATION, 2017–2021 (USD MILLION)
                                   TABLE 111 MEXICO: UHT PROCESSING MARKET, BY APPLICATION, 2022–2027 (USD MILLION)
     11.3 EUROPE 
               FIGURE 38 EUROPE: UHT PROCESSING MARKET SNAPSHOT
               TABLE 112 EUROPE: UHT PROCESSING MARKET, BY COUNTRY, 2017–2021 (USD MILLION)
               TABLE 113 EUROPE: UHT PROCESSING MARKET, BY COUNTRY, 2022–2027 (USD MILLION)
               TABLE 114 EUROPE: UHT PROCESSING MARKET, BY MODE OF EQUIPMENT OPERATION, 2017–2021 (USD MILLION)
               TABLE 115 EUROPE: UHT PROCESSING MARKET, BY MODE OF EQUIPMENT OPERATION, 2022–2027 (USD MILLION)
               TABLE 116 EUROPE: UHT PROCESSING MARKET, BY APPLICATION, 2017–2021 (USD MILLION)
               TABLE 117 EUROPE: UHT PROCESSING MARKET, BY APPLICATION, 2022–2027 (USD MILLION)
               TABLE 118 EUROPE: UHT PROCESSING MARKET, BY END-PRODUCT FORM, 2017–2021 (USD MILLION)
               TABLE 119 EUROPE: UHT PROCESSING MARKET, BY END-PRODUCT FORM, 2022–2027 (USD MILLION)
             11.3.1 FRANCE
                       11.3.1.1 Rising popularity of UHT-treated yogurts and creams
                                   TABLE 120 FRANCE: UHT PROCESSING MARKET, BY MODE OF EQUIPMENT OPERATION, 2017–2021 (USD MILLION)
                                   TABLE 121 FRANCE: UHT PROCESSING MARKET, BY MODE OF OPERATION, 2022–2027 (USD MILLION)
                                   TABLE 122 FRANCE: UHT PROCESSING MARKET, BY APPLICATION, 2017–2021 (USD MILLION)
                                   TABLE 123 FRANCE: UHT PROCESSING MARKET, BY APPLICATION, 2022–2027 (USD MILLION)
             11.3.2 GERMANY
                       11.3.2.1 Growing export of milk products
                                   TABLE 124 GERMANY: UHT PROCESSING MARKET, BY MODE OF EQUIPMENT OPERATION, 2017–2021 (USD MILLION)
                                   TABLE 125 GERMANY: UHT PROCESSING MARKET, BY MODE OF EQUIPMENT OPERATION, 2022–2027 (USD MILLION)
                                   TABLE 126 GERMANY: UHT PROCESSING MARKET, BY APPLICATION, 2017–2021 (USD MILLION)
                                   TABLE 127 GERMANY: UHT PROCESSING MARKET, BY APPLICATION, 2022–2027 (USD MILLION)
             11.3.3 SPAIN
                       11.3.3.1 High consumption of UHT-treated milk
                                   TABLE 128 SPAIN: UHT PROCESSING MARKET, BY MODE OF EQUIPMENT OPERATION, 2017–2021 (USD MILLION)
                                   TABLE 129 SPAIN: UHT PROCESSING MARKET, BY MODE OF EQUIPMENT OPERATION, 2022–2027 (USD MILLION)
                                   TABLE 130 SPAIN: UHT PROCESSING MARKET, BY APPLICATION, 2017–2021 (USD MILLION)
                                   TABLE 131 SPAIN: UHT PROCESSING MARKET, BY APPLICATION, 2022–2027 (USD MILLION)
             11.3.4 ITALY
                       11.3.4.1 Low cost of producing UHT-processed milk
                                   TABLE 132 ITALY: UHT PROCESSING MARKET, BY MODE OF EQUIPMENT OPERATION, 2017–2021 (USD MILLION)
                                   TABLE 133 ITALY: UHT PROCESSING MARKET, BY MODE OF EQUIPMENT OPERATION, 2022–2027 (USD MILLION)
                                   TABLE 134 ITALY: UHT PROCESSING MARKET, BY APPLICATION, 2017–2021 (USD MILLION)
                                   TABLE 135 ITALY: UHT PROCESSING MARKET, BY APPLICATION, 2022–2027 (USD MILLION)
             11.3.5 REST OF EUROPE
                       TABLE 136 REST OF EUROPE: UHT PROCESSING MARKET, BY MODE OF EQUIPMENT OPERATION, 2017–2021 (USD MILLION)
                       TABLE 137 REST OF EUROPE: UHT PROCESSING MARKET, BY MODE OF EQUIPMENT OPERATION, 2022–2027 (USD MILLION)
                       TABLE 138 REST OF EUROPE: UHT PROCESSING MARKET, BY APPLICATION, 2017–2021 (USD MILLION)
                       TABLE 139 REST OF EUROPE: UHT PROCESSING MARKET, BY APPLICATION, 2022–2027 (USD MILLION)
     11.4 ASIA PACIFIC 
               FIGURE 39 ASIA PACIFIC: UHT PROCESSING MARKET SNAPSHOT
               TABLE 140 ASIA PACIFIC: UHT PROCESSING MARKET, BY COUNTRY, 2017–2021 (USD MILLION)
               TABLE 141 ASIA PACIFIC: UHT PROCESSING MARKET, BY COUNTRY, 2022–2027 (USD MILLION)
               TABLE 142 ASIA PACIFIC: UHT PROCESSING MARKET, BY MODE OF EQUIPMENT OPERATION, 2017–2021 (USD MILLION)
               TABLE 143 ASIA PACIFIC: UHT PROCESSING MARKET, BY MODE OF EQUIPMENT OPERATION, 2022–2027 (USD MILLION)
               TABLE 144 ASIA PACIFIC: UHT PROCESSING MARKET, BY APPLICATION, 2017–2021 (USD MILLION)
               TABLE 145 ASIA PACIFIC: UHT PROCESSING MARKET, BY APPLICATION, 2022–2027 (USD MILLION)
               TABLE 146 ASIA PACIFIC: UHT PROCESSING MARKET, BY END-PRODUCT FORM, 2017–2021 (USD MILLION)
               TABLE 147 ASIA PACIFIC: UHT PROCESSING MARKET, BY END-PRODUCT FORM, 2022–2027 (USD MILLION)
             11.4.1 AUSTRALIA
                       11.4.1.1 Flourishing plant-based dairy industry
                                   FIGURE 40 SHARE OF TOTAL MILK PRODUCTION (%) IN AUSTRALIA, 2018
                                   TABLE 148 AUSTRALIA: UHT PROCESSING MARKET, BY MODE OF EQUIPMENT OPERATION, 2017–2021 (USD MILLION)
                                   TABLE 149 AUSTRALIA: UHT PROCESSING MARKET, BY MODE OF EQUIPMENT OPERATION, 2022–2027 (USD MILLION)
                                   TABLE 150 AUSTRALIA: UHT PROCESSING MARKET, BY APPLICATION, 2017–2021 (USD MILLION)
                                   TABLE 151 AUSTRALIA: UHT PROCESSING MARKET, BY APPLICATION, 2022–2027 (USD MILLION)
             11.4.2 INDIA
                       11.4.2.1 Rising consumption of UHT-treated juices, soups, and milk
                                   TABLE 152 INDIA: UHT PROCESSING MARKET, BY MODE OF EQUIPMENT OPERATION, 2017–2021 (USD MILLION)
                                   TABLE 153 INDIA: UHT PROCESSING MARKET, BY MODE OF EQUIPMENT OPERATION, 2022–2027 (USD MILLION)
                                   TABLE 154 INDIA: UHT PROCESSING MARKET, BY APPLICATION, 2017–2021 (USD MILLION)
                                   TABLE 155 INDIA: UHT PROCESSING MARKET, BY APPLICATION, 2022–2027 (USD MILLION)
             11.4.3 CHINA
                       11.4.3.1 Large-scale use of e-commerce to boost consumption of UHT milk
                                   TABLE 156 CHINA: UHT PROCESSING MARKET, BY MODE OF EQUIPMENT OPERATION, 2017–2021 (USD MILLION)
                                   TABLE 157 CHINA: UHT PROCESSING MARKET, BY MODE OF EQUIPMENT OPERATION, 2022–2027 (USD MILLION)
                                   TABLE 158 CHINA: UHT PROCESSING MARKET, BY APPLICATION, 2017–2021 (USD MILLION)
                                   TABLE 159 CHINA: UHT PROCESSING MARKET, BY APPLICATION, 2022–2027 (USD MILLION)
             11.4.4 NEW ZEALAND
                       11.4.4.1 Growing reinvestments in new packaging and product innovations
                                   TABLE 160 NEW ZEALAND: UHT PROCESSING MARKET, BY MODE OF EQUIPMENT OPERATION, 2017–2021 (USD MILLION)
                                   TABLE 161 NEW ZEALAND: UHT PROCESSING MARKET, BY MODE OF EQUIPMENT OPERATION, 2022–2027 (USD MILLION)
                                   TABLE 162 NEW ZEALAND: UHT PROCESSING MARKET, BY APPLICATION, 2017–2021 (USD MILLION)
                                   TABLE 163 NEW ZEALAND: UHT PROCESSING MARKET, BY APPLICATION, 2022–2027 (USD MILLION)
             11.4.5 REST OF ASIA PACIFIC
                       TABLE 164 REST OF ASIA PACIFIC: UHT PROCESSING MARKET, BY MODE OF EQUIPMENT OPERATION, 2017–2021 (USD MILLION)
                       TABLE 165 REST OF ASIA PACIFIC: UHT PROCESSING MARKET, BY MODE OF EQUIPMENT OPERATION, 2022–2027 (USD MILLION)
                       TABLE 166 REST OF ASIA PACIFIC: UHT PROCESSING MARKET, BY APPLICATION, 2017–2021 (USD MILLION)
                       TABLE 167 REST OF ASIA PACIFIC: UHT PROCESSING MARKET, BY APPLICATION, 2022–2027 (USD MILLION)
     11.5 SOUTH AMERICA 
               TABLE 168 SOUTH AMERICA: UHT PROCESSING MARKET, BY COUNTRY, 2017–2021 (USD MILLION)
               TABLE 169 SOUTH AMERICA: UHT PROCESSING MARKET, BY COUNTRY, 2022–2027 (USD MILLION)
               TABLE 170 SOUTH AMERICA: UHT PROCESSING MARKET, BY MODE OF EQUIPMENT OPERATION, 2017–2021 (USD MILLION)
               TABLE 171 SOUTH AMERICA: UHT PROCESSING MARKET, BY MODE OF EQUIPMENT OPERATION, 2022–2027 (USD MILLION)
               TABLE 172 SOUTH AMERICA: UHT PROCESSING MARKET, BY APPLICATION, 2017–2021 (USD MILLION)
               TABLE 173 SOUTH AMERICA: UHT PROCESSING MARKET, BY APPLICATION, 2022–2027 (USD MILLION)
               TABLE 174 SOUTH AMERICA: UHT PROCESSING MARKET, BY END-PRODUCT FORM, 2017–2021 (USD MILLION)
               TABLE 175 SOUTH AMERICA: UHT PROCESSING MARKET, BY END-PRODUCT FORM, 2022–2027 (USD MILLION)
             11.5.1 BRAZIL
                       11.5.1.1 Rising production of milk and milk products
                                   TABLE 176 BRAZIL: UHT PROCESSING MARKET, BY MODE OF EQUIPMENT OPERATION, 2017–2021 (USD MILLION)
                                   TABLE 177 BRAZIL: UHT PROCESSING MARKET, BY MODE OF EQUIPMENT OPERATION, 2022–2027 (USD MILLION)
                                   TABLE 178 BRAZIL: UHT PROCESSING MARKET, BY APPLICATION, 2017–2021 (USD MILLION)
                                   TABLE 179 BRAZIL: UHT PROCESSING MARKET, BY APPLICATION, 2022–2027 (USD MILLION)
             11.5.2 ARGENTINA
                       11.5.2.1 Growing demand for products with long shelf-life
                                   TABLE 180 ARGENTINA: UHT PROCESSING MARKET, BY MODE OF EQUIPMENT OPERATION, 2017–2021 (USD MILLION)
                                   TABLE 181 ARGENTINA: UHT PROCESSING MARKET, BY MODE OF EQUIPMENT OPERATION, 2022–2027 (USD MILLION)
                                   TABLE 182 ARGENTINA: UHT PROCESSING MARKET, BY APPLICATION, 2017–2021 (USD MILLION)
                                   TABLE 183 ARGENTINA: UHT PROCESSING MARKET, BY APPLICATION, 2022–2027 (USD MILLION)
             11.5.3 REST OF SOUTH AMERICA
                       TABLE 184 REST OF SOUTH AMERICA: UHT PROCESSING MARKET, BY MODE OF EQUIPMENT OPERATION, 2017–2021 (USD MILLION)
                       TABLE 185 REST OF SOUTH AMERICA: UHT PROCESSING MARKET, BY MODE OF EQUIPMENT OPERATION, 2022–2027 (USD MILLION)
                       TABLE 186 REST OF SOUTH AMERICA: UHT PROCESSING MARKET, BY APPLICATION, 2017–2021 (USD MILLION)
                       TABLE 187 REST OF SOUTH AMERICA: UHT PROCESSING MARKET, BY APPLICATION, 2022–2027 (USD MILLION)
     11.6 REST OF THE WORLD 
               TABLE 188 ROW: UHT PROCESSING MARKET, BY COUNTRY, 2017–2021 (USD MILLION)
               TABLE 189 ROW: UHT PROCESSING MARKET, BY COUNTRY, 2022–2027 (USD MILLION)
               TABLE 190 ROW: UHT PROCESSING MARKET, BY MODE OF EQUIPMENT OPERATION, 2017–2021 (USD MILLION)
               TABLE 191 ROW: UHT PROCESSING MARKET, BY MODE OF EQUIPMENT OPERATION, 2022–2027 (USD MILLION)
               TABLE 192 ROW: UHT PROCESSING MARKET, BY APPLICATION, 2017–2021 (USD MILLION)
               TABLE 193 ROW: UHT PROCESSING MARKET, BY APPLICATION, 2022–2027 (USD MILLION)
               TABLE 194 ROW: UHT PROCESSING MARKET, BY END-PRODUCT FORM, 2017–2021 (USD MILLION)
               TABLE 195 ROW: UHT PROCESSING MARKET, BY END-PRODUCT FORM, 2022–2027 (USD MILLION)
             11.6.1 SOUTH AFRICA
                       11.6.1.1 Increased preference for durable dairy products
                                   TABLE 196 SOUTH AFRICA: UHT PROCESSING MARKET, BY MODE OF EQUIPMENT OPERATION, 2017–2021 (USD MILLION)
                                   TABLE 197 SOUTH AFRICA: UHT PROCESSING MARKET, BY MODE OF EQUIPMENT OPERATION, 2022–2027 (USD MILLION)
                                   TABLE 198 SOUTH AFRICA: UHT PROCESSING MARKET, BY APPLICATION, 2017–2021 (USD MILLION)
                                   TABLE 199 SOUTH AFRICA: UHT PROCESSING MARKET, BY APPLICATION, 2022–2027 (USD MILLION)
             11.6.2 OTHERS IN ROW
                       TABLE 200 OTHERS IN ROW: UHT PROCESSING MARKET, BY MODE OF EQUIPMENT OPERATION, 2017–2021 (USD MILLION)
                       TABLE 201 OTHERS IN ROW: UHT PROCESSING MARKET, BY MODE OF EQUIPMENT OPERATION, 2022–2027 (USD MILLION)
                       TABLE 202 OTHERS IN ROW: UHT PROCESSING MARKET, BY APPLICATION, 2017–2021 (USD MILLION)
                       TABLE 203 OTHERS IN ROW: UHT PROCESSING MARKET, BY APPLICATION, 2022–2027 (USD MILLION)
 
12 COMPETITIVE LANDSCAPE (Page No. - 190)
     12.1 OVERVIEW 
     12.2 MARKET SHARE ANALYSIS 
               TABLE 204 UHT PROCESSING MARKET: DEGREE OF COMPETITION
     12.3 SEGMENTAL REVENUE ANALYSIS OF KEY PLAYERS 
               FIGURE 41 SEGMENTAL REVENUE ANALYSIS OF KEY MARKET PLAYERS, 2017–2021 (USD BILLION)
     12.4 COMPANY EVALUATION QUADRANT FOR KEY PLAYERS, 2021 
             12.4.1 STARS
             12.4.2 EMERGING LEADERS
             12.4.3 PERVASIVE PLAYERS
             12.4.4 PARTICIPANTS
                       FIGURE 42 UHT PROCESSING MARKET: COMPANY EVALUATION QUADRANT, 2021 (KEY PLAYERS)
             12.4.5 PRODUCT FOOTPRINT
                       TABLE 205 COMPANY FOOTPRINT, BY MODE OF EQUIPMENT OPERATION
                       TABLE 206 COMPANY FOOTPRINT, BY APPLICATION
                       TABLE 207 COMPANY FOOTPRINT, BY REGION
                       TABLE 208 OVERALL COMPANY FOOTPRINT
     12.5 COMPANY EVALUATION QUADRANT FOR STARTUPS/SMES, 2021 
             12.5.1 PROGRESSIVE COMPANIES
             12.5.2 STARTING BLOCKS
             12.5.3 RESPONSIVE COMPANIES
             12.5.4 DYNAMIC COMPANIES
                       FIGURE 43 UHT PROCESSING MARKET: COMPANY EVALUATION QUADRANT, 2021 (STARTUPS/SMES)
             12.5.5 COMPETITIVE BENCHMARKING OF KEY STARTUPS/SMES
                       TABLE 209 DETAILED LIST OF KEY STARTUPS/SMES
                       TABLE 210 COMPETITIVE BENCHMARKING OF KEY STARTUPS/SMES
     12.6 COMPETITIVE SCENARIO 
             12.6.1 DEALS
                       TABLE 211 UHT PROCESSING MARKET: DEALS, 2022
 
13 COMPANY PROFILES (Page No. - 203)
     13.1 KEY PLAYERS 
(Business Overview, Products Offered, Recent Developments, and MnM View)*
             13.1.1 TETRA LAVAL
                       TABLE 212 TETRA LAVAL: BUSINESS OVERVIEW
                       FIGURE 44 TETRA LAVAL: COMPANY SNAPSHOT
                       TABLE 213 TETRA LAVAL: PRODUCTS OFFERED
             13.1.2 GEA GROUP
                       TABLE 214 GEA GROUP: BUSINESS OVERVIEW
                       FIGURE 45 GEA GROUP: COMPANY SNAPSHOT
                       TABLE 215 GEA GROUP: PRODUCTS OFFERED
             13.1.3 ALFA LAVAL
                       TABLE 216 ALFA LAVAL: BUSINESS OVERVIEW
                       FIGURE 46 ALFA LAVAL: COMPANY SNAPSHOT
                       TABLE 217 ALFA LAVAL: PRODUCTS OFFERED
             13.1.4 SPX FLOW
                       TABLE 218 SPX FLOW: BUSINESS OVERVIEW
                       FIGURE 47 SPX FLOW: COMPANY SNAPSHOT
                       TABLE 219 SPX FLOW: PRODUCTS OFFERED
                       TABLE 220 SPX FLOW: DEALS
             13.1.5 ELECSTER OYJ
                       TABLE 221 ELECSTER OYJ: BUSINESS OVERVIEW
                       TABLE 222 ELECSTER OYJ: PRODUCTS OFFERED
             13.1.6 SHANGHAI TRIOWIN INTELLIGENT MACHINERY CO., LTD.
                       TABLE 223 SHANGHAI TRIOWIN INTELLIGENT MACHINERY CO., LTD.: BUSINESS OVERVIEW
                       TABLE 224 SHANGHAI TRIOWIN INTELLIGENT MACHINERY CO., LTD.: PRODUCTS OFFERED
             13.1.7 MICROTHERMICS, INC
                       TABLE 225 MICROTHERMICS, INC: BUSINESS OVERVIEW
                       TABLE 226 MICROTHERMICS, INC: PRODUCTS OFFERED
             13.1.8 REDA S.P.A.
                       TABLE 227 REDA S.P.A.: BUSINESS OVERVIEW
                       TABLE 228 REDA S.P.A.: PRODUCTS OFFERED
             13.1.9 SHANGHAI JIMEI FOOD MACHINERY CO., LTD.
                       TABLE 229 SHANGHAI JIMEI FOOD MACHINERY CO., LTD.: BUSINESS OVERVIEW
                       TABLE 230 SHANGHAI JIMEI FOOD MACHINERY CO., LTD.: PRODUCTS OFFERED
             13.1.10 PROXES GMBH
                       TABLE 231 PROXES GMBH: BUSINESS OVERVIEW
                       TABLE 232 PROXES GMBH: PRODUCTS OFFERED
             13.1.11 GOMA
                       TABLE 233 GOMA: BUSINESS OVERVIEW
                       TABLE 234 GOMA: PRODUCTS OFFERED
             13.1.12 JBT
                       TABLE 235 JBT: BUSINESS OVERVIEW
                       FIGURE 48 JBT: COMPANY SNAPSHOT
                       TABLE 236 JBT: PRODUCTS OFFERED
             13.1.13 NEOLOGIC ENGINEERS PRIVATE LIMITED
                       TABLE 237 NEOLOGIC ENGINEERS PRIVATE LIMITED: BUSINESS OVERVIEW
                       TABLE 238 NEOLOGIC ENGINEERS PRIVATE LIMITED: PRODUCTS OFFERED
             13.1.14 HIGHLAND EQUIPMENT INC.
                       TABLE 239 HIGHLAND EQUIPMENT INC.: BUSINESS OVERVIEW
                       TABLE 240 HIGHLAND EQUIPMENT INC.: PRODUCTS OFFERED
             13.1.15 KRONES AG
                       TABLE 241 KRONES AG: BUSINESS OVERVIEW
                       FIGURE 49 KRONES AG: COMPANY SNAPSHOT
                       TABLE 242 KRONES AG: PRODUCTS OFFERED
     13.2 STARTUPS/SMES 
             13.2.1 COLDTECH ENGINEERING PVT. LTD.
                       TABLE 243 COLDTECH ENGINEERING PVT. LTD.: BUSINESS OVERVIEW
                       TABLE 244 COLDTECH ENGINEERING PVT. LTD.: PRODUCTS OFFERED
             13.2.2 CEDARSTONE INDUSTRY
                       TABLE 245 CEDARSTONE INDUSTRY: BUSINESS OVERVIEW
                       TABLE 246 CEDARSTONE INDUSTRY: PRODUCTS OFFERED
             13.2.3 CFT S.P.A.
                       TABLE 247 CFT S.P.A.: BUSINESS OVERVIEW
                       FIGURE 50 CFT S.P.A.: COMPANY SNAPSHOT
                       TABLE 248 CFT S.P.A.: PRODUCTS OFFERED
             13.2.4 IBC MACHINE
                       TABLE 249 IBC MACHINE: BUSINESS OVERVIEW
                       TABLE 250 IBC MACHINE: PRODUCTS OFFERED
             13.2.5 FBR-ELPO S.P.A.
                       TABLE 251 FBR-ELPO S.P.A.: BUSINESS OVERVIEW
                       TABLE 252 FBR-ELPO S.P.A.: PRODUCTS OFFERED
             13.2.6 IWAI KIKAI KOGYO CO., LTD.
             13.2.7 WENZHOU VINCE MACHINERY SCIENCE CO., LTD.
             13.2.8 ZHANGJIAGANG NANCHENG MACHINERY CO., LTD.
             13.2.9 SHANGHAI STABLE INDUSTRIAL CO., LTD.
             13.2.10 GENYOND MACHINERY INDUSTRIAL GROUP LIMITED
* Business Overview, Products Offered, Recent Developments, and MnM View might not be captured in case of unlisted companies.
 
14 ADJACENT & RELATED MARKETS (Page No. - 242)
     14.1 INTRODUCTION 
     14.2 LIMITATIONS 
     14.3 DAIRY PROCESSING EQUIPMENT MARKET 
             14.3.1 MARKET DEFINITION
                       FIGURE 51 MILK PROCESSING: PROCESS FLOW DIAGRAM
             14.3.2 MARKET OVERVIEW
                       14.3.2.1 Growing demand for dairy products
                       14.3.2.2 Adoption of efficient technologies by dairy product manufacturers
             14.3.3 DAIRY PROCESSING EQUIPMENT MARKET, BY TYPE
                       14.3.3.1 Introduction
                                   TABLE 253 DAIRY PROCESSING EQUIPMENT MARKET, BY TYPE, 2016–2020 (USD MILLION)
                                   TABLE 254 DAIRY PROCESSING EQUIPMENT MARKET, BY TYPE, 2021–2026 (USD MILLION)
             14.3.4 DAIRY PROCESSING EQUIPMENT MARKET, BY REGION
                       14.3.4.1 Introduction
                                   TABLE 255 DAIRY PROCESSING EQUIPMENT MARKET, BY REGION, 2016–2020 (USD MILLION)
                                   TABLE 256 DAIRY PROCESSING EQUIPMENT MARKET, BY REGION, 2021–2026 (USD MILLION)
     14.4 BEVERAGE PROCESSING EQUIPMENT MARKET 
             14.4.1 MARKET DEFINITION
             14.4.2 MARKET OVERVIEW
             14.4.3 BEVERAGE PROCESSING EQUIPMENT MARKET, BY TYPE
                       14.4.3.1 Introduction
                                   TABLE 257 BEVERAGE PROCESSING EQUIPMENT MARKET, BY TYPE, 2017–2020 (USD MILLION)
                                   TABLE 258 BEVERAGE PROCESSING EQUIPMENT MARKET, BY TYPE, 2021–2026 (USD MILLION)
             14.4.4 BEVERAGE PROCESSING EQUIPMENT MARKET, BY REGION
                       14.4.4.1 Introduction
                                   TABLE 259 BEVERAGE PROCESSING EQUIPMENT MARKET, BY REGION, 2017–2020 (USD MILLION)
                                   TABLE 260 BEVERAGE PROCESSING EQUIPMENT MARKET, BY REGION, 2021–2026 (USD MILLION)
 
15 APPENDIX (Page No. - 252)
     15.1 DISCUSSION GUIDE 
     15.2 KNOWLEDGESTORE: MARKETSANDMARKETS’ SUBSCRIPTION PORTAL 
     15.3 CUSTOMIZATION OPTIONS 
     15.4 RELATED REPORTS 
     15.5 AUTHOR DETAILS 

The study involved four major steps in estimating the size of the UHT Processing market. Exhaustive secondary research was done to collect information on the market, as well as the parent market. The next step was to validate these findings, assumptions, and sizing with industry experts across the value chain through primary research. Both the top-down and bottom-up approaches were employed to estimate the complete market size. After that, market breakdown and data triangulation were used to estimate the market size of segments and subsegments.

Secondary Research

In the secondary research process, various secondary sources were referred to, to identify and collect information for this study. The secondary sources included annual reports, press releases and investor presentations of companies, white papers, certified publications, articles from recognized authors, gold & silver standard websites, regulatory bodies, trade directories, and databases. Secondary research was mainly conducted to obtain key information about the industry’s supply chain, the market’s monetary chain, the total pool of key players, market classification and segmentation according to industry trends to the bottom-most level, and geographical markets. It was also used to obtain information on the key developments from a market-oriented perspective.

Primary Research

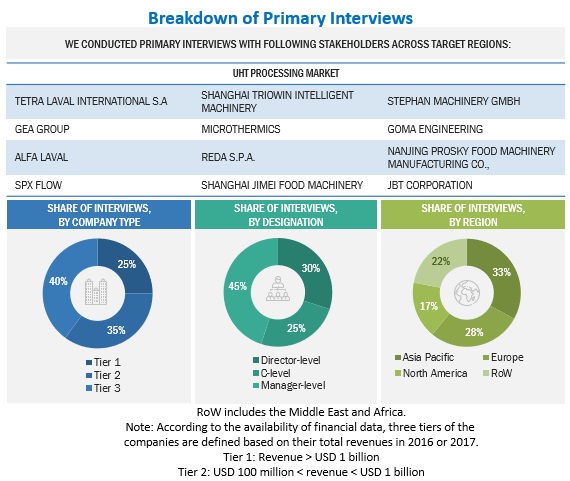
The market comprises several stakeholders in the supply chain, including suppliers, manufacturers, and end-product manufacturers. Various primary sources from both the supply and demand sides of both markets were interviewed to obtain qualitative and quantitative information.

The primary interviewees from the demand side include key opinion leaders, executives, vice presidents, and CEOs of the companies and organizations, operating in the UHT processing market. The primary sources from the supply side include industry experts, such as CEOs, vice presidents, marketing directors, technology and innovation directors, and related key executives from various key companies and organizations operating in the UHT processing market.
UHT Processing Market Size, and Share

To know about the assumptions considered for the study, download the pdf brochure

Market Size Estimation

Both top-down and bottom-up approaches have been used to estimate and validate the total size of the UHT processing market. These approaches have also been used extensively to determine the size of the various sub-segments in the market. The research methodology used to estimate the market size includes the following details:

  • The key players in the industry and markets were identified through extensive secondary research.
  • The UHT processing value chain and market size in terms of value and volume have been determined through primary and secondary research.
  • All percentage shares, splits, and breakdowns were determined using secondary sources and verified through primary sources.
  • All macroeconomic and microeconomic factors affecting the growth of the UHT processing market were considered while estimating the market size.
  • All the possible parameters that affect the market covered in this research study have been accounted for, viewed in extensive detail, verified through primary research, and analyzed to obtain the final quantitative and qualitative data.

Bottom-Up

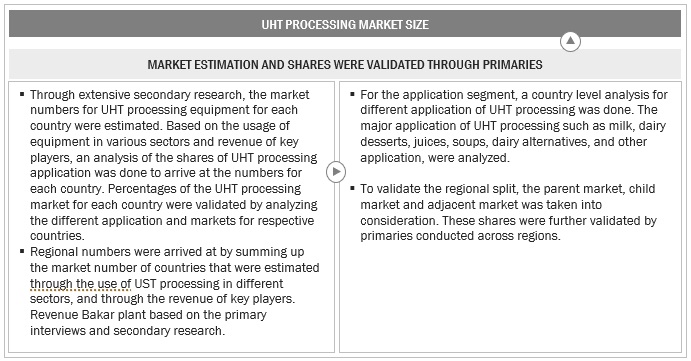
In the bottom-up approach, UHT processing for mode of application, application, end-product form, and region were added to arrive at the global and regional market size and CAGR

  • Based on the share of UHT processing for each application at regional and country levels, the market sizes were analyzed. Thus, with a bottom-up approach for applications at the country level, the global market for UHT processing was estimated.
  • Based on the demand for applications, offerings of key players, and the region-wise market share of major players, the global market for applications was estimated
  • Other factors considered include demand for UHT-treated products, products with higher shelf- life, consumer awareness, functional trends, the adoption rate for UHT-processed products, patents registered, and organic & inorganic growth attempts
  • From this, market sizes for each region were derived.
  • All percentage shares, splits, and breakdowns were determined using secondary sources and verified through primary sources.

The following figure represents the overall market size estimation process employed for this study.

Market Size Estimation Methodology: Bottom-Up Approach
UHT Processing Market Size, and Share

To know about the assumptions considered for the study, Request for Free Sample Report

Market Size Estimation Methodology: Top-Down Approach
UHT Processing Market Size, and Share

Data Triangulation

After arriving at the overall market size from the market estimation process explained above, the total market was split into several segments and subsegments. In order to complete the overall UHT processing market and arrive at the exact statistics for all segments, data triangulation and market breakdown procedures were employed wherever applicable. The data was triangulated by studying various factors and trends from both the demand and supply sides. Additionally, the market size was validated using both top-down and bottom-up approaches.

Report Objectives

Market Intelligence

  • Determining and projecting the size of the UHT processing market with respect to its mode of application, end-product form, application, and Region over a five-year period ranging from 2022 to 2027
  • Identifying the attractive opportunities in the market by determining the largest and fastest-growing segments across the key regions
  • Analyzing the demand-side factors based on the following:
    • Impact of macro- and micro-economic factors on the market
    • Shifts in demand patterns across different subsegments and regions
  • Providing detailed information about the key factors influencing the growth of the market (drivers, restraints, opportunities, and industry-specific challenges)

Competitive Intelligence

  • Identifying and profiling the key market players in the UHT processing market
  • Providing a comparative analysis of the market leaders based on the following:
    • Product offerings
    • Business strategies
    • Strengths and weaknesses
    • Key financials
  • Understanding the competitive landscape and identifying the major growth strategies adopted by players across the key regions
  • Analyzing the supply chain and regulatory frameworks across regions and their impact on prominent market players
  • Providing insights into the key investments in product innovations and technology in the UHT processing market

Available Customizations

Along with the market data, MarketsandMarkets offers customizations according to the company's specific scientific needs.

The following customization options are available for the report

Product Analysis

  • Product matrix, which gives a detailed comparison of the product portfolio of each company

Geographic Analysis

  • Further breakdown of the Rest of Europe market for UHT processing into the Netherlands and Greece
  • Further breakdown of the Rest of Asia Pacific market for UHT processing into Vietnam, Thailand, and Malaysia
  • Further breakdown of the Rest of South America market for UHT processing into Peru and Ecuador
  • Further breakdown of other countries in the ROW market for UHT processing into Egypt, Israel, and Turkey

Company Information

  • Detailed analyses and profiling of additional market players (up to five)
Custom Market Research Services

We will customize the research for you, in case the report listed above does not meet with your exact requirements. Our custom research will comprehensively cover the business information you require to help you arrive at strategic and profitable business decisions.

Request Customization

Instant Answers with GPT - Ask Now!

Ask real questions. Get complete answers !
Report Code
FB 5999
Published ON
Dec, 2022
Choose License Type
BUY NOW
  • SHARE
X
Request Customization
Speak to Analyst
Speak to Analyst
OR FACE-TO-FACE MEETING
PERSONALIZE THIS RESEARCH
  • Triangulate with your Own Data
  • Get Data as per your Format and Definition
  • Gain a Deeper Dive on a Specific Application, Geography, Customer or Competitor
  • Any level of Personalization
REQUEST A FREE CUSTOMIZATION
LET US HELP YOU!
  • What are the Known and Unknown Adjacencies Impacting the UHT Processing Market
  • What will your New Revenue Sources be?
  • Who will be your Top Customer; what will make them switch?
  • Defend your Market Share or Win Competitors
  • Get a Scorecard for Target Partners
CUSTOMIZED WORKSHOP REQUEST
knowledgestore logo

Want to explore hidden markets that can drive new revenue in UHT Processing Market?

Find Hidden Markets
  • Call Us
  • +1-888-600-6441 (Corporate office hours)
  • +1-888-600-6441 (US/Can toll free)
  • +44-800-368-9399 (UK office hours)
CONNECT WITH US
ABOUT TRUST ONLINE
©2024 MarketsandMarkets Research Private Ltd. All rights reserved
DMCA.com Protection Status
Website Feedback