Smart Gas Market by Device (AMR & AMI Meters), Solution (GIS, SCADA, Asset Condition Monitoring and Performance Management, MDM, Outage Management & Remote Monitoring), Service (Consulting, Deployment, & Managed) and Region - Global Forecast to 2022


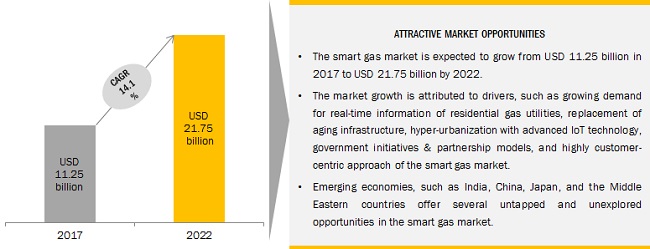
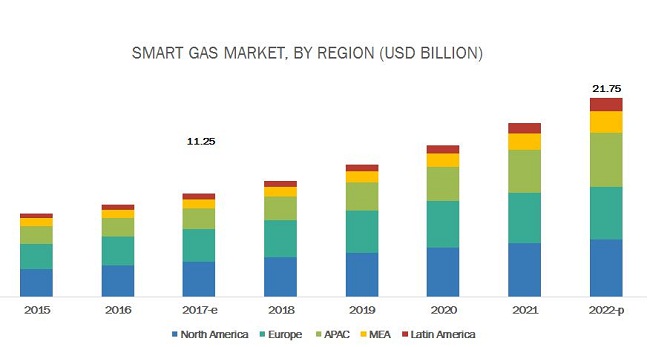
[143 Pages Report] The smart gas market size expected to grow from USD 11.25 Billion in 2017 to USD 21.75 Billion by 2022, at a Compound Annual Growth Rate (CAGR) of 14.1% during the forecast period. The major drivers for the upsurge in the market include the growing demand for customer-centric approach leading to the overall market growth of the market, replacement of aging infrastructure driving investment in the market, and the increasing global energy demand leading to adoption of sophisticated technologies.
Attractive Opportunities in the Smart Gas Market
See how this study impacted revenues for other players in Smart Gas Market
Helped one of the largest energy companies in Europe in identifying ~USD 200 million revenue potential by tapping into smart gas technologies across Europe
Client�s Problem Statement
One of the largest technology companies in the energy and power sector in Europe was trying to identify the market potential for the deployment of technology in gas utilities. The company was also looking for vendors in the smart gas ecosystem.
MnM Approach
Market sizing and five-year forecast for technology solutions such as remote monitoring, analytics, and security, and services were provided along with the growth rate after an assessment of opportunities.
The competitive landscape covering organic and inorganic strategies, market-related developments, and smart gas-related offerings was identified and analyzed to ascertain the role of technology vendors and utilities in the ecosystem.
Region-wise analysis of the adoption of AMR and AMI meters was provided to showcase the level of automation each region was witnessing.
Revenue Impact (RI)
Our analysis helped the client tap into a USD11 billion market, with projected revenue of ~USD 200 million within three years from our recommendations.
Among solutions, remote monitoring to have the highest growth
The remote monitoring solution segment is expected to grow at the highest CAGR during the forecast period, owing to the increasing demand of vital functionalities this solution offers, such as, tracking asset performance, which provides real-time data during gas operations. Factors, such as production time, leakage rate, energy usage, and climatic condition can be collected, analyzed, and presented to the designated personnel, in terms of performance data and ability to control data, such as remotely shutting off gas operations.
AMR meters segment to hold the largest market share among devices
The Automatic Meter Reading (AMR) meters device segment is expected to have the largest market share during the forecast period, owing to the cost effectiveness and its preference for smaller utilities, as it is cheaper and offers benefits, such as accurate meter readings and improved & transparent billing processes.
North America to account for the largest market size during the forecast period
As per the geographic analysis, North America is expected witness significant growth in the smart gas market over the forecast period due to massive upcoming projects. North America has the highest installation rate (over 50%) of AMR devices. Over the past few years, numerous utilities in the US have boarded advanced smart gas schemes, wherein their main objectives are to deploy second-generation advanced metering infrastructure, communication modules, asset management, workforce management, security features, analytics, and Meter Data Management (MDM).
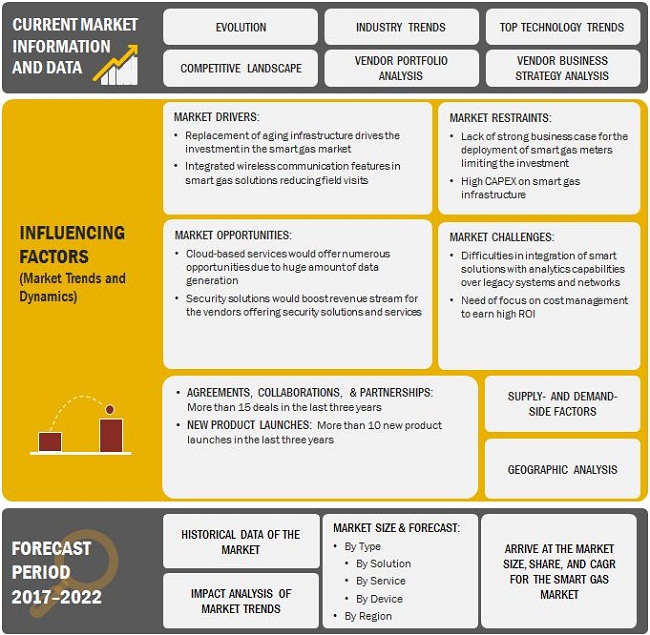
Key Market Dynamics in Smart Gas Market
Growing demand for customer-centric approach would lead to the growth of the market
The customer-centric approach brings along a lot of benefits, such as increased customer satisfaction, good company image, identifying the gaps in customer offerings, and taking advantage of opportunities for growth. The utility companies do not tend to be customer-centric as the demand would ever surge. However, the companies following a customer-centric approach witness additional growth in terms of customers and revenue. Residential consumers are more focused on accurate billing and consumption usage data delivered in real time. Real-time information enables consumers to track and monitor the energy usage, accurate billing enhances customer satisfaction, and most importantly the payment is made timely removing the irregularities in payment as the customer becomes satisfied with the billing. Increasing deployment of smart devices empowers the provider to deploy IoT technology to support real-time information. This makes use of sensors and customer smart devices. The data is collected from the meters and sent to the meter server, which is synchronized with the consumer devices.
Lack of strong business case for the deployment of smart gas meters limiting the investment
Smart meter deployments are carried out in two modes, namely, smart metering roll-out and mandatory smart metering roll-out. In the former case, the smart meters can be deployed only after the acceptance of the consumer, while the latter removes the option of customer choice. In the former case, the major issue is the presence of a few early adopters and innovators, giving a green signal for deployment. In the latter case, the issue is with the rising demand for resources, such as a qualified labour force and high costs due to stranded investments and poor planning. Proper planning will require urban areas to be targeted first for deployments and lastly target the rural areas. In addition, the consumers do not have the trust on security and privacy of data gathered by smart metering along with the perception that they will incur additional energy costs post-deployment of smart metering infrastructure.
The smart gas metering system adoption rate has trailed behind electricity, mostly due to the lack of a strong business case. For a country to adopt smart gas metering, various factors such as a number of gas consumers and their expenditure are to be considered. The fact that demand-side management would not be feasible for gas consumers is also a setback for this market. Reduction in carbon emissions does present a good cause for deploying smart gas meters, but is difficult to quantify.
Smart Gas Market: Research Design
Scope of the Smart Gas Market Report
|
Report Metric |
Details |
|
Market size available for years |
2015�2022 |
|
Base year considered |
2016 |
|
Forecast period |
2017�2022 |
|
Forecast units |
Billion (USD) |
|
Segments covered |
Device, Solution, Service and Region. |
|
Geographies covered |
North America, APAC, Europe, Latin America, and MEA |
|
Companies covered |
ABB Group (Switzerland), Aclara Technologies LLC (U.S.), Badger Meter, Inc. (U.S.), Cap Gemini S.A. (France), CGI Group Inc. (Canada), Diehl Stiftung & Co. KG (Germany), Elster Group SE (Germany), General Electric Company (U.S.), International Business Machines Corporation (U.S.), Itron, Inc. (U.S.), Landis+Gyr Inc. (Switzerland), Oracle Corporation (U.S.), Schneider Electric SE (France), Sensus USA Inc. (U.S.), Silver Spring Networks, Inc. (U.S.), and Verizon Communications, Inc. (U.S.) |
Key Market Players
ABB Group (Switzerland), Aclara Technologies LLC (U.S.), Badger Meter, Inc. (U.S.), Cap Gemini S.A. (France), CGI Group Inc. (Canada)
Recent Developments
- In February 2017, Oracle introduced Oracle Utilities Network Management System 2.3, an expanded network management platform that enables utilities to make the transition to a customer-centric grid by giving operators real-time visibility across all grid and pipeline assets and eliminating the complexities of siloed data and applications.
- In December 2016, ABB announced to provide wireless network products and services to support the deployment of smart meters across the City of Memphis, Tennessee, in the U.S. The introduction of smart meters is expected to improve the efficiency of electricity, water, and gas supplies and mitigate loss and theft.
- In May 2016, Oracle acquired Opower, a provider of customer engagement and energy efficiency cloud services for utility. The acquisition is aimed at enabling utilities to offer modern digital customer experience.
- In February 2016, CGI launched new digital enhancements to its next-generation Pragma utility portfolio of solutions. The new digital features enable intelligent automation of critical processes in the outage management life cycle to improve decision support while providing field technicians with leading-edge mobile tools for increasing workforce productivity and customer satisfaction.
- In January 2016, GE formed a partnership with Fujitsu, a Japanese multinational information technology equipment, and services company, to bring GE's industry-leading Geographic Information System (GIS), Smallworld, to market in Japan.
Available Customizations
With the given market data, MarketsandMarkets offers customization as per the company�s specific requirements. The following customization options are available for the report:
Geographic Analysis
- Further country level breakdown of the North American smart gas market
- Further country level breakdown of the European market
- Further country level breakdown of the APAC market
- Further country level breakdown of the MEA market
- Further country level breakdown of the Latin American market
Company Information
- Detailed analysis and profiling of additional market players
Key Questions
- What are the core areas of smart gas market which are expected to generate the highest opportunity for solution vendors and system integrators?
- How is the decreasing cost of sensors and connected hardware boosting the adoption of smart water management solutions and services in emerging economies? How vendors are optimizing the opportunities generated due to increased connectivity requirement across utilities?
- How much time does it take to attain the break-even point for utilities? What steps are being taken by the utilities to overcome this challenge?
- What key development strategies are being adopted by your major competitors? How these strategies are going to re-shape the smart gas market?
To speak to our analyst for a discussion on the above findings, click Speak to Analyst
 Exclusive indicates content/data unique to MarketsandMarkets and not available with any competitors.
Table of Contents
1 Introduction
1.1 Objectives of the Study
1.2 Market Definition
1.3 Market Scope
1.4 Years Considered for the Study
1.5 Currency
1.6 Stakeholders
2 Research Methodology
2.1 Research Data
2.1.1 Secondary Data
2.1.2 Primary Data
2.1.2.1 Breakdown of Primaries
2.1.2.2 Key Industry Insights
2.2 Smart Gas Market Size Estimation
2.2.1 Bottom-Up Approach
2.2.2 Top-Down Approach
2.3 Vendor Dive Matrix Methodology
2.4 Research Assumptions and Limitations
2.4.1 Assumptions
2.4.2 Limitations
3 Executive Summary
4 Premium Insights
4.1 Attractive Market Opportunities In The Smart Gas Market
4.2 Smart Gas Market, By Region
4.3 Market, By Solution
4.4 Market, By Service
4.5 Market, By Device
4.6 Market, By Deployment Type
4.7 Market, Market Investment Scenario
5 Market Overview
5.1 Introduction
5.2 Market Dynamics
5.2.1 Drivers
5.2.2 Restraints
5.2.3 Opportunities
5.2.4 Challenges
5.3 Traditional Gas Distribution Vs Smart Gas Distribution
5.4 Smart Gas: Distribution System
5.5 Industry Use Cases
5.5.1 Use Case #1
5.5.2 Use Case #2
5.5.3 Use Case #3
5.6 Impact Of Disruptive Technologies
5.6.1 Artificial Intelligence (Ai)
5.6.2 Narrowband-Internet Of Things (Nb-Iot)
5.6.3 5G
6 Smart Gas Market, By Component
6.1 Introduction
6.2 Solutions
6.2.1 Asset Management
6.2.1.1 Asset Condition Monitoring
6.2.1.2 Asset Performance Management
6.2.2 Analytics and Data Management
6.2.2.1 Meter Data Management
6.2.2.2 Supervisory Control and Data Acquisition
6.2.3 Geographic Information System
6.2.4 Remote Monitoring
6.2.5 Outage Management
6.2.6 Network Management
6.2.7 Network and Application Security
6.2.8 Mobile Workforce Management
6.2.9 Others
6.3 Services
6.3.1 Professional Services
6.3.1.1 Consulting
6.3.1.2 Deployment and Integration
6.3.1.3 Support and Maintenance
6.3.2 Managed Services
6.4 Device
6.4.1 Amr Meters
6.4.2 Ami Meters
6.5 Connected Markets
6.5.1 Advanced Metering Infrastructure Market
6.5.2 Smart Water Management Market
6.5.3 Smart Meters Market
7 Smart Gas Market, By Deployment Type
7.1 Introduction
7.2 Cloud
7.3 On-Premises
8 Smart Gas Market, By Region
8.1 Introduction
8.2 North America
8.2.1 US
8.2.2 Canada
8.3 Europe
8.3.1 UK
8.3.2 Germany
8.3.3 Rest Of Europe
8.4 APAC
8.4.1 China
8.4.2 Japan
8.4.3 Rest Of APAC
8.5 Latin America
8.5.1 Brazil
8.5.2 Mexico
8.5.3 Rest Of Latin America
8.6 Middle East and Africa
8.6.1 KSA
8.6.2 UAE
8.6.3 Rest Of MEA
9 Competitive Landscape
9.1 Competitive Leadership Mapping
9.1.1 Visionary Leaders
9.1.2 Innovators
9.1.3 Dynamic Differentiators
9.1.4 Emerging Companies
9.2 Market Ranking Of Key Players For The Smart Gas Market
10 Company Profiles
(Introduction, Products & Services, Strategy, & Analyst Insights, Developments, MnM View) *
10.1 IBM
10.1.1 Business Overview
10.1.2 Company Snapshot
10.1.3 Financial Overview (Operating Income & R&D Expenditure, Business & Geographical Revenue Mix)
10.1.4 Products/Services Offered
10.1.5 Recent Developments
10.1.5.1 New Product Launches, 2015�2017
10.1.5.2 Business Expansions, 2015�2017
10.1.5.3 Mergers and Acquisitions/Venture Funding, 2015�2017
10.1.5.4 Agreements and Partnerships, 2015�2017
10.1.6 Swot Analysis
10.1.7 MnM View
10.2 CGI
10.2.1 Business Overview
10.2.2 Company Snapshot
10.2.3 Financial Overview (Operating Income & R&D Expenditure, Business & Geographical Revenue Mix)
10.2.4 Products/Services Offered
10.2.5 Recent Developments
10.2.5.1 New Product Launches, 2015�2017
10.2.5.2 Business Expansions, 2015�2017
10.2.5.3 Mergers and Acquisitions/Venture Funding, 2015�2017
10.2.5.4 Agreements and Partnerships, 2015�2017
10.2.6 Swot Analysis
10.2.7 MnM View
10.3 GE
10.3.1 Business Overview
10.3.2 Company Snapshot
10.3.3 Financial Overview (Operating Income & R&D Expenditure, Business & Geographical Revenue Mix)
10.3.4 Products/Services Offered
10.3.5 Recent Developments
10.3.5.1 New Product Launches, 2015�2017
10.3.5.2 Business Expansions, 2015�2017
10.3.5.3 Mergers and Acquisitions/Venture Funding, 2015�2017
10.3.5.4 Agreements and Partnerships, 2015�2017
10.3.6 Swot Analysis
10.3.7 MnM View
10.4 Oracle
10.4.1 Business Overview
10.4.2 Company Snapshot
10.4.3 Financial Overview (Operating Income & R&D Expenditure, Business & Geographical Revenue Mix)
10.4.4 Products/Services Offered
10.4.5 Recent Developments
10.4.5.1 New Product Launches, 2015�2017
10.4.5.2 Business Expansions, 2015�2017
10.4.5.3 Mergers and Acquisitions/Venture Funding, 2015�2017
10.4.5.4 Agreements and Partnerships, 2015�2017
10.4.6 Swot Analysis
10.4.7 MnM View
10.5 Itron
10.5.1 Business Overview
10.5.2 Company Snapshot
10.5.3 Financial Overview (Operating Income & R&D Expenditure, Business & Geographical Revenue Mix)
10.5.4 Products/Services Offered
10.5.5 Recent Developments
10.5.5.1 New Product Launches, 2015�2017
10.5.5.2 Business Expansions, 2015�2017
10.5.5.3 Mergers and Acquisitions/Venture Funding, 2015�2017
10.5.5.4 Agreements and Partnerships, 2015�2017
10.5.6 Swot Analysis
10.5.7 MnM View
10.6 Verizon
10.7 Schneider Electric
10.8 SAP
10.9 Diehl Stiftung & Co. Kg
10.10 ABB
10.11 Landys + Gyr
10.12 Capgemini
10.13 Elster Gas (Honeywell International)
10.14 Siemens
10.15 Wipro
10.16 Badger Meter
10.17 Aidon
10.18 Sensus
10.19 Aclara Technologies
10.20 Silver Spring Networks
*Details On Marketsandmarkets View, Introduction, Product & Services, Strategy, & Analyst Insights, New Developments Might Not Be Captured In Case Of Unlisted Companies.
11 Appendix
11.1 Discussion Guide
11.2 Knowledge Store: Marketsandmarkets Subscription Portal
11.3 Introducing Rt: Real-Time Market Intelligence
11.4 Available Customization
11.5 Related Reports
11.6 Author Details
List of Tables (157 Tables)
Table 1 United States Dollar Exchange Rate, 2014�2016
Table 2 Smart Gas Market Size, By Type, 2015�2022 (USD Million)
Table 3 Market Size By Component, 2015�2022 (USD Million)
Table 4 Market Size By Solution, 2015�2022 (USD Million)
Table 5 Solutions: Market Size By Region, 2015�2022 (USD Million)
Table 6 Asset Management: Market Size By Type, 2015�2022 (USD Million)
Table 7 Asset Management: Smart Gas Market Size By Region, 2015�2022 (USD Million)
Table 8 Asset Condition Monitoring: Market Size By Region, 2015�2022 (USD Million)
Table 9 Asset Performance Management: Market Size By Region, 2015�2022 (USD Million)
Table 10 Analytics and Data Management: Market Size By Type, 2015�2022 (USD Million)
Table 11 Analytics and Data Management: Market Size By Region, 2015�2022 (USD Million)
Table 12 Meter Data Management: Market Size, By Region, 2015�2022 (USD Million)
Table 13 Supervisory Control and Data Acquisition: Market Size By Region, 2015�2022 (USD Million)
Table 14 Geographic Information System: Smart Gas Market Size By Region, 2015�2022 (USD Million)
Table 15 Remote Monitoring: Market Size By Region, 2015�2022 (USD Million)
Table 16 Outage Management: Market Size By Region, 2015�2022 (USD Million)
Table 17 Network Management: Smart Gas Market Size By Region, 2015�2022 (USD Million)
Table 18 Network and Application Security: Market Size By Region, 2015�2022 (USD Million)
Table 19 Mobile Workforce Management: Market Size By Region, 2015�2022 (USD Million)
Table 20 Others: Market Size By Region, 2015�2022 (USD Million)
Table 21 Smart Gas Market Size By Service, 2015�2022 (USD Million)
Table 22 Services: Market Size By Region, 2015�2022 (USD Million)
Table 23 Professional Services: Market Size By Type, 2015�2022 (USD Million)
Table 24 Professional Services: Market Size By Region, 2015�2022 (USD Million)
Table 25 Consulting Services: Market Size By Region, 2015�2022 (USD Million)
Table 26 Deployment and Integration: Market Size By Region, 2015�2022 (USD Million)
Table 27 Support and Maintenance Services: Market Size By Region, 2015�2022 (USD Million)
Table 28 Managed Services: Market Size By Region, 2015�2022 (USD Million)
Table 29 Devices: Smart Gas Market Size, By Device, 2015�2022 (USD Million)
Table 30 Devices: Market Size, By Shipment, 2015�2022 (Thousand Units)
Table 31 Devices: Market Size, By Region, 2015�2022 (USD Million)
Table 32 AMR Meters: Smart Gas Market Size By Region, 2015�2022 (USD Million)
Table 33 AMR Meters: Market Size By Shipment, 2015�2022 (Thousands Units)
Table 34 AMI Meters: Market Size By Region, 2015�2022 (USD Million)
Table 35 AMI Meters: Market Size By Shipment, 2015�2022 (Thousand Units)
Table 36 Smart Gas Market Size By Deployment Type, 2015�2022 (USD Million)
Table 37 Cloud: Market Size, By Region, 2015�2022 (USD Million)
Table 38 On-Premises: Market Size By Region, 2015�2022 (USD Million)
Table 39 Smart Meters: Advanced Metering Infrastructure Shipment, By Meter Type, 2013�2020 (Thousand Units)
Table 40 Smart Meters: Advanced Metering Infrastructure Market Size, By Meter Type, 2013�2020 (USD Million)
Table 41 Smart Meters: Advanced Metering Infrastructure Shipment, By Region, 2013�2020 (Thousand Units)
Table 42 Smart Meters: Advanced Metering Infrastructure Market Size, By Region, 2013�2020 (USD Million)
Table 43 Smart Electric Meters Shipment, By Region, 2013�2020 (Thousand Units)
Table 44 Smart Electric Meters Market Size, By Region, 2013�2020 (USD Million)
Table 45 Smart Water Meters Shipment, By Region, 2013�2020 (Thousand Units)
Table 46 Smart Water Meters Market Size, By Region, 2013�2020 (USD Million)
Table 47 Smart Gas Meters Shipment, By Region, 2013�2020 (Thousand Units)
Table 48 Smart Gas Meters Market Size, By Region, 2013�2020 (USD Million)
Table 49 Solutions: Market Size, By Type 2013�2020 (USD Million)
Table 50 Solutions: Market Size, By Region, 2013�2020 (USD Million)
Table 51 Meter Data Management: Market Size, By Region, 2013�2020 (USD Million)
Table 52 Meter Data Analytics: Market Size, By Region, 2013�2020 (USD Million)
Table 53 Advanced Metering Infrastructure Security: Market Size, By Region, 2013�2020 (USD Million)
Table 54 Meter Communication Infrastructure: Market Size, By Region, 2013�2020 (USD Million)
Table 55 Advanced Water Meters: Market Size, By Component, 2014-2021 (USD Million)
Table 56 Advanced Water Meter: Market Size, By Region, 2014-2021 (USD Million)
Table 57 Advanced Water Meter Shipment, By Region, 2014-2021, (Thousand Units)
Table 58 Advanced Water Meter: Market Size, By Type, 2014-2021 (Thousand Units)
Table 59 Amr Water Meter Shipment: Market Size, By Region, 2014-2021 (Thousand Units)
Table 60 Ami Water Meter Shipment: Market Size, By Region, 2014-2021 (Thousand Units)
Table 61 Advanced Water Meter: Market Size, By Meter Read Technology, 2014-2021 (Thousand Units)
Table 62 Fixed Network Advanced Water Meter Shipments Market Size, By Region, 2014-2021 (Thousand Units)
Table 63 Cellular Network Advanced Water Meter Shipments Market Size, By Region, 2014-2021 (Thousand Units)
Table 64 Global Smart Water Management Market Size, By Solution, 2014-2021 (USD Million)
Table 65 Solutions: Market Size, By Region, 2014-2021 (USD Million)
Table 66 Enterprise Asset Management For Water and Wastewater Utilities Market Size, By Region, 2014-2021 (USD Million)
Table 67 Network Monitoring Market Size, By Region, 2014-2021 (USD Million)
Table 68 Advanced Pressure Management Market Size, By Region, 2014-2021 (USD Million)
Table 69 Scada Systems Market Size, By Region, 2014-2021 (USD Million)
Table 70 Advanced Analytics Market Size, By Region, 2014-2021 (USD Million)
Table 71 Meter Data Management Market Size, By Region, 2014-2021 (USD Million)
Table 72 Residential Water Efficiency Market Size, By Region, 2014-2021 (USD Million)
Table 73 Smart Irrigation Management Market Size, By Region, 2014-2021 (USD Million)
Table 74 Market, By Type, 2015�2022 (USD Million)
Table 75 Smart Electric Meter: Market Size, By Region, 2015�2022 (USD Million)
Table 76 Smart Water Meter: Market Size, By Region, 2015�2022 (USD Million)
Table 77 Smart Gas Meter: Market Size, By Region, 2015�2022 (USD Million)
Table 78 Global Market Size, By Application, 2015�2022 (USD Million)
Table 79 Residential: Market Size, By Region, 2015�2022 (USD Million)
Table 80 Commercial: Market Size, By Region, 2015�2022 (USD Million)
Table 81 Industrial: Market Size, By Region, 2015�2022 (USD Million)
Table 82 Market, By Technology, 2015�2022 (USD Million)
Table 83 Automatic Meter Reading: Market Size, By Region, 2015�2022 (USD Million)
Table 84 Advanced Metering Infrastructure: Market Size, By Region, 2015�2022 (USD Million)
Table 85 Smart Gas Market Size By Region, 2015�2022 (USD Million)
Table 86 North America: Market Size By Component 2015�2022 (USD Million)
Table 87 North America: Smart Gas Market Size By Solution, 2015�2022 (USD Million)
Table 88 North America: Asset Management Solution Market Size, By Type, 2015�2022 (USD Million)
Table 89 North America: Analytics and Data Management Solution Market Size, By Type, 2015�2022 (USD Million)
Table 90 North America: Smart Gas Market Size By Service, 2015�2022 (USD Million)
Table 91 North America: Smart Gas Professional Services Market Size, By Type, 2015�2022 (USD Million)
Table 92 North America: Smart Gas Market Size By Device, 2015�2022 (USD Million)
Table 93 North America: Market Size By Shipment, 2015�2022 (Thousand Units)
Table 94 North America: Smart Gas Market Size By Deployment Type, 2015�2022 (USD Million)
Table 95 US: Market Size By Component 2015�2022 (USD Million)
Table 96 US: Smart Gas Market Size By Solution, 2015�2022 (USD Million)
Table 97 US: Asset Management Solution Market Size, By Type, 2015�2022 (USD Million)
Table 98 US: Analytics and Data Management Solution Market Size, By Type, 2015�2022 (USD Million)
Table 99 US: Smart Gas Market Size By Service, 2015�2022 (USD Million)
Table 100 US: Smart Gas Professional Services Market Size, By Type, 2015�2022 (USD Million)
Table 101 US: Smart Gas Market Size By Device, 2015�2022 (USD Million)
Table 102 US: Market Size By Shipment, 2015�2022 (Thousand Units)
Table 103 US: Smart Gas Market Size By Deployment Type, 2015�2022 (USD Million)
Table 104 Canada: Market Size By Component 2015�2022 (USD Million)
Table 105 Canada: Smart Gas Market Size By Solution, 2015�2022 (Canada Million)
Table 106 Canada: Asset Management Solution Market Size, By Type, 2015�2022 (USD Million)
Table 107 Canada: Analytics and Data Management Solution Market Size, By Type, 2015�2022 (Canadad Million)
Table 108 Canada: Smart Gas Market Size By Service, 2015�2022 (USD Million)
Table 109 Canada: Smart Gas Professional Services Market Size, By Type, 2015�2022 (USD Million)
Table 110 Canada: Smart Gas Market Size By Device, 2015�2022 (USD Million)
Table 111 Canada: Market Size By Shipment, 2015�2022 (Thousand Units)
Table 112 Canada: Smart Gas Market Size By Deployment Type, 2015�2022 (USD Million)
Table 113 Europe: Market Size By Component, 2015�2022 (USD Million)
Table 114 Europe: Smart Gas Market Size By Solution, 2015�2022 (USD Million)
Table 115 Europe: Asset Management Market Size, By Type, 2015�2022 (USD Million)
Table 116 Europe: Analytics and Data Management Market Size, By Type, 2015�2022 (USD Million)
Table 117 Europe: Smart Gas Market Size By Service, 2015�2022 (USD Million)
Table 118 Europe: Professional Services Market Size, By Type, 2015�2022 (USD Million)
Table 119 Europe: Market Size By Device, 2015�2022 (USD Million)
Table 120 Europe: Market Size By Shipment, 2015�2022 (Thousand Units)
Table 121 Europe: Smart Gas Market Size By Deployment Type, 2015�2022 (USD Million)
Table 122 UK: Market Size By Component, 2015�2022 (USD Million)
Table 123 UK: Smart Gas Market Size By Solution, 2015�2022 (USD Million)
Table 124 UK: Asset Management Market Size, By Type, 2015�2022 (USD Million)
Table 125 UK: Analytics and Data Management Market Size, By Type, 2015�2022 (USD Million)
Table 126 UK: Smart Gas Market Size By Service, 2015�2022 (USD Million)
Table 127 UK: Professional Services Market Size, By Type, 2015�2022 (USD Million)
Table 128 UK: Market Size By Device, 2015�2022 (USD Million)
Table 129 UK: Market Size By Shipment, 2015�2022 (Thousand Units)
Table 130 UK: Smart Gas Market Size By Deployment Type, 2015�2022 (USD Million)
Table 131 Asia-Pacific: Smart Gas Market Size By Type, 2015�2022 (USD Million)
Table 132 Asia-Pacific: Market Size By Solution, 2015�2022 (USD Million)
Table 133 Asia-Pacific: Asset Management Solution Market Size, By Type, 2015�2022 (USD Million)
Table 134 Asia-Pacific: Analytics and Data Management Solution Market Size, By Type, 2015�2022 (USD Million)
Table 135 Asia-Pacific: Smart Gas Market Size By Service 2015�2022 (USD Million)
Table 136 Asia-Pacific: Professional Services Market Size, By Type, 2015�2022 (USD Million)
Table 137 Asia-Pacific: Market Size By Device, 2015�2022 (USD Million)
Table 138 Asia-Pacific: Market Size By Shipment, 2015�2022 (Thousand Units)
Table 139 Asia Pacific: Smart Gas Market Size By Deployment Type, 2015�2022 (USD Million)
Table 140 Middle East and Africa: Smart Gas Market Size By Type, 2015�2022 (USD Million)
Table 141 Middle East and Africa: Market Size By Solution, 2015�2022 (USD Million)
Table 142 Middle East and Africa: Asset Management Solution Market Size, By Type, 2015�2022 (USD Million)
Table 143 Middle East and Africa: Analytics and Data Management Solution Market Size, By Type, 2015�2022 (USD Million)
Table 144 Middle East and Africa: Smart Gas Market Size By Service, 2015�2022 (USD Million)
Table 145 Middle East and Africa: Professional Services Market Size, By Type, 2015�2022 (USD Million)
Table 146 Middle East and Africa: Market Size By Device, 2015�2022 (USD Million)
Table 147 Middle East and Africa: Market Size By Shipment, 2015�2022 (Thousand Units)
Table 148 Middle East and Africa: Smart Gas Market Size By Deployment Type, 2015�2022 (USD Million)
Table 149 Latin America: Market Size By Type, 2015�2022 (USD Million)
Table 150 Latin America: Smart Gas Market Size By Solution, 2015�2022 (USD Million)
Table 151 Latin America: Asset Management Solution Market Size, By Type, 2015�2022 (USD Million)
Table 152 Latin America: Analytics and Data Management Solution Market Size, By Type, 2015�2022 (USD Million)
Table 153 Latin America: Market Size By Service, 2015�2022 (USD Million)
Table 154 Latin America: Professional Services Market Size, By Type, 2015�2022 (USD Million)
Table 155 Latin America: Smart Gas Market Size By Device, 2015�2022 (USD Million)
Table 156 Latin America: Market Size By Shipment, 2015�2022 (Thousand Units)
Table 157 Latin America: Smart Gas Market Size By Deployment Type, 2015�2022 (USD Million)
List Of Figures (81 Figures)
Figure 1 Global Smart Gas Market Segmentation
Figure 2 Global Market: Research Design
Figure 3 Data Triangulation
Figure 4 Market Size Estimation Methodology: Bottom-Up Approach
Figure 5 Market Size Estimation Methodology: Top-Down Approach
Figure 6 Vendor Dive Matrix: Criteria Weightage
Figure 7 North America Is Estimated To Hold The Largest Market Share In 2017
Figure 8 Fastest Growing Segments Of The Smart Gas Market
Figure 9 Government Initiatives Offer Attractive Market Opportunities
Figure 10 Solutions Segment Is Estimated To Hold The Largest Market Share In 2017
Figure 11 Asset Management Solution Is Estimated To Hold The Largest Market Share In 2017
Figure 12 Professional Services Segment Is Estimated To Hold The Largest Market Share In 2017
Figure 13 AMR Meters Segment Is Estimated To Hold The Largest Market Share In Smart Gas Market In 2017
Figure 14 On-Premises Segment Is Estimated To Hold The Largest Market Share In 2017
Figure 15 North America Is Estimated To Hold The Largest Market Size In 2017
Figure 16 The Smart Gas Market Has Immense Opportunities For Growth In The Asia-Pacific Region
Figure 17 Smart Gas: Distribution System Diagram
Figure 18 Market: Drivers, Restraints, Opportunities, and Challenges
Figure 19 Solutions Segment Is Expected To Have The Largest Market Size In The Market During The Forecast Period
Figure 20 Asset Management Segment To Have The Largest Market Size In The Smart Gas Market By Solution In 2017
Figure 21 AMR Meters Segment Is Expected To Have The Largest Market Size In The Market By Platform During The Forecast Period
Figure 22 Professional Services Segment To Have The Largest Market Size In The Smart Gas Market By Service During The Forecast Period
Figure 23 North America To Be The Leading Region In Terms Of Market Size During The Forecast Period
Figure 24 Asia-Pacific: Hot Spot For The Smart Gas Market During The Forecast Period
Figure 25 North America Snapshot
Figure 26 Asia-Pacific Snapshot
Figure 27 Dive Chart (For 25 Companies)
Figure 28 International Business Machines Corporation: Company Snapshot (2016)
Figure 29 International Business Machines Corporation: Product Offering Scorecard
Figure 30 International Business Machines Corporation: Business Strategy Scorecard
Figure 31 CGI Group Inc.: Company Snapshot (2016)
Figure 32 CGI Group Inc.: Product Offering Scorecard
Figure 33 CGI Group Inc.: Business Strategy Scorecard
Figure 34 General Electric Company: Company Snapshot (2016)
Figure 35 General Electric Company: Product Offering Scorecard
Figure 36 General Electric Company: Business Strategy Scorecard
Figure 37 Oracle Corporation: Company Snapshot (2015)
Figure 38 Oracle Corporation: Product Offering Scorecard
Figure 39 Oracle Corporation: Business Strategy Scorecard
Figure 40 Itron, Inc.: Company Snapshot (2015)
Figure 41 Itron, Inc.: Product Offering Scorecard
Figure 42 Itron, Inc.: Business Strategy Scorecard
Figure 43 Schneider Electric SE: Company Snapshot (2016)
Figure 44 Schneider Electric Se: Product Offering Scorecard
Figure 45 Schneider Electric Se: Business Strategy Scorecard
Figure 46 Elster Group Se: Company Snapshot (2015)
Figure 47 Elster Group Se: Product Offering Scorecard
Figure 48 Elster Group Se: Business Strategy Scorecard
Figure 49 Cap Gemini SA: Company Snapshot (2015)
Figure 50 Cap Gemini SA: Product Offering Scorecard
Figure 51 Cap Gemini SA: Business Strategy Scorecard
Figure 52 Landis+Gyr Inc.: Company Snapshot (2015)
Figure 53 Landis+Gyr Inc.: Product Offering Scorecard
Figure 54 Landis+Gyr Inc.: Business Strategy Scorecard
Figure 55 ABB Group: Company Snapshot (2016)
Figure 56 ABB Group: Product Offering Scorecard
Figure 57 ABB Group: Business Strategy Scorecard
Figure 58 Sensus USA Inc.: Product Offering Scorecard
Figure 59 Sensus USA Inc.: Business Strategy Scorecard
Figure 60 Verizon Communications, Inc.: Company Snapshot (2016)
Figure 61 Verizon Communications, Inc.: Product Offering Scorecard
Figure 62 Verizon Communications, Inc.: Business Strategy Scorecard
Figure 63 Aclara Technologies Llc: Product Offering Scorecard
Figure 64 Aclara Technologies Llc: Business Strategy Scorecard
Figure 65 Siemens Ag: Company Snapshot (2016)
Figure 66 Siemens Ag: Product Offering Scorecard
Figure 67 Siemens Ag: Business Strategy Scorecard
Figure 68 Wipro Ltd: Company Snapshot (2016)
Figure 69 Wipro Ltd.: Product Offering Scorecard
Figure 70 Wipro Ltd: Business Strategy Scorecard
Figure 71 Badger Meter, Inc.: Company Snapshot (2016)
Figure 72 Badger Meter, Inc.: Product Offering Scorecard
Figure 73 Badger Meter, Inc.: Business Strategy Scorecard
Figure 74 Aidon: Product Offering Scorecard
Figure 75 Aidon: Business Strategy Scorecard
Figure 76 Silver Spring Networks, Inc.: Company Snapshot (2016)
Figure 77 Silver Spring Networks, Inc.: Product Offering Scorecard
Figure 78 Silver Spring Networks, Inc.: Business Strategy Scorecard
Figure 79 Diehl Stiftung & Co. Kg: Company Snapshot (2016)
Figure 80 Diehl Stiftung & Co. Kg: Product Offering Scorecard
Figure 81 Diehl Stiftung & Co. Kg: Business Strategy Scorecard


Growth opportunities and latent adjacency in Smart Gas Market