Radar Simulator Market by Product (System Testing, Operator Training), Application (Commercial, Military), Component (Hardware, Software), and Region - Global Forecast to 2022


The radar simulator market is projected to grow from USD 2.21 Billion in 2016 to USD 2.85 Billion by 2022, at a CAGR of 4.36% from 2017 to 2022. The objective of this study is to analyze, define, describe, and forecast the radar simulator market based on product, application, component, and region. The report also focuses on the competitive landscape of this market by profiling companies based on their financial position, product portfolio, growth strategies, and analyzing their core competencies and market share to anticipate the degree of competition prevailing in the market. This report also tracks and analyzes competitive developments, such as partnerships, mergers & acquisitions, new product developments, and Research & Development (R&D) activities in the market. The base year considered for this study is 2016 and the forecast period is from 2017 to 2022.
The radar simulator market is projected to grow from an estimated USD 2.31 Billion in 2017 to USD 2.85 Billion by 2022, at a CAGR 4.36% from 2017 to 2022. The increasing affordability of radar simulators over live training is expected to drive the market. Another key factor that is going to influence this market is the emergence of modern warfare systems.
The radar simulator market has been segmented on the basis of product, application, component, and region. Based on product, the radar simulator market has been segmented into system testing and operator training. The operator training is going to lead the market due to the increasing demand in many applications such as navigation, search, weather monitoring, surveillance, fire control, and mission rehearsal, among others. For airborne applications, radar simulator is used for training commercial as well as fighter pilots and radar operators. For marine and ground applications, radar simulator is used in training centers for training Electronic Warfare (EW) personnel.
Based on application, the military segment is estimated to be the fastest-growing segment of the radar simulator market. This is mainly attributed to the emergence of modern warfare systems such as electronic warfare and network-centric warfare which require radar simulators for their functional testing. Another factor that contributed to the high growth of this segment is the demand for skilled and trained military personnel.
Based on component, the radar simulator market has been segmented into hardware and software. The hardware segment is estimated to be the fastest-growing segment in the radar simulator market. The increased complexity in simulating various real-time scenarios with the need to provide best learning for operators contributes to the dominance of this segment. Another factor that is boosting its demand is the simulation of various warfare scenarios, which requires imitating radar hardware.
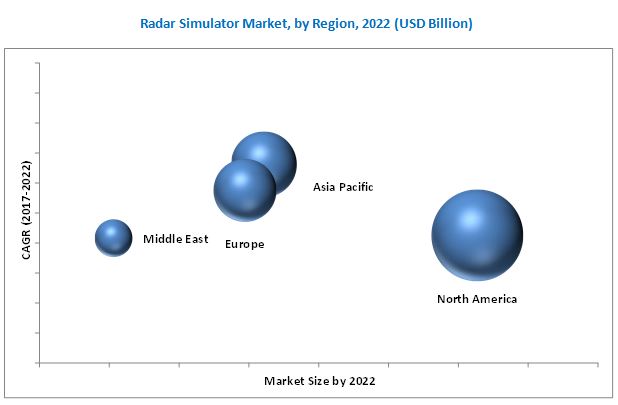
The radar simulator market has been studied for North America, Europe, Asia Pacific, Middle East, and Rest of the World (RoW). The North American region is estimated to be the largest market for radar simulators in 2017. Countries in this region include the US and Canada. The presence of some of the major radar simulator manufacturers in this region, such as Buffalo Computer Graphics (US), Cambridge Pixel Ltd (US), Harris Corporation (US), Mercury Systems, Inc. (US), Rockwell Collins (US), Textron Systems (US), and Presagis Canada Inc. (Canada), among others, contributes to the growth of the radar simulator market in North America.
High cost incurred in the development of radar systems acts as one of the major restraints for the radar simulator market. Major companies profiled in the report include Adacel Technologies Limited (Australia), ARI Simulation (India), AceWavetech (South Korea), Buffalo Computer Graphics (US), Cambridge Pixel Ltd (US), Harris Corporation (US), Mercury Systems, Inc. (US), Rockwell Collins (US), Ultra Electronics Inc. (UK), Textron Systems (US), Presagis Canada Inc. (Canada), and Micro Nav Limited (UK), among others. New product launch and supply contract were the key strategies adopted by leading players in the radar simulator market from 2012 to 2017. These strategies have enabled companies to strengthen their position in the market.
To speak to our analyst for a discussion on the above findings, click Speak to Analyst
 Exclusive indicates content/data unique to MarketsandMarkets and not available with any competitors.
Table of Contents
1 Introduction (Page No. - 15)
1.1 Objectives of the Study
1.2 Market Definition
1.3 Study Scope
1.3.1 Markets Covered
1.3.2 Geographic Scope
1.3.3 Years Considered for the Study
1.4 Currency & Pricing
1.5 Distribution Channel Participants
1.6 Limitations
1.7 Market Stakeholders
2 Research Methodology (Page No. - 19)
2.1 Research Data
2.1.1 Secondary Data
2.1.1.1 Secondary Sources
2.1.2 Primary Data
2.1.2.1 Primary Sources
2.1.2.2 Breakdown of Primaries
2.2 Market Size Estimation
2.2.1 Bottom-Up Approach
2.2.2 Top-Down Approach
2.3 Data Triangulation
2.4 Research Assumptions
3 Executive Summary (Page No. - 27)
4 Premium Insights (Page No. - 33)
4.1 Attractive Opportunities in the Radar Simulator Market
4.2 Radar Simulator Market, By Operator Training Segment
4.3 North America: Market, By Product
4.4 Market, By Military Segment
4.5 Market, By Region
5 Market Overview (Page No. - 36)
5.1 Introduction
5.2 Market Segmentation
5.2.1 Radar Simulator Market, By Product
5.2.2 Market, By Application
5.2.3 Market, By Component
5.2.4 Market, By Region
5.3 Market Dynamics
5.3.1 Drivers
5.3.1.1 Emergence of Modern Warfare Systems
5.3.1.2 Affordability of Simulator Training
5.3.1.3 Increased Investments in R&D By Automotive Industry
5.3.2 Restraints
5.3.2.1 High Cost of Radar Systems
5.3.3 Opportunities
5.3.3.1 Development of Autonomous Vehicle Technology
5.3.3.2 Demand for Skilled and Trained Operators
5.3.3.3 Increasing R&D Activities in the Field of Military Simulation
5.3.3.4 Increasing Defense Expenditure in Emerging Economies
5.3.4 Challenges
5.3.4.1 Challenges to Develop Customer Centric Products
5.3.4.2 Lack of Interoperability
5.3.4.3 Complexity of Radar Simulator
6 Industry Trends (Page No. - 45)
6.1 Introduction
6.2 Industry Trends
6.2.1 Hardware-In-The-Loop (HIL) Simulation
6.2.2 Geographic Information System (GIS) Tools
6.2.3 3D Simulation
6.2.4 Programmable Radar Simulators
6.3 Application Areas of Radar Simulator
6.4 Innovations and Patent Registrations
7 Radar Simulator Market, By Product (Page No. - 50)
7.1 Introduction
7.2 System Testing
7.2.1 Fixed
7.2.2 Portable
7.3 Operator Training
7.3.1 Fixed
7.3.2 Portable
8 Radar Simulator Market, By Application (Page No. - 55)
8.1 Introduction
8.2 Military
8.2.1 Airborne
8.2.2 Marine
8.2.3 Ground
8.3 Commercial
8.3.1 Airborne
8.3.2 Marine
8.3.3 Ground
9 Radar Simulator Market, By Component (Page No. - 61)
9.1 Introduction
9.2 Hardware
9.3 Software
10 Regional Analysis (Page No. - 64)
10.1 Introduction
10.2 North America
10.2.1 By Product
10.2.2 By Application
10.2.3 By Country
10.2.3.1 US
10.2.3.1.1 By Product
10.2.3.1.2 By Application
10.2.3.2 Canada
10.2.3.2.1 By Product
10.2.3.2.2 By Application
10.3 Europe
10.3.1 By Product
10.3.2 By Application
10.3.3 By Country
10.3.3.1 Russia
10.3.3.1.1 By Product
10.3.3.1.2 By Application
10.3.3.2 Germany
10.3.3.2.1 By Product
10.3.3.2.2 By Application
10.3.3.3 UK
10.3.3.3.1 By Product
10.3.3.3.2 By Application
10.3.3.4 France
10.3.3.4.1 By Product
10.3.3.4.2 By Application
10.3.3.5 Italy
10.3.3.5.1 By Product
10.3.3.5.2 By Application
10.3.3.6 Turkey
10.3.3.6.1 By Product
10.3.3.6.2 By Application
10.4 Asia Pacific
10.4.1 By Product
10.4.2 By Application
10.4.3 By Country
10.4.3.1 China
10.4.3.1.1 By Product
10.4.3.1.2 By Application
10.4.3.2 Japan
10.4.3.2.1 By Product
10.4.3.2.2 By Application
10.4.3.3 India
10.4.3.3.1 By Product
10.4.3.3.2 By Application
10.4.3.4 South Korea
10.4.3.4.1 By Product
10.4.3.4.2 By Application
10.4.3.5 Australia
10.4.3.5.1 By Product
10.4.3.5.2 By Application
10.5 Middle East
10.5.1 By Product
10.5.2 By Application
10.5.3 By Country
10.5.3.1 Saudi Arabia
10.5.3.1.1 By Product
10.5.3.1.2 By Application
10.5.3.2 UAE
10.5.3.2.1 By Product
10.5.3.2.2 By Application
10.5.3.3 Israel
10.5.3.3.1 By Product
10.5.3.3.2 By Application
10.6 Rest of the World (RoW)
10.6.1 By Product
10.6.2 By Application
10.6.3 By Country
10.6.3.1 Brazil
10.6.3.1.1 By Product
10.6.3.1.2 By Application
10.6.3.2 South Africa
10.6.3.2.1 By Product
10.6.3.2.2 By Application
10.6.3.3 Argentina
10.6.3.3.1 By Product
10.6.3.3.2 By Application
10.6.3.4 Mexico
10.6.3.4.1 By Product
10.6.3.4.2 By Application
11 Competitive Landscape (Page No. - 100)
11.1 Introduction
11.2 Competitive Leadership Mapping
11.2.1 Visionary Leaders
11.2.2 Innovators
11.2.3 Dynamic Differentiators
11.2.4 Emerging Companies
11.3 Competitive Benchmarking
11.3.1 Strength of Product Portfolio (25 Companies)
11.3.2 Business Strategy Excellence (25 Companies)
*Top 25 companies analysed for this study are - Adacel Technologies Limited (Australia), ARI Simulation (India), AceWavetech (South Korea), BUFFALO COMPUTER GRAPHICS (US), Cambridge Pixel Ltd. (US), Harris Corporation (US), Mercury Systems, Inc. (US), Rockwell Collins (US), Ultra Electronics Inc. (UK), Textron Systems (US), Presagis Canada Inc. (Canada), Micro Nav Limited (UK), Keysight Technologies (US), Nautical Software.com (UK), IFAD TS A/S (Denmark), Digilogic Systems Pvt. Ltd. (India), ECS Federal, LLC (US), Selex ES Inc (Italy), RODALE ELECTRONICS, INC. (US), Azachorok Contract Services, LLC. (US), General Atomics (US), Hi-Tech Bangla, Inc. (US), Kongsberg Gruppen (Norway), ROHDE & SCHWARZ (Germany), and Link Microtek Ltd UK (UK)
12 Company Profiles (Page No. - 104)
(Overview, Strength of Product Portfolio Business Strategy Excellence Products Offering, Recent Development’s, Business Strategy)*
12.1 Adacel Technologies Limited
12.2 ARI Simulation
12.3 Acewavetech
12.4 BUFFALO COMPUTER GRAPHICS
12.5 Cambridge Pixel Ltd.
12.6 Harris Corporation
12.7 Mercury Systems, Inc.
12.8 Rockwell Collins
12.9 Textron Systems Corporation
12.10 Ultra Electronics Inc.
*Details on Overview, Strength of Product Portfolio Business Strategy Excellence Products Offering, Recent Development’s, Business Strategy Might Not Be Captured in Case of Unlisted Companies.
13 Appendix (Page No. - 130)
13.1 Discussion Guide
13.2 Knowledge Store: Marketsandmarkets’ Subscription Portal
13.3 Introducing RT: Real-Time Market Intelligence
13.4 Available Customizations
13.5 Related Reports
13.6 Author Details
List of Tables (69 Tables)
Table 1 Application Areas of Radar Simulators Offered By Major Players
Table 2 Innovations and Patent Registrations, 2000-2012
Table 3 Radar Simulators Market Size, By Product, 2015-2022 (USD Million)
Table 4 System Testing Segment, By Type, 2015-2022 (USD Million)
Table 5 System Testing Segment, By Region, 2015-2022 (USD Million)
Table 6 Operator Training Segment, By Type, 2015-2022 (USD Million)
Table 7 Operator Training Segment, By Region, 2015-2022 (USD Million)
Table 8 Market Size, By Application, 2015-2022 (USD Million)
Table 9 Market in Military Application, By Subsegment, 2015-2022 (USD Million)
Table 10 Market in Military Application, By Region, 2015-2022 (USD Million)
Table 11 Market in Commercial Application, By Subsegment, 2015-2022 (USD Million)
Table 12 Market in Commercial Application, By Region, 2015-2022 (USD Million)
Table 13 Market Size, By Component, 2015-2022 (USD Million)
Table 14 Market Size, By Region, 2015-2022 (USD Million)
Table 15 North America Radar Simulators Market Size, By Product, 2015–2022 (USD Million)
Table 16 North America Market Size, By Application, 2015–2022 (USD Million)
Table 17 North America Market Size, By Country, 2015-2022 (USD Million)
Table 18 US Radar Simulators Market Size, By Product, 2015–2022 (USD Million)
Table 19 US Market Size, By Application, 2015–2022 (USD Million)
Table 20 Canada Radar Simulators Market Size, By Product, 2015–2022 (USD Million)
Table 21 Canada Market Size, By Application, 2015–2022 (USD Million)
Table 22 Europe Radar Simulators Market Size, By Product, 2015–2022 (USD Million)
Table 23 Europe Market Size, By Application, 2015–2022 (USD Million)
Table 24 Europe Market Size, By Country, 2015-2022 (USD Million)
Table 25 Russia Market Size, By Product, 2015–2022 (USD Million)
Table 26 Russia Market Size, By Application, 2015–2022 (USD Million)
Table 27 Germany Market Size, By Product, 2015–2022 (USD Million)
Table 28 Germany Market Size, By Application, 2015–2022 (USD Million)
Table 29 UK Market Size, By Product, 2015–2022 (USD Million)
Table 30 UK Market Size, By Application, 2015–2022 (USD Million)
Table 31 France Radar Simulators Market Size, By Product, 2015–2022 (USD Million)
Table 32 France Radar Simulators Market Size, By Application, 2015–2022 (USD Million)
Table 33 Italy Market Size, By Product, 2015–2022 (USD Million)
Table 34 Italy Market Size, By Application, 2015–2022 (USD Million)
Table 35 Turkey Market Size, By Product, 2015–2022 (USD Million)
Table 36 Turkey Market Size, By Application, 2015–2022 (USD Million)
Table 37 Asia Pacific Market Size, By Product, 2015–2022 (USD Million)
Table 38 Asia Pacific Market Size, By Application, 2015–2022 (USD Million)
Table 39 Asia Pacific Market Size, By Country, 2015-2022 (USD Million)
Table 40 China Market Size, By Product, 2015–2022 (USD Million)
Table 41 China Market Size, By Application, 2015–2022 (USD Million)
Table 42 Japan Market Size, By Product, 2015–2022 (USD Million)
Table 43 Japan Market Size, By Application, 2015–2022 (USD Million)
Table 44 India Market Size, By Product, 2015–2022 (USD Million)
Table 45 India Market Size, By Application, 2015–2022 (USD Million)
Table 46 South Korea Market Size, By Product, 2015–2022 (USD Million)
Table 47 South Korea Market Size, By Application, 2015–2022 (USD Million)
Table 48 Australia Market Size, By Product, 2015–2022 (USD Million)
Table 49 Australia Market Size, By Application, 2015–2022 (USD Million)
Table 50 Middle East Market Size, By Product, 2015–2022 (USD Million)
Table 51 Middle East Market Size, By Application, 2015–2022 (USD Million)
Table 52 Middle East Market Size, By Country, 2015-2022 (USD Million)
Table 53 Saudi Arabia Market Size, By Product, 2015–2022 (USD Million)
Table 54 Saudi Arabia Market Size, By Application, 2015–2022 (USD Million)
Table 55 UAE Market Size, By Product, 2015–2022 (USD Million)
Table 56 UAE Market Size, By Application, 2015–2022 (USD Million)
Table 57 Israel Radar Simulators Market Size, By Product, 2015–2022 (USD Million)
Table 58 Israel Market Size, By Application, 2015–2022 (USD Million)
Table 59 Rest of the World Market Size, By Product, 2015–2022 (USD Million)
Table 60 Rest of the World Market Size, By Application, 2015–2022 (USD Million)
Table 61 Rest of the World Market Size, By Country, 2015-2022 (USD Million)
Table 62 Brazil Market Size, By Product, 2015–2022 (USD Million)
Table 63 Brazil Market Size, By Application, 2015–2022 (USD Million)
Table 64 South Africa Market Size, By Product, 2015–2022 (USD Million)
Table 65 South Africa Market Size, By Application, 2015–2022 (USD Million)
Table 66 Argentina Market Size, By Product, 2015–2022 (USD Million)
Table 67 Argentina Market Size, By Application, 2015–2022 (USD Million)
Table 68 Mexico Market Size, By Product, 2015–2022 (USD Million)
Table 69 Mexico Market Size, By Application, 2015–2022 (USD Million)
List of Figures (45 Figures)
Figure 1 Radar Simulators Market: Markets Covered
Figure 2 Years Considered for the Study
Figure 3 Research Process Flow
Figure 4 Radar Simulators Market: Research Design
Figure 5 Breakdown of Primary Interviews: By Company Type, Designation, & Region
Figure 6 Market Size Estimation Methodology: Bottom-Up Approach
Figure 7 Market Size Estimation Methodology: Top-Down Approach
Figure 8 Data Triangulation
Figure 9 Assumptions of the Research Study
Figure 10 Radar Simulators Market, By Application, 2017 & 2022 (USD Million)
Figure 11 The Operator Training Segment is Estimated to Lead the Radar Simulators Market in 2017
Figure 12 The Hardware Segment is Estimated to Lead the Radar Simulators Market in 2017
Figure 13 North America Projected to Be the Largest Market for Radar Simulator During the Forecast Period
Figure 14 Emergence of Modern Warfare Systems Expected to Drive the Radar Simulators Market From 2017 to 2022
Figure 15 The Fixed Subsegment is Projected to Lead the Radar Simulators Market From 2017 to 2022
Figure 16 The Operator Training Segment is Estimated to Account for A Larger Share of the Radar Simulators Market in North America in 2017
Figure 17 The Marine Subsegment of the Military Radar Simulators Market Projected to Grow at the Highest CAGR From 2017 to 2022
Figure 18 The Radar Simulators Market in Asia Pacific is Projected to Grow at the Highest CAGR From 2017 to 2022
Figure 19 Market, By Product
Figure 20 Market, By Application
Figure 21 Market, By Component
Figure 22 Market, By Region
Figure 23 Market Dynamics
Figure 24 Region-Wise Market Size of Network-Centric Warfare Systems, 2016 & 2021 (USD Million)
Figure 25 Region-Wise Market Size of Electronic Warfare Systems, 2016 & 2021 (USD Million)
Figure 26 Military Expenditure of Emerging Economies, 2012-2016 (USD Billion)
Figure 27 Radar Simulator Industry Trends
Figure 28 Benefits of Hardware-In-The-Loop (HIL) Simulation
Figure 29 Advantages of 3D Simulation
Figure 30 Types of Radar Simulated By Programmable Radar Simulators
Figure 31 The Operator Training Segment is Anticipated to Lead the Radar Simulators Market During the Forecast Period
Figure 32 The Military Segment is Anticipated to Lead the Radar Simulators Market During the Forecast Period
Figure 33 The Hardware Segment is Anticipated to Lead the Radar Simulators Market During the Forecast Period
Figure 34 The Radar Simulators Market in Asia Pacific Region is Projected to Grow at the Highest CAGR From 2017 to 2022
Figure 35 North America Market Snapshot
Figure 36 Europe Market Snapshot
Figure 37 Asia Pacific Market Snapshot
Figure 38 Middle East Market Snapshot
Figure 39 Radar Simulators Market (Global): Competitive Leadership Mapping, 2017
Figure 40 Adacel Technologies Limited: Company Snapshot
Figure 41 Harris Corporation: Company Snapshot
Figure 42 Mercury Systems, Inc.: Company Snapshot
Figure 43 Rockwell Collins: Company Snapshot
Figure 44 Textron Systems Corporation: Company Snapshot
Figure 45 Ultra Electronics Inc.: Company Snapshot
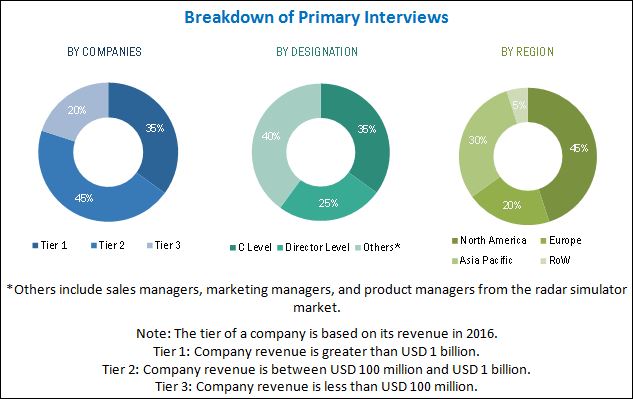
The research methodology used to estimate and forecast the radar simulator market includes the study of data and revenue of key market players through secondary resources, such as annual reports, Federal Aviation Administration (FAA), International Air Transport Association (IATA), and Stockholm International Peace Research Institute (SIPRI). The bottom-up procedure was employed to arrive at the overall size of the market from the revenue of key market players. After arriving at the overall market size, the radar simulator market was split into several segments and subsegments, which were then verified through primary research by conducting extensive interviews with key industry experts, such as CEOs, VPs, directors, executives, and engineers. These data triangulation and market breakdown procedures were employed to complete the overall market engineering process and arrive at the exact statistics for all segments and subsegments. Breakdown of profiles of primaries is shown in the figure given below:
To know about the assumptions considered for the study, download the pdf brochure
Market Ecosystem
The radar simulator market has been segmented on the basis of product, application, component, and region. Adacel Technologies Limited (Australia), ARI Simulation (India), AceWavetech (South Korea), Buffalo Computer Graphics (US), Cambridge Pixel Ltd (US), Harris Corporation (US), Mercury Systems, Inc. (US), Rockwell Collins (US), Ultra Electronics Inc. (UK), Textron Systems (US), Presagis Canada Inc. (Canada), and Micro Nav Limited (UK) are some of the manufacturers in this market. Contracts, new product launches, agreements, and acquisitions are the major strategies adopted by the key players in the market.
Target Audience for this Report
- Manufacturers of Radar Simulator
- Component Manufacturers of Radar Simulator
- Aircraft Manufacturers
- Radar Simulator Operator Training Bodies
- Government and Certification Bodies
“This study answers several questions for stakeholders, primarily, which market segments to focus on during the next two to five years to prioritize their efforts and investments.”
Scope of the Report:
Radar Simulator Market, By Product
-
System Testing
- Fixed
- Portable
-
Operator Training
- Fixed
- Portable
Radar Simulator Market, By Application
-
Military
- Airborne
- Marine
- Ground
-
Commercial
- Airborne
- Marine
- Ground
Radar Simulator Market, By Component
- Hardware
- Software
Radar Simulator Market, By Region
- North America
- Europe
- Asia Pacific
- Middle East
- Rest of the World
Available Customizations
Along with the market data, MarketsandMarkets offers customizations as per specific needs of a company. The following customization options are available for this report:
-
Geographic Analysis
- Further breakdown of the Rest of the World market
-
Company Information
- Detailed analysis and profiling of additional market players (up to five)
- Additional Level Segmentation


Growth opportunities and latent adjacency in Radar Simulator Market