Military Simulation and Training Market Size, Share & Growth Analysis

Military Simulation and Training Market by Application (Army, Aviation, Naval), Type (Live, Virtual, Constructive), Platform (Land, Maritime, Airborne), Solution, Environment (Synthetic, Gaming), Technology, and Region - Global Forecast

Report Code: AS 1125 Apr, 2022, by marketsandmarkets.com

Updated on : Oct 22, 2024

The Military Simulation and Training market is experiencing significant growth, driven by increasing demand for cost-effective and efficient training solutions across defense forces worldwide. Technological advancements, including the integration of virtual reality (VR), augmented reality (AR), and artificial intelligence (AI), are enhancing the realism and effectiveness of simulation-based training programs. These innovations allow military personnel to engage in complex, realistic scenarios without the risks and expenses associated with live training exercises. As modern warfare becomes more technology-driven, there is a growing need for advanced simulation systems to improve readiness, adaptability, and decision-making in mission-critical environments.

Military Simulation and Training Market Size & Share

The Military Simulation and Training Market SIze is projected to reach USD 12.2 billion by 2027 growing at a CAGR of 5.6% during the forecast period. Increasing defense spending in the world and new technological developments to help strengthen military capabilities and efficiency is expected to drive the market for Military Simulation and Training across the globe.

Increasing geopolitical tensions across regions and overall strengthening activities across the world is triggering the defense spending across these regions. This, in turn, is pushing manufacturers and system component providers to design and manufacture more high technology, high resolution, military simulators for defense personnel to get trained upon.
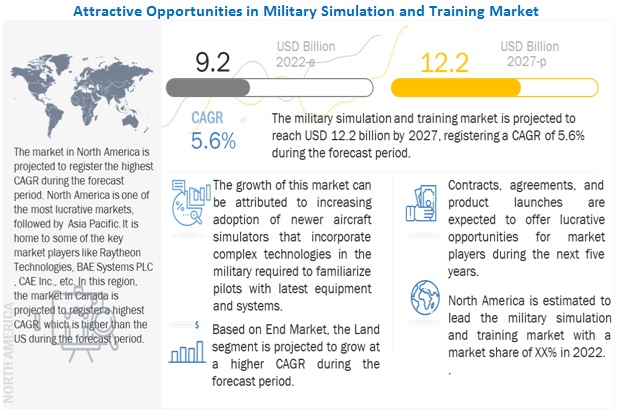
Military Simulation and Training Market

To know about the assumptions considered for the study, Request for Free Sample Report

COVID-19 impact on the Military Simulation and Training Market

The COVID-19 pandemic has caused significant damage to the economic activities of countries across the world. The manufacture of digital battlefield products, including systems, subsystems, and components, has also been impacted. Although military simulation and training products for defense applications are of prime importance, disruptions in the supply chain have halted their manufacturing processes for the time being. Resuming manufacturing activities depends on COVID-19 exposure, the level at which manufacturing operations are running, and import-export regulations, among other factors. While companies may still take orders, delivery schedules may not be fixed. Most key players in the Military Simulation and Training industry like Lockheed Martin Corporation (US), Raytheon Technologies (US) and Rheinmetall AG(Germany) have declared that business has largely be returned to normal but acknowledged the impact of cost and schedules on most programs

Military Simulation and Training Market Dynamics

Driver: Acceptance of virtual pilot training to ensure safety

Safety has been the main reason for the introduction of virtual pilot training. Virtual flight training has recently gained importance due to multiple benefits, such as effective training with a real-time view, reduced environmental impact, and cost-effectiveness. Most aircraft orientation and training are carried out with full flight simulators. Simulation-based training keeps the pilot and instructor in a low-risk environment, allows for training of impractical situations, and prevents trainees from damaging expensive aircraft. Simulators can also operate for over 20 hours per day with low carbon emissions at an operating cost 22 times lower than training pilots on an aircraft. In the case of the air force, flight simulation is prevalent for equipment-use training, such as computer-based battlefield training.

Most flight exercises have been substituted with simulation training and adopted by flight crews. The rise in fighter jets accidents results in the increasing demand for simulator-based training to ensure safer flights.

Opportunity: Development of simulators for unmanned aerial systems (UAS)

The increasing demand for unmanned systems for defense and commercial applications is expected to drive the demand for simulators. AEgis Technologies Group (US) and Havelsan Inc. (US) have introduced highly sophisticated unmanned simulators independent of hardware configurations to simulate any UAS with the help of any sensor operator and payload suite. These simulators can create a virtual battlefield in real-time, enabling ab-initio training, basic payload and flight operations, mission rehearsal, and mission planning. However, they need to be cost effective, capable of precise flight dynamics simulation, an error-tolerant control system design, and a multi-vehicle simulation with interoperability.

Challenge: Stringent regulatory approvals

Product development in the simulators market is a lengthy procedure, as it takes a significant amount of time to develop a replica of any aircraft tested. Developers of flight simulators also require approval from OEMs to develop a replica of an aircraft, which adds to the time and cost of development. Manufacturers also need to provide customer-centric products that are flexible and adaptable to the needs of customers while at the same time allowing them to cope with the changing environment of pilot training. They also need to comply with safety and regulatory management issues, making it a challenge to deliver required simulators on time.

Military Simulation and Training Market Ecosystem

Prominent companies providing Military Simulation and Training, private and small enterprises, distributors/suppliers/retailers, and end customers are the key stakeholders in Military Simulation and Training market ecosystem. Investors, funders, academic researchers, distributors, service providers, and industries also serve as major influencers in the market.
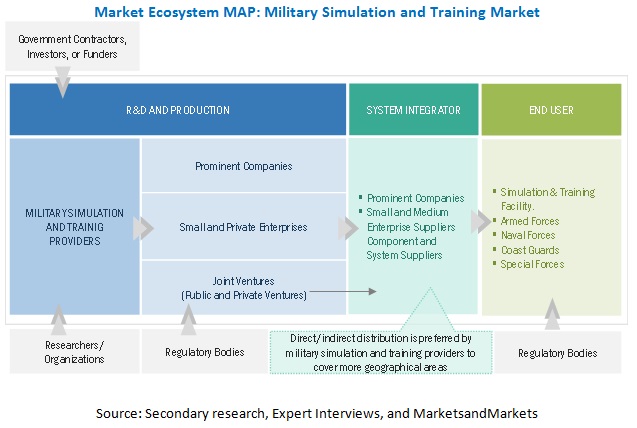
Military Simulation and Training Market

To know about the assumptions considered for the study, download the pdf brochure

Aircraft Seat Actuation System Market Segmentation Analysis

Based on platform, the land segment of the Military Simulation and Training market is projected to grow at the highest CAGR is expected to account for the largest market share during the forecasted period.

Based on platform, the land segment is expected to grow at the highest CAGR of 6.2% during the forecast period. The growth in demand for military vehicles across the land, sea, and aerial platforms would drive the market growth. Several countries are modernizing their military fleets by inducting newer generation vehicle platforms. This is generating a simultaneous demand for simulation-based training for the military personnel on these platforms, thereby propelling the market prospects of the related military simulators.

Based on Application, Aviation makes the largest share of the market during the forecasted year.

The aviation segment is expected to have a larger market share in the forecasted year. This is majorly due to the complexity and risk involved in aircraft compared to the other end users. For example, a single mistake by pilots on board a military aircraft while landing or take-off will cost the lives of people on board and result in the loss of sophisticated military property and compromise the mission. Such complexity has forced the military authorities to incorporate simulator-based training for pilots. Moreover, the increasing adoption of newer generation aircraft that incorporate complex technologies in the military may require training for pilots to familiarize themselves with the latest equipment and systems. In such situations, providing hands-on experience may be difficult due to high-cost involvement. In such cases, the simulators act as the preferred option

Regional Analysis - Aircraft Seat Actuation System Market

“North America is projected to makes the largest share of the market during the forecasted year.”

The rising orders to replace the old navy fleet with new ones from the US and Canada and the rise in export of goods are the major factors driving the demand for new ship commanders and crew. This also leads to increased demand for military training systems. According to Boeing Technician Outlook 2019, North America is anticipated to require more than 193,000 aircraft technicians and maintenance crew between 2019 and 2038. This is anticipated to fuel the demand for maintenance crew training across the region during the forecast period

This region is expected to lead the market from 2021 to 2026, owing to increased investments and the adoption of advanced military simulators for all the platforms by countries in this region. The presence of prominent manufacturers and integrators of these Military Simulation and Training, including Lockheed Martin (US), Northrop Grumman (US), L3Harris Technologies, Inc. (US), and Raytheon Technologies (US), is also expected drive the market in the region over the forecast period.

Military Simulation and Training Market by Region

Top Military Simulation and Training Companies - Key Market Players

The Military Simulation and Training Companies are dominated by a few globally established players such as Raytheon Technologies (US), Rheinmetall AG (Germany), BAE Systems (US), Lockheed Martin Corporation (US).

Military Simulation and Training Market Report Scope

Report Metric

Details

Estimated Market Size USD 9.2 Billion
Projected Market Size USD 12.2 Billion
Growth Rate 5.6%

Forecast period

2022-2027

Market size available for years

2019-2027

Base year considered

2021

Forecast units

Value (USD)

Segments covered

Based on Type, Application, Platform, Environment, Solution Technology

Geographies covered

  • North America
  • Asia Pacific
  • Europe
  • Middle East
  • Rest of the World (Africa, Latin America)

Companies covered

Raytheon Technologies (US), Rheinmetall AG (Germany), BAE Systems (US), Lockheed Martin Corporation (US).

This research report categorizes the Military Simulation and Training Market based on industry, forecasting type, purpose, organization size, and region.

Military Simulation and Training Market, By Type.

  • Live
  • Virtual
  • Constructive

By Application

  • Army
  • Aviation
  • Naval

By Platform

  • Land
  • Maritime
  • AIrborne

By Environment

  • Synthetic
  • Gaming

By Solution

  • Product
  • Services

By Technology

  • IoT
  • 5G
  • Big Data Analytics
  • Artificial Intelligence
  • Cloud Computing and Master Data Management
  • AR & VR
  • Digital Twin
  • Robotic Process Automation

By Region

  • North America
  • Europe
  • Asia Pacific
  • Middle East
  • Rest of the World (Africa & Latin America)

Recent Developments in Aircraft Seat Actuation System Market

  • In October 2021, Rheinmetall and Thales provided 20 contemporary Tiger simulators as well as servicing and maintenance support at sites in Le Luc, Fritzlar, Pau, and Phalsbourg. The 8 full-mission simulators and 12 cockpit procedure trainers enable crews to train using the latest configuration of the aircraft in service.
  • In June 2021, Varjo Technologies and SAAB AB collaborate to revolutionize flight simulators. Varjo created a mixed reality (XR) technology for integration into all Saab Gripen E/F simulators. The alliance provided several new training options at a fraction of the cost, in addition to the finest resolution and the largest field of vision in the market.
  • In August 2020, BAE Systems was granted a contract by the US Marine Corps (USMC) to produce a prototype design for a new state-of-the-art Wargaming Center built at Marine Corps Base Quantico in Virginia. Artificial intelligence, machine learning, game theory, multi-domain modeling & simulation, and predictive data analytics are integrated into the prototype for more measurements and training on numerous wargaming procedures.

Frequently Asked Questions (FAQ):

To speak to our analyst for a discussion on the above findings, click Speak to Analyst


Exclusive indicates content/data unique to MarketsandMarkets and not available with any competitors.

TABLE OF CONTENTS
 
1 INTRODUCTION (Page No. - 29)
    1.1 OBJECTIVES OF THE STUDY
    1.2 MARKET DEFINITION
    1.3 STUDY SCOPE
           FIGURE 1 MILITARY SIMULATION AND TRAINING SEGMENTATION
           1.3.1 REGIONAL SCOPE
           1.3.2 YEARS CONSIDERED FOR STUDY
    1.4 CURRENCY & PRICING
    1.5 USD EXCHANGE RATES
    1.6 LIMITATIONS
    1.7 INCLUSIONS & EXCLUSIONS
    1.8 MARKET STAKEHOLDERS
    1.9 SUMMARY OF CHANGES
 
2 RESEARCH METHODOLOGY (Page No. - 34)
    2.1 RESEARCH DATA
           FIGURE 2 MILITARY SIMULATION AND TRAINING MARKET: RESEARCH FLOW
           FIGURE 3 MARKET: RESEARCH DESIGN
           2.1.1 SECONDARY DATA
                    2.1.1.1 Key data from secondary sources
                    2.1.1.2 Key data from primary sources
           2.1.2 PRIMARY DATA
                    2.1.2.1 Key data from primary sources
    2.2 FACTOR ANALYSIS
           2.2.1 INTRODUCTION
           2.2.2 DEMAND-SIDE INDICATORS
                    2.2.2.1 Increase in conflicts and disputes globally
                    2.2.2.2 Rise in defense budgets of emerging economies
           2.2.3 SUPPLY-SIDE INDICATORS
                    2.2.3.1 Financial trends of major US defense contractors
           2.2.4 SEGMENT DEFINITIONS
                    2.2.4.1 Military simulation and training market, by type
                    2.2.4.2 market, by technology
                    2.2.4.3 market, by solution
                    2.2.4.4 market, by platform
                    2.2.4.5 market, by application
                    2.2.4.6 market, by environment
                               FIGURE 4 BREAKDOWN OF PRIMARY INTERVIEWS: BY COMPANY TYPE, DESIGNATION,  AND REGION
    2.3 RESEARCH APPROACH & METHODOLOGY
           2.3.1 BOTTOM-UP APPROACH
                    FIGURE 5 MARKET SIZE ESTIMATION METHODOLOGY: BOTTOM-UP APPROACH
           2.3.2 TOP-DOWN APPROACH
                    FIGURE 6 MARKET SIZE ESTIMATION METHODOLOGY: TOP-DOWN APPROACH
    2.4 MARKET BREAKDOWN & DATA TRIANGULATION
           FIGURE 7 DATA TRIANGULATION
           FIGURE 8 ASSUMPTIONS OF RESEARCH STUDY
    2.5 RISK ANALYSIS
 
3 EXECUTIVE SUMMARY (Page No. - 44)
    FIGURE 9 AVIATION SEGMENT PROJECTED TO DOMINATE MARKET DURING  FORECAST PERIOD
    FIGURE 10 LAND SEGMENT PROJECTED TO REGISTER HIGHEST CAGR DURING FORECASTED YEAR
    FIGURE 11 VIRTUAL SEGMENT PROJECTED TO HAVE LARGEST SHARE DURING  FORECAST PERIOD
 
4 PREMIUM INSIGHTS (Page No. - 46)
    4.1 ATTRACTIVE OPPORTUNITIES IN MILITARY SIMULATION AND TRAINING MARKET, 2022–2027
           FIGURE 12 INCREASING ADOPTION OF NEWER MILITARY AIRCRAFT SIMULATORS
    4.2  MARKET, BY AIRBORNE PLATFORM
           FIGURE 13 FIGHTER AIRCRAFT SIMULATORS TO BE IN GREATER DEMAND IN UPCOMING YEARS
    4.3  MARKET, BY COUNTRY
           FIGURE 14 MARKET IN INDIA TO REGISTER HIGHEST CAGR DURING FORECAST PERIOD
    4.4  MARKET,  BY SOLUTION TYPE
           FIGURE 15 SOFTWARE SEGMENT TO ACCOUNT HIGHEST CAGR DURING FORECAST PERIOD
 
5 MARKET OVERVIEW (Page No. - 48)
    5.1 INTRODUCTION
    5.2 MARKET DYNAMICS
           FIGURE 16 MILITARY SIMULATION AND TRAINING: MARKET DYNAMICS
           5.2.1 DRIVERS
                    5.2.1.1 Acceptance of virtual pilot training to ensure aviation safety
                               FIGURE 17 GLOBAL MILITARY AIRCRAFT ACCIDENT, 2016—2021
                    5.2.1.2 Need for cost-cutting technique in pilot training
                               FIGURE 18 COMPARISON BETWEEN REAL-TIME AND SIMULATOR-BASED TRAINING BY TOP AIRCRAFT
                    5.2.1.3 Reduction in military budgets of developed economies
                               FIGURE 19 INCREASE/DECREASE IN MILITARY SPENDING, BY REGION
           5.2.2 RESTRAINTS
                    5.2.2.1 Longer product lifecycle
                    5.2.2.2 Lack of interoperability
           5.2.3 OPPORTUNITIES
                    5.2.3.1 Development of simulators for unmanned aerial systems (UAS)
                               FIGURE 20 REGION-WISE UAS DEVELOPMENT FUNDING, 2018
                    5.2.3.2 Simulators for air accident investigation
           5.2.4 CHALLENGES
                    5.2.4.1 Stringent regulatory approvals
                    5.2.4.2 Minimization of weight and size to maintain advanced features
    5.3 RANGES AND SCENARIOS
           FIGURE 21 IMPACT OF COVID-19 ON MILITARY SIMULATION AND TRAINING MARKET: 3 GLOBAL SCENARIOS
    5.4 COVID-19 IMPACT ON MARKET
           FIGURE 22 COVID-19 IMPACT ON MARKET
           5.4.1 KEY DEVELOPMENTS FROM JANUARY 2018 TO JUNE 2021
           TABLE 1 KEY DEVELOPMENTS IN MARKET, 2018-2021
    5.5 TRENDS/DISRUPTIONS IMPACTING CUSTOMER BUSINESSES
           5.5.1 REVENUE SHIFT AND NEW REVENUE POCKETS FOR MARKET
           FIGURE 23 REVENUE SHIFT IN MILITARY SIMULATION AND TRAINING MARKET
    5.6 AVERAGE SELLING PRICE ANALYSIS OF MILITARY SIMULATION AND TRAINING, 2020
           TABLE 2 AVERAGE SELLING PRICE ANALYSIS OF MILITARY SIMULATION AND TRAINING AND SUBSYSTEMS IN 2020
    5.7 KEY CONFERENCES & EVENTS IN 2022-2023
           TABLE 3 MILITARY SIMULATION AND TRAINING MARKET: DETAILED LIST OF CONFERENCES & EVENTS
    5.8 MARKET ECOSYSTEM
           5.8.1 PROMINENT COMPANIES
           5.8.2 PRIVATE AND SMALL ENTERPRISES
           5.8.3 END USERS
                    FIGURE 24 MILITARY SIMULATION AND TRAINING MARKET ECOSYSTEM MAP
                    TABLE 4 INDUSTRY TRENDS: MARKET ECOSYSTEM
    5.9 TECHNOLOGY ANALYSIS
           5.9.1 SMART SIMULATION WITH DIGITAL TWIN
           5.9.2 SIMULATION IN IOT
           5.9.3 SMART SIMULATION WITH AUGMENTED REALITY (AR) AND VIRTUAL REALITY (VR)
    5.10 USE CASE ANALYSIS
           5.10.1 USE CASE: REMOTELY COLLABORATING ON DEFENSE PROJECTS
           5.10.2 USE CASE: MAINTAINING DEFENSE AND ENGINEERING EQUIPMENT
           5.10.3 USE CASE: MILITARY VEHICLE SIMULATION AND TRAINING
           5.10.4 USE CASE: MILITARY AIRCRAFT SIMULATION AND TRAINING
    5.11 VALUE CHAIN ANALYSIS OF MILITARY SIMULATION AND TRAINING MARKET
                    FIGURE 25 VALUE CHAIN ANALYSIS
    5.12 PORTER’S FIVE FORCES ANALYSIS
                    TABLE 5 MILITARY SIMULATION AND TRAINING MARKET: PORTER’S FIVE FORCES
           5.12.1 THREAT OF NEW ENTRANTS
           5.12.2 THREAT OF SUBSTITUTES
           5.12.3 BARGAINING POWER OF SUPPLIERS
           5.12.4 BARGAINING POWER OF BUYERS
           5.12.5 DEGREE OF COMPETITION
    5.13 KEY STAKEHOLDERS & BUYING CRITERIA
           5.13.1 KEY STAKEHOLDERS IN BUYING PROCESS
                    FIGURE 26 INFLUENCE OF STAKEHOLDERS IN BUYING PROCESS FOR TOP 3 APPLICATIONS
                    TABLE 6 INFLUENCE OF STAKEHOLDERS IN BUYING PROCESS FOR TOP 3 APPLICATIONS (%)
           5.13.2 BUYING CRITERIA
                    FIGURE 27 KEY BUYING CRITERIA FOR TOP 3 APPLICATIONS
                    TABLE 7 KEY BUYING CRITERIA FOR TOP 3 APPLICATIONS
    5.14 TARIFF AND REGULATORY LANDSCAPE
           5.14.1 REGULATORY BODIES, GOVERNMENT AGENCIES, AND OTHER ORGANIZATIONS
 
6 INDUSTRY TRENDS (Page No. - 68)
    6.1 INTRODUCTION
           TABLE 8 MAPPING OF KEY SIMULATOR MANUFACTURERS AND THEIR CORE COMPETENCY AREAS
    6.2 TECHNOLOGY TRENDS
           6.2.1 HEPATIC TECHNOLOGY (3D TOUCH)
           6.2.2 FULL COMBAT AND MISSION TRAINING IN DOME TRAINER ENVIRONMENT
           6.2.3 STANDALONE BRIDGE SIMULATION CONSOLES (FLEXICON)
           6.2.4 BLUEFIRE TECHNOLOGY
           6.2.5 MARITIME MOVABLE DESKTOP AND ECDIS SIMULATORS
           6.2.6 CAR LEARNING TO ACT (CARLA)
           6.2.7 DESKTOP DRIVING SIMULATORS
           6.2.8 SYNTHETIC TRAINING ENVIRONMENT
           6.2.9 NIGHT VISION TRAINING SYSTEMS
           6.2.10 REAL-TIME COMPUTER IMAGE GENERATION
           6.2.11 OPTIMAL MOTION-CUEING TECHNOLOGY
           6.2.12 RECONFIGURABLE FLIGHT SIMULATION AND TRAINING
           6.2.13 GLADIATOR SIMULATION PROGRAMME
    6.3 IMPACT OF MEGATRENDS
           6.3.1 UNIFIED MILITARY SIMULATION AND TRAINING SYSTEM OPERATIONS WITH COLLABORATIVE COMBAT
           6.3.2 ARTIFICIAL INTELLIGENCE ACROSS MILITARY SIMULATION AND TRAINING SYSTEM
    6.4 INNOVATIONS AND PATENT REGISTRATIONS
           TABLE 9 INNOVATIONS & PATENT REGISTRATIONS, (2016-2021)
 
7 MILITARY SIMULATION AND TRAINING MARKET, BY TYPE (Page No. - 74)
    7.1 INTRODUCTION
           FIGURE 28 VIRTUAL TYPE SEGMENT EXPECTED TO HAVE GREATER MARKET SHARE IN FORECASTED YEAR
           TABLE 10 MARKET, BY TYPE, 2019–2021 (USD MILLION)
           TABLE 11 MARKET, BY TYPE, 2022–2027 (USD MILLION)
    7.2 LIVE
           7.2.1 INCREASING DEMAND FOR COMBAT TRAINING IN WAR ZONE TO DRIVE LIVE SEGMENT
    7.3 VIRTUAL
           7.3.1 TRAINING OF HIGH-COST EQUIPMENT TO LEAD VIRTUAL MARKET
    7.4 CONSTRUCTIVE
           7.4.1 BETTER TACTICAL TRAINING DEMAND WITH UNKOWN OUTCOMES TO BOOST CONSTRUCTIVE SEGMENT
 
8 MILITARY SIMULATION AND TRAINING MARKET, BY TECHNOLOGY (Page No. - 77)
    8.1 INTRODUCTION
    8.2 ARTIFICIAL INTELLIGENCE
           8.2.1 INCREASING USE OF ARTIFICIAL INTELLIGENCE IN MILITARY DEVICES EMBEDDED WITH MULTIPLE TECHNOLOGIES TO FUEL AI SEGMENT
    8.3 3D PRINTING
           8.3.1 REDUCED PRODUCTION COSTS FOR MANUFACTURING TOOLS AND ADDITIONAL DESIGN FLEXIBILITY TO ENHANCE 3D PRINTING
    8.4 INTERNET OF THINGS
           8.4.1 DEVELOPED NEW PREDICTIVE BATTLEFIELD ANALYTICS EXPECTED TO ESCALATE MARKET GROWTH
    8.5 BIG DATA ANALYTICS
           8.5.1 DEPLOYMENT OF MACHINE LEARNING AND BIG DATA TOOLS ACROSS VARIOUS DEFENSE PLATFORMS TO DRIVE MARKET GROWTH
    8.6 ROBOTIC PROCESS AUTOMATION
           8.6.1 INTEGRATION WITH EXISTING MILITARY APPLICATIONS AND IMPROVEMENT OF OUTCOMES DURING CRITICAL MISSIONS TO INCREASE MARKET GROWTH
    8.7 CLOUD COMPUTING & MASTER DATA MANAGEMENT
           8.7.1 DEMAND FOR CLOUD COMPUTING & MASTER DATA MANAGEMENT IN DEFENSE INDUSTRY STIMULATES MARKET
    8.8 DIGITAL TWIN
           8.8.1 USE OF TIME- AND COST-SAVING DIGITAL TWIN TECHNOLOGY TO SUPPORT GROWTH OF THIS MARKET
    8.9 BLOCKCHAIN
           8.9.1 ENHANCED SECURITY FOR AUTOMATED SYSTEMS MANAGEMENT, SUPPLY CHAIN MANAGEMENT & LOGISTICS, AND INFORMATION ON BATTLEFIELD TO OPTIMIZE BLOCKCHAIN USE IN MARKET
    8.10 AR & VR
           8.10.1 USE OF AR & VR FOR NEW WARFARE STRATEGIES TO EVALUATE COMPLEXITIES ON BATTLEFIELD TO INCREASE MARKET DEMAND
    8.11 5G
           8.11.1 5G TECHNOLOGY TO TRANSFER DATA AMONG OPERATORS AND MILITARY VEHICLES TO OFFER MORE MARKET DEMAND
 
9 MILITARY SIMULATION AND TRAINING MARKET, BY SOLUTION (Page No. - 83)
    9.1 INTRODUCTION
           FIGURE 29 SOFTWARE TO RECORD HIGHEST CAGR BETWEEN 2020 AND 2025
           TABLE 12 MILITARY SIMULATION AND TRAINING MARKET, BY SOLUTION, 2019–2021 (USD MILLION)
           TABLE 13 MARKET, BY SOLUTION, 2022–2027 (USD MILLION)
    9.2 HARDWARE
           9.2.1 ONGOING IMPROVEMENTS IN COMMUNICATIONS TECHNOLOGY FOR BETTER EXPERIENCE OF VIRTUAL SIMULATORS TO FUEL SEGMENT GROWTH
    9.3 SOFTWARE
           9.3.1 GROWING DEMAND TO INTEGRATE MULTIPLE SENSORS WITH SINGLE TRAINING SYSTEM TO AMPLIFY SOFTWARE ADOPTION AND MARKET GROWTH
    9.4 SERVICES
           9.4.1 SOFTWARE UPDATE PACKAGES, NEW FEATURES AND PROGRAMS, AND ADD NEW ALGORITHMS IN TRAINING SYSTEMS TO PROPEL SERVICES
                    9.4.1.1 Upgrades
                    9.4.1.2 Maintenance & Support
 
10 MILITARY SIMULATION AND TRAINING MARKET, BY ENVIRONMENT (Page No. - 87)
     10.1 INTRODUCTION
     10.2 SYNTHETIC ENVIRONMENT
             10.2.1 SYNTHETIC ENVIRONMENT TO IMPROVE TRAINING, MISSION PLANNING, REHEARSAL, AND OPERATIONAL DECISION MAKING
     10.3 GAMING ENVIRONMENT
             10.3.1 INCREASING DEMAND FOR INTERACTIVE LEARNING PROJECTED TO FUEL ADOPTION OF GAMING SIMULATION
 
11 MILITARY SIMULATION AND TRAINING MARKET, BY PLATFORM (Page No. - 89)
     11.1 INTRODUCTION
               FIGURE 30 LAND PLATFORM TO RECORD HIGHEST CAGR BETWEEN 2022 AND 2027
               TABLE 14 MARKET, BY PLATFORM, 2019–2021 (USD MILLION)
               TABLE 15 MARKET, BY PLATFORM,  2022–2027 (USD MILLION)
     11.2 LAND
               TABLE 16 MILITARY SIMULATION AND TRAINING MARKET, BY LAND, 2019–2021 (USD MILLION)
               TABLE 17 MARKET, BY LAND, 2022–2027 (USD MILLION)
             11.2.1 MILITARY FIGHTING VEHICLES (MFV)
                       11.2.1.1 Rising demand for MFV for use in cross border conflicts
             11.2.2 UNMANNED GROUND VEHICLES (UGVS)
                       11.2.2.1 Increasing demand for self-driven ground vehicles embedded with advanced military equipment and technologies
             11.2.3 HEADQUARTERS AND COMMAND CENTERS
                       11.2.3.1 Growing need for cybersecurity to protect headquarters and command centers
             11.2.4 PLATFORM INDEPENDENT
                       11.2.4.1 Increased delivery of equipment to drive segment
     11.3 MARITIME
               TABLE 18 MILITARY SIMULATION AND TRAINING MARKET, BY MARITIME, 2019–2021 (USD MILLION)
               TABLE 19 MARKET, BY MARITIME, 2022–2027 (USD MILLION)
             11.3.1 NAVAL SHIPS
                       11.3.1.1 Growing procurement of destroyers by US, Saudi Arabia, and Germany to boost use of naval ships
             11.3.2 SUBMARINES
                       11.3.2.1 Increasing focus on developing next-generation submarines to drive segment growth
             11.3.3 UNMANNED MARITIME VEHICLES (UMVS)
                       11.3.3.1 Adoption of UMVs for defense applications aids growth of military simulation and training market
     11.4 AIRBORNE
               TABLE 20 MARKET, BY AIRBORNE, 2019–2021 (USD MILLION)
               TABLE 21 MILITARY SIMULATION AND TRAINING MARKET, BY AIRBORNE, 2022–2027 (USD MILLION)
             11.4.1 FIGHTER AIRCRAFT
                       11.4.1.1 Increasing requirement for combat missions to drive market growth
             11.4.2 MILITARY HELICOPTERS
                       11.4.2.1 Growing application in search & rescue and combat operations to push demand for military helicopters
             11.4.3 SPECIAL MISSION AIRCRAFT
                       11.4.3.1 High usage for strategic military operations to further increase demand for special mission aircraft
             11.4.4 UAVS
                       11.4.4.1 Wide-scale application in military attacks to raise market demand for UAVs
 
12 MILITARY SIMULATION AND TRAINING MARKET, BY APPLICATION (Page No. - 98)
     12.1 INTRODUCTION
               FIGURE 31 ARMY SEGMENT TO RECORD HIGHEST CAGR BETWEEN 2022 AND 2027
               TABLE 22 MARKET, BY APPLICATION,  2019–2021 (USD MILLION)
               TABLE 23 MILITARY SIMULATION AND TRAINING MARKET, BY APPLICATION, 2022–2027 (USD MILLION)
     12.2 ARMY
             12.2.1 ARMORED FIGHTING VEHICLE DRIVING TRAINING
                       12.2.1.1 Driving simulators for high-end beginner and experienced training and practice solutions to boost market demand
             12.2.2 GUNNERY & COMBAT TRAINING
                       12.2.2.1 Land forces training simulators for armed forces training to fuel market demand
             12.2.3 COMMAND STAFF TRAINING
                       12.2.3.1 Need for tactical training to drive segment
     12.3 NAVAL
             12.3.1 FULL MISSION BRIDGE TRAINING
                       12.3.1.1 Full mission bridge simulators to train commercial and military ship operators expected to boost demand
             12.3.2 SUBMARINE TRAINING
                       12.3.2.1 Increasing focus on developing next-generation submarines to push market growth
             12.3.3 VESSEL TRAFFIC CONTROL TRAINING
                       12.3.3.1 Vessel traffic control simulators for better management results in higher demand for training
     12.4 AVIATION
             12.4.1 FLIGHT TRAINING
                       12.4.1.1 Increasing deliveries of fighter aircraft for use in cross border conflicts to gain more share for flight training
             12.4.2 CARGO LOADING TRAINING
                       12.4.2.1 Growing deployment of cargo loaders to drive market
             12.4.3 MAINTENANCE TRAINING
                       12.4.3.1 Better understanding of advanced aircraft functionality to mark segment growth
 
13 REGIONAL ANALYSIS (Page No. - 103)
     13.1 INTRODUCTION
               TABLE 24 MAJOR ONGOING PROGRAMS RELATED TO TECHNOLOGIES IN MILITARY SIMULATION AND TRAINING MARKET, 2019-2020
               FIGURE 32 MARKET IN ASIA PACIFIC PROJECTED TO GROW AT HIGHEST RATE FROM 2022 TO 2027
               TABLE 25 MILITARY SIMULATION AND TRAINING MARKET, BY REGION, 2019–2021 (USD MILLION)
               TABLE 26 MARKET, BY REGION, 2022–2027 (USD MILLION)
     13.2 NORTH AMERICA
             13.2.1 COVID-19 IMPACT ON NORTH AMERICA
             13.2.2 PESTE ANALYSIS: NORTH AMERICA
                       FIGURE 33 NORTH AMERICA MARKET SNAPSHOT
                       TABLE 27 NORTH AMERICA: MARKET, BY COUNTRY,  2019–2021 (USD MILLION)
                       TABLE 28 NORTH AMERICA: MARKET, BY COUNTRY,  2022–2027 (USD MILLION)
                       TABLE 29 NORTH AMERICA: MILITARY SIMULATION AND TRAINING MARKET, BY APPLICATION, 2019–2021 (USD MILLION)
                       TABLE 30 NORTH AMERICA: MARKET, BY APPLICATION, 2022–2027 (USD MILLION)
                       TABLE 31 NORTH AMERICA: MARKET, BY TYPE,  2019–2021 (USD MILLION)
                       TABLE 32 NORTH AMERICA: MARKET, BY TYPE,  2022–2027 (USD MILLION)
                       TABLE 33 NORTH AMERICA: MARKET, BY SOLUTION,  2019–2021 (USD MILLION)
                       TABLE 34 NORTH AMERICA: MARKET, BY SOLUTION,  2022–2027 (USD MILLION)
             13.2.3 US
                       13.2.3.1 Modernization programs and defense policies increase demand for digitalization in US military
                                   TABLE 35 US: MILITARY SIMULATION AND TRAINING MARKET, BY APPLICATION, 2019–2021 (USD MILLION)
                                   TABLE 36 US: MARKET, BY APPLICATION, 2022–2027 (USD MILLION)
                                   TABLE 37 US: MARKET, BY TYPE, 2019–2021 (USD MILLION)
                                   TABLE 38 US: MARKET, BY TYPE, 2022–2027 (USD MILLION)
                                   TABLE 39 US: MARKET, BY SOLUTION, 2019–2021 (USD MILLION)
                                   TABLE 40 US: MARKET, BY SOLUTION,  2022–2027 (USD MILLION)
             13.2.4 CANADA
                       13.2.4.1 Increase in demand for training of military aircraft pilots to fuel demand for military simulation and training in Canada
                                   TABLE 41 CANADA: MILITARY SIMULATION AND TRAINING MARKET, BY APPLICATION,  2019–2021 (USD MILLION)
                                   TABLE 42 CANADA: MARKET, BY APPLICATION,  2022–2027 (USD MILLION)
                                   TABLE 43 CANADA: MARKET, BY TYPE, 2019–2021 (USD MILLION)
                                   TABLE 44 CANADA: MARKET, BY TYPE,  2022–2027 (USD MILLION)
                                   TABLE 45 CANADA: MARKET, BY SOLUTION,  2019–2021 (USD MILLION)
                                   TABLE 46 CANADA: MARKET, BY SOLUTION,  2022–2027 (USD MILLION)
     13.3 EUROPE
             13.3.1 COVID-19 IMPACT ON EUROPE
             13.3.2 PESTLE ANALYSIS: EUROPE
                       FIGURE 34 EUROPE MILITARY SIMULATION AND TRAINING MARKET SNAPSHOT
                       TABLE 47 EUROPE: MARKET, BY COUNTRY,  2019–2021 (USD MILLION)
                       TABLE 48 EUROPE: MARKET, BY COUNTRY,  2022–2027 (USD MILLION)
                       TABLE 49 EUROPE: MARKET, BY APPLICATION,  2019–2021 (USD MILLION)
                       TABLE 50 EUROPE: MARKET, BY APPLICATION,  2022–2027 (USD MILLION)
                       TABLE 51 EUROPE: MARKET, BY TYPE, 2019–2021 (USD MILLION)
                       TABLE 52 EUROPE: MARKET, BY TYPE, 2022–2027 (USD MILLION)
                       TABLE 53 EUROPE: MARKET, BY SOLUTION,  2019–2021 (USD MILLION)
                       TABLE 54 EUROPE: MARKET, BY SOLUTION,  2022–2027 (USD MILLION)
             13.3.3 UK
                       13.3.3.1 Modernization of military training programs expected to drive market
                                   TABLE 55 UK: MILITARY SIMULATION AND TRAINING MARKET, BY APPLICATION, 2019–2021 (USD MILLION)
                                   TABLE 56 UK: MARKET, BY APPLICATION, 2022–2027 (USD MILLION)
                                   TABLE 57 UK: MARKET, BY TYPE, 2019–2021 (USD MILLION)
                                   TABLE 58 UK: MARKET, BY TYPE, 2022–2027 (USD MILLION)
                                   TABLE 59 UK: MARKET, BY SOLUTION, 2019–2021 (USD MILLION)
                                   TABLE 60 UK: MARKET, BY SOLUTION, 2022–2027 (USD MILLION)
             13.3.4 GERMANY
                       13.3.4.1 R&D to push market growth
                                   TABLE 61 GERMANY: MILITARY SIMULATION AND TRAINING MARKET, BY APPLICATION,  2019–2021 (USD MILLION)
                                   TABLE 62 GERMANY: MARKET, BY APPLICATION,  2022–2027 (USD MILLION)
                                   TABLE 63 GERMANY: MARKET, BY TYPE, 2019–2021 (USD MILLION)
                                   TABLE 64 GERMANY: MARKET, BY TYPE, 2022–2027 (USD MILLION)
                                   TABLE 65 GERMANY: MARKET, BY SOLUTION,  2019–2021 (USD MILLION)
                                   TABLE 66 GERMANY: MARKET, BY SOLUTION,  2022–2027 (USD MILLION)
             13.3.5 ITALY
                       13.3.5.1 Growing upgrades of existing defense equipment and introduction of new platforms to expand market
                                   TABLE 67 ITALY: MILITARY SIMULATION AND TRAINING MARKET, BY APPLICATION,  2019–2021 (USD MILLION)
                                   TABLE 68 ITALY: MARKET, BY APPLICATION,  2022–2027 (USD MILLION)
                                   TABLE 69 ITALY: MARKET, BY TYPE, 2019–2021 (USD MILLION)
                                   TABLE 70 ITALY: MARKET, BY TYPE, 2022–2027 (USD MILLION)
                                   TABLE 71 ITALY: MARKET, BY SOLUTION,  2019–2021 (USD MILLION)
                                   TABLE 72 ITALY: MARKET, BY SOLUTION, 2022–2027 (USD MILLION)
             13.3.6 FRANCE
                       13.3.6.1 Technological advancements to enable market growth in France
                                   TABLE 73 FRANCE: MARKET, BY APPLICATION,  2019–2021 (USD MILLION)
                                   TABLE 74 FRANCE: MARKET, BY APPLICATION,  2022–2027 (USD MILLION)
                                   TABLE 75 FRANCE: MILITARY SIMULATION AND TRAINING MARKET, BY TYPE,  2019–2021 (USD MILLION)
                                   TABLE 76 FRANCE: MARKET, BY TYPE,  2022–2027 (USD MILLION)
                                   TABLE 77 FRANCE: MARKET, BY SOLUTION,  2019–2021 (USD MILLION)
                                   TABLE 78 FRANCE: MARKET, BY SOLUTION,  2022–2027 (USD MILLION)
             13.3.7 SPAIN
                       13.3.7.1 Advancement in training capabilities to create demand in Spain
                                   TABLE 79 SPAIN: MILITARY SIMULATION AND TRAINING MARKET, BY APPLICATION,  2019–2021 (USD MILLION)
                                   TABLE 80 SPAIN: MARKET, BY APPLICATION,  2022–2027 (USD MILLION)
                                   TABLE 81 SPAIN: MARKET, BY TYPE, 2019–2021 (USD MILLION)
                                   TABLE 82 SPAIN: MARKET, BY TYPE, 2022–2027 (USD MILLION)
                                   TABLE 83 SPAIN: MARKET, BY SOLUTION,  2019–2021 (USD MILLION)
                                   TABLE 84 SPAIN: MARKET, BY SOLUTION,  2022–2027 (USD MILLION)
             13.3.8 REST OF EUROPE
                       13.3.8.1 Rise in aircraft deliveries projected to broaden market for military simulation and training
                                   TABLE 85 REST OF EUROPE: MILITARY SIMULATION AND TRAINING MARKET, BY APPLICATION, 2019–2021 (USD MILLION)
                                   TABLE 86 REST OF EUROPE: MARKET, BY APPLICATION, 2022–2027 (USD MILLION)
                                   TABLE 87 REST OF EUROPE: MARKET, BY TYPE,  2019–2021 (USD MILLION)
                                   TABLE 88 REST OF EUROPE: MARKET, BY TYPE,  2022–2027 (USD MILLION)
                                   TABLE 89 REST OF EUROPE: MARKET, BY SOLUTION,  2019–2021 (USD MILLION)
                                   TABLE 90 REST OF EUROPE: MARKET, BY SOLUTION,  2022–2027 (USD MILLION)
     13.4 ASIA PACIFIC
             13.4.1 COVID-19 IMPACT ON ASIA PACIFIC
             13.4.2 PESTLE ANALYSIS: ASIA PACIFIC
                       FIGURE 35 ASIA PACIFIC MILITARY SIMULATION AND TRAINING MARKET SNAPSHOT
                       TABLE 91 ASIA PACIFIC: MARKET, BY COUNTRY,  2019–2021 (USD MILLION)
                       TABLE 92 ASIA PACIFIC: MARKET, BY COUNTRY,  2022–2027 (USD MILLION)
                       TABLE 93 ASIA PACIFIC: MARKET, BY APPLICATION,  2019–2021 (USD MILLION)
                       TABLE 94 ASIA PACIFIC: MARKET, BY APPLICATION,  2022–2027 (USD MILLION)
                       TABLE 95 ASIA PACIFIC: MARKET, BY TYPE,  2019–2021 (USD MILLION)
                       TABLE 96 ASIA PACIFIC: MARKET, BY TYPE,  2022–2027 (USD MILLION)
                       TABLE 97 ASIA PACIFIC: MARKET, BY SOLUTION,  2019–2021 (USD MILLION)
                       TABLE 98 ASIA PACIFIC: MARKET, BY SOLUTION,  2022–2027 (USD MILLION)
             13.4.3 CHINA
                       13.4.3.1 Increasing expenditure on R&D for military equipment expected to drive market
                                   TABLE 99 CHINA: MILITARY SIMULATION AND TRAINING MARKET, BY APPLICATION,  2019–2021 (USD MILLION)
                                   TABLE 100 CHINA: MARKET, BY APPLICATION,  2022–2027 (USD MILLION)
                                   TABLE 101 CHINA: MARKET, BY TYPE, 2019–2021 (USD MILLION)
                                   TABLE 102 CHINA: MARKET, BY TYPE, 2022–2027 (USD MILLION)
                                   TABLE 103 CHINA: MARKET, BY SOLUTION,  2019–2021 (USD MILLION)
                                   TABLE 104 CHINA: MARKET, BY SOLUTION,  2022–2027 (USD MILLION)
             13.4.4 JAPAN
                       13.4.4.1 Need to strengthen combat capabilities to enhance market demand in Japan
                                   TABLE 105 JAPAN: MILITARY SIMULATION AND TRAINING MARKET, BY APPLICATION,  2019–2021 (USD MILLION)
                                   TABLE 106 JAPAN: MARKET, BY APPLICATION,  2022–2027 (USD MILLION)
                                   TABLE 107 JAPAN: MARKET, BY TYPE,  2019–2021 (USD MILLION)
                                   TABLE 108 JAPAN: MARKET, BY TYPE, 2022–2027 (USD MILLION)
                                   TABLE 109 JAPAN: MARKET, BY SOLUTION,  2019–2021 (USD MILLION)
                                   TABLE 110 JAPAN: MARKET, BY SOLUTION,  2022–2027 (USD MILLION)
             13.4.5 INDIA
                       13.4.5.1 Ongoing modernization of Indian defense to propel market growth
                                   TABLE 111 INDIA: MILITARY SIMULATION AND TRAINING MARKET, BY APPLICATION,  2019–2021 (USD MILLION)
                                   TABLE 112 INDIA: MARKET, BY APPLICATION,  2022–2027 (USD MILLION)
                                   TABLE 113 INDIA: MARKET, BY TYPE,  2019–2021 (USD MILLION)
                                   TABLE 114 INDIA: MARKET, BY TYPE, 2022–2027 (USD MILLION)
                                   TABLE 115 INDIA: MARKET, BY SOLUTION,  2019–2021 (USD MILLION)
                                   TABLE 116 INDIA: MARKET, BY SOLUTION, 2022–2027 (USD MILLION)
             13.4.6 SOUTH KOREA
                       13.4.6.1 Digital transformation of defense sector stimulates South Korean market
                                   TABLE 117 SOUTH KOREA: MILITARY SIMULATION AND TRAINING MARKET, BY APPLICATION,  2019–2021 (USD MILLION)
                                   TABLE 118 SOUTH KOREA: MARKET, BY APPLICATION,  2022–2027 (USD MILLION)
                                   TABLE 119 SOUTH KOREA: MARKET, BY TYPE,  2019–2021 (USD MILLION)
                                   TABLE 120 SOUTH KOREA: MARKET, BY TYPE,  2022–2027 (USD MILLION)
                                   TABLE 121 SOUTH KOREA: MARKET, BY SOLUTION,  2019–2021 (USD MILLION)
                                   TABLE 122 SOUTH KOREA: MARKET, BY SOLUTION,  2022–2027 (USD MILLION)
             13.4.7 AUSTRALIA
                       13.4.7.1 High demand for combat training center boost market demand
                                   TABLE 123 AUSTRALIA: MARKET, BY APPLICATION,  2019–2021 (USD MILLION)
                                   TABLE 124 AUSTRALIA: MARKET, BY APPLICATION,  2022–2027 (USD MILLION)
                                   TABLE 125 AUSTRALIA: MARKET, BY TYPE, 2019–2021 (USD MILLION)
                                   TABLE 126 AUSTRALIA: MARKET, BY TYPE, 2022–2027 (USD MILLION)
                                   TABLE 127 AUSTRALIA: MARKET, BY SOLUTION,  2019–2021 (USD MILLION)
                                   TABLE 128 AUSTRALIA: MARKET, BY SOLUTION,  2022–2027 (USD MILLION)
             13.4.8 SINGAPORE
                       13.4.8.1 Presence of indigenous companies to fulfill demand for simulators
                                   TABLE 129 SINGAPORE: MILITARY SIMULATION AND TRAINING MARKET, BY APPLICATION,  2019–2021 (USD MILLION)
                                   TABLE 130 SINGAPORE: MARKET, BY APPLICATION,  2022–2027 (USD MILLION)
                                   TABLE 131 SINGAPORE: MARKET, BY TYPE,  2019–2021 (USD MILLION)
                                   TABLE 132 SINGAPORE: MARKET, BY TYPE,  2022–2027 (USD MILLION)
                                   TABLE 133 SINGAPORE: MARKET, BY SOLUTION,  2019–2021 (USD MILLION)
                                   TABLE 134 SINGAPORE: MARKET, BY SOLUTION,  2022–2027 (USD MILLION)
             13.4.9 REST OF ASIA PACIFIC
                       TABLE 135 REST OF ASIA PACIFIC: MILITARY SIMULATION AND TRAINING MARKET, BY APPLICATION, 2019–2021 (USD MILLION)
                       TABLE 136 REST OF ASIA PACIFIC: MARKET, BY APPLICATION, 2022–2027 (USD MILLION)
                       TABLE 137 REST OF ASIA PACIFIC: MARKET, BY TYPE,  2019–2021 (USD MILLION)
                       TABLE 138 REST OF ASIA PACIFIC: MARKET, BY TYPE,  2022–2027 (USD MILLION)
                       TABLE 139 REST OF ASIA PACIFIC: MARKET, BY SOLUTION, 2019–2021 (USD MILLION)
                       TABLE 140 REST OF ASIA PACIFIC: MARKET, BY SOLUTION, 2022–2027 (USD MILLION)
     13.5 MIDDLE EAST
             13.5.1 COVID-19 IMPACT ON THE MIDDLE EAST & AFRICA
             13.5.2 PESTLE ANALYSIS: MIDDLE EAST & AFRICA
                       FIGURE 36 MIDDLE EAST MILITARY SIMULATION AND TRAINING MARKET SNAPSHOT
                       TABLE 141 MIDDLE EAST: MARKET, BY COUNTRY,  2019–2021 (USD MILLION)
                       TABLE 142 MIDDLE EAST: MARKET, BY COUNTRY,  2022–2027 (USD MILLION)
                       TABLE 143 MIDDLE EAST: MARKET, BY APPLICATION,  2019–2021 (USD MILLION)
                       TABLE 144 MIDDLE EAST: MARKET, BY APPLICATION,  2022–2027 (USD MILLION)
                       TABLE 145 MIDDLE EAST: MARKET, BY TYPE,  2019–2021 (USD MILLION)
                       TABLE 146 MIDDLE EAST: MARKET, BY TYPE,  2022–2027 (USD MILLION)
                       TABLE 147 MIDDLE EAST: MARKET, BY SOLUTION,  2019–2021 (USD MILLION)
                       TABLE 148 MIDDLE EAST: MARKET, BY SOLUTION,  2022–2027 (USD MILLION)
             13.5.3 ISRAEL
                       13.5.3.1 Military modernization programs and development of capabilities of defense organizations amplify market in Israel
                                   TABLE 149 ISRAEL: MILITARY SIMULATION AND TRAINING MARKET, BY APPLICATION,  2019–2021 (USD MILLION)
                                   TABLE 150 ISRAEL: MARKET, BY APPLICATION,  2022–2027 (USD MILLION)
                                   TABLE 151 ISRAEL: MARKET, BY TYPE, 2019–2021 (USD MILLION)
                                   TABLE 152 ISRAEL: MARKET, BY TYPE, 2022–2027 (USD MILLION)
                                   TABLE 153 ISRAEL: MARKET, BY SOLUTION,  2019–2021 (USD MILLION)
                                   TABLE 154 ISRAEL: MARKET, BY SOLUTION,  2022–2027 (USD MILLION)
             13.5.4 SAUDI ARABIA
                       13.5.4.1 Growing need to train defense personnel to raise market demand in Saudi Arabia
                                   TABLE 155 SAUDI ARABIA: MARKET, BY APPLICATION,  2019–2021 (USD MILLION)
                                   TABLE 156 SAUDI ARABIA: MARKET, BY APPLICATION,  2022–2027 (USD MILLION)
                                   TABLE 157 SAUDI ARABIA: MARKET, BY TYPE,  2019–2021 (USD MILLION)
                                   TABLE 158 SAUDI ARABIA: MARKET, BY TYPE,  2022–2027 (USD MILLION)
                                   TABLE 159 SAUDI ARABIA: MARKET, BY SOLUTION,  2019–2021 (USD MILLION)
                                   TABLE 160 SAUDI ARABIA: MARKET, BY SOLUTION,  2022–2027 (USD MILLION)
             13.5.5 UAE
                       13.5.5.1 Focus on strengthening defense capabilities to strengthen market demand
                                   TABLE 161 UAE: MILITARY SIMULATION AND TRAINING MARKET, BY APPLICATION,  2019–2021 (USD MILLION)
                                   TABLE 162 UAE: MARKET, BY APPLICATION,  2022–2027 (USD MILLION)
                                   TABLE 163 UAE: MARKET, BY TYPE, 2019–2021 (USD MILLION)
                                   TABLE 164 UAE: MARKET, BY TYPE, 2022–2027 (USD MILLION)
                                   TABLE 165 UAE: MARKET, BY SOLUTION, 2019–2021 (USD MILLION)
                                   TABLE 166 UAE: MARKET, BY SOLUTION,  2022–2027 (USD MILLION)
     13.6 REST OF THE WORLD
               FIGURE 37 REST OF THE WORLD MILITARY SIMULATION AND TRAINING MARKET SNAPSHOT
               TABLE 167 REST OF THE WORLD: MARKET, BY COUNTRY, 2019–2021 (USD MILLION)
               TABLE 168 REST OF THE WORLD: MARKET, BY COUNTRY, 2022–2027 (USD MILLION)
               TABLE 169 REST OF THE WORLD: MARKET, BY APPLICATION, 2019–2021 (USD MILLION)
               TABLE 170 REST OF THE WORLD: MARKET, BY APPLICATION, 2022–2027 (USD MILLION)
               TABLE 171 REST OF THE WORLD: MARKET, BY TYPE,  2019–2021 (USD MILLION)
               TABLE 172 REST OF THE WORLD: MARKET, BY TYPE,  2022–2027 (USD MILLION)
               TABLE 173 REST OF THE WORLD: MARKET, BY SOLUTION, 2019–2021 (USD MILLION)
               TABLE 174 REST OF THE WORLD: MARKET, BY SOLUTION, 2022–2027 (USD MILLION)
             13.6.1 LATIN AMERICA
                       13.6.1.1 Increase in ship operators to enhance market demand for military simulation and training in Latin America
                                   TABLE 175 LATIN AMERICA: MILITARY SIMULATION AND TRAINING MARKET, BY APPLICATION,  2019–2021 (USD MILLION)
                                   TABLE 176 LATIN AMERICA: MARKET, BY APPLICATION,  2022–2027 (USD MILLION)
                                   TABLE 177 LATIN AMERICA: MARKET, BY TYPE,  2019–2021 (USD MILLION)
                                   TABLE 178 LATIN AMERICA: MARKET, BY TYPE,  2022–2027 (USD MILLION)
                                   TABLE 179 LATIN AMERICA: MARKET, BY SOLUTION,  2019–2021 (USD MILLION)
                                   TABLE 180 LATIN AMERICA: MARKET, BY SOLUTION,  2022–2027 (USD MILLION)
             13.6.2 AFRICA
                       13.6.2.1 Rise in demand for ship operators in Africa to increase demand for military simulation and training
                                   TABLE 181 AFRICA: MARKET, BY APPLICATION,  2019–2021 (USD MILLION)
                                   TABLE 182 AFRICA: MARKET, BY APPLICATION,  2022–2027 (USD MILLION)
                                   TABLE 183 AFRICA: MARKET, BY TYPE, 2019–2021 (USD MILLION)
                                   TABLE 184 AFRICA: MARKET, BY TYPE, 2022–2027 (USD MILLION)
                                   TABLE 185 AFRICA: MARKET, BY SOLUTION,  2019–2021 (USD MILLION)
                                   TABLE 186 AFRICA: MARKET, BY SOLUTION,  2022–2027 (USD MILLION)
 
14 COMPETITIVE LANDSCAPE (Page No. - 168)
     14.1 INTRODUCTION 
             TABLE 187 KEY DEVELOPMENTS BY LEADING PLAYERS IN MILITARY SIMULATION AND TRAINING MARKET BETWEEN 2018 AND 2021
     14.2 REVENUE ANALYSIS OF TOP 5 MARKET PLAYERS 
             FIGURE 38 REVENUE ANALYSIS OF TOP 5 MARKET PLAYERS, 2017–2021 (USD MILLION)
     14.3 MARKET SHARE ANALYSIS 
             FIGURE 39 MARKET SHARE ANALYSIS, 2021
             TABLE 188 DEGREE OF COMPETITION
     14.4 COMPANY EVALUATION MATRIX 
             14.4.1 STARS
             14.4.2 EMERGING LEADERS
             14.4.3 PERVASIVE COMPANIES
             14.4.4 PARTICIPANTS
                        FIGURE 40 MILITARY SIMULATION AND TRAINING MARKET: COMPANY EVALUATION MATRIX, 2021
             14.4.5 COMPANY FOOTPRINT
                        TABLE 189 COMPANY OVERALL FOOTPRINT
                        TABLE 190 COMPANY COMPONENT FOOTPRINT
                        TABLE 191 COMPANY PLATFORM FOOTPRINT
                        TABLE 192 COMPANY REGION FOOTPRINT
     14.5 STARTUP/SME EVALUATION MATRIX 
             14.5.1 PROGRESSIVE COMPANIES
             14.5.2 RESPONSIVE COMPANIES
             14.5.3 DYNAMIC COMPANIES
             14.5.4 STARTING BLOCKS
                        FIGURE 41 MILITARY SIMULATION AND TRAINING MARKET: STARTUP/SME COMPANY EVALUATION MATRIX, 2021
             14.5.5 COMPETITIVE BENCHMARKING
                        TABLE 193 MILITARY SIMULATION AND TRAINING: LIST OF KEYS STARTUPS/SMES
                        TABLE 194 MILITARY SIMULATION AND TRAINING: COMPETITIVE BENCHMARKING OF KEY STARTUPS/SMES
     14.6 COMPETITIVE SCENARIO 
             14.6.1 DEALS
                        TABLE 195 MARKET: DEALS, JUNE 2021
             14.6.2 PRODUCT LAUNCHES
                        TABLE 196 MARKET: PRODUCT LAUNCHES, NOVEMBER 2018–JANUARY 2022
             14.6.3 OTHER DEALS/DEVELOPMENTS
                        TABLE 197 MILITARY SIMULATION AND TRAINING MARKET: OTHER DEALS/DEVELOPMENTS, FEBRUARY 2019–OCTOBER 2021
 
15 COMPANY PROFILES (Page No. - 185)
     15.1 INTRODUCTION 
     15.2 KEY PLAYERS 
(Business Overview, Products/Solutions/Services offered, Recent Developments, MnM View)*  
             15.2.1 RAYTHEON TECHNOLOGIES
                        TABLE 198 RAYTHEON TECHNOLOGIES: BUSINESS OVERVIEW
                        FIGURE 42 RAYTHEON TECHNOLOGIES: COMPANY SNAPSHOT
                        TABLE 199 RAYTHEON TECHNOLOGIES: PRODUCTS/SOLUTIONS/SERVICES OFFERED
                        TABLE 200 RAYTHEON TECHNOLOGIES: PRODUCT DEVELOPMENTS
                        TABLE 201 RAYTHEON TECHNOLOGIES.: DEALS
             15.2.2 LOCKHEED MARTIN CORPORATION
                        TABLE 202 LOCKHEED MARTIN CORPORATION: BUSINESS OVERVIEW
                        FIGURE 43 LOCKHEED MARTIN CORPORATION: COMPANY SNAPSHOT
                        TABLE 203 LOCKHEED MARTIN CORPORATION: PRODUCTS/SOLUTIONS/SERVICES OFFERED
                        TABLE 204 LOCKHEED MARTIN CORPORATION: PRODUCT DEVELOPMENTS
                        TABLE 205 LOCKHEED MARTIN CORPORATION.: DEALS
             15.2.3 CAE INC.
                        TABLE 206 CAE INC.: BUSINESS OVERVIEW
                        FIGURE 44 CAE INC.: COMPANY SNAPSHOT
                        TABLE 207 CAE INC.: PRODUCTS/SOLUTIONS/SERVICES OFFERED
                        TABLE 208 CAE INC.: PRODUCT DEVELOPMENTS
                        TABLE 209 CAE INC.: DEALS
             15.2.4 SAAB AB
                        TABLE 210 SAAB AB: BUSINESS OVERVIEWS
                        FIGURE 45 SAAB AB: COMPANY SNAPSHOT
                        TABLE 211 SAAB AB: PRODUCTS/SOLUTIONS/SERVICES OFFERED
                        TABLE 212 SAAB AB.: PRODUCT DEVELOPMENTS
                        TABLE 213 SAAB-AB: DEALS
             15.2.5 RHEINMETALL AG
                        TABLE 214 RHEINMETALL AG: BUSINESS OVERVIEW
                        FIGURE 46 RHEINMETALL AG: COMPANY SNAPSHOT
                        TABLE 215 RHEINMETALL AG: PRODUCTS/SOLUTIONS/SERVICES OFFERED
                        TABLE 216 RHEINMETALL AG: DEALS
             15.2.6 BAE SYSTEMS PLC
                        TABLE 217 BAE SYSTEMS PLC: BUSINESS OVERVIEW
                        FIGURE 47 BAE SYSTEMS PLC: COMPANY SNAPSHOT
                        TABLE 218 BAE SYSTEMS PLC: PRODUCTS/SOLUTIONS/SERVICES OFFERED
                        TABLE 219 BAE SYSTEMS PLC: DEALS
             15.2.7 ST ENGINEERING
                        TABLE 220 ST ENGINEERING: BUSINESS OVERVIEW
                        FIGURE 48 ST ENGINEERING: COMPANY SNAPSHOT
                        TABLE 221 ST ENGINEERING: PRODUCTS/SOLUTIONS/SERVICES OFFERED
             15.2.8 THE BOEING COMPANY
                        TABLE 222 THE BOEING COMPANY: BUSINESS OVERVIEW
                        FIGURE 49 THE BOEING COMPANY: COMPANY SNAPSHOT
                        TABLE 223 THE BOEING COMPANY: PRODUCTS/SOLUTIONS/SERVICES OFFERED
                        TABLE 224 THE BOEING COMPANY: DEALS
             15.2.9 NORTHROP GRUMMAN CORPORATION
                        TABLE 225 NORTHROP GRUMMAN CORPORATION: BUSINESS OVERVIEW
                        FIGURE 50 NORTHROP GRUMMAN CORPORATION: COMPANY SNAPSHOT
                        TABLE 226 NORTHROP GRUMMAN CORPORATION: PRODUCTS/SOLUTIONS/SERVICES OFFERED
                        TABLE 227 NORTHROP GRUMMAN CORPORATION: DEALS
             15.2.10 LEONARDO SPA
                        TABLE 228 LEONARDO SPA: BUSINESS OVERVIEW
                        FIGURE 51 LEONARDO SPA: COMPANY SNAPSHOT
                        TABLE 229 LEONARDO SPA: PRODUCTS/SOLUTIONS/SERVICES OFFERED
             15.2.11 INVERIS TRAINING SOLUTIONS
                        TABLE 230 INVERIS TRAINING SOLUTIONS: BUSINESS OVERVIEW
                        TABLE 231 INVERIS TRAINING SOLUTIONS: PRODUCTS/SOLUTIONS/SERVICES OFFERED
                        TABLE 232 INVERIS TRAINING SOLUTIONS: PRODUCT DEVELOPMENTS
                        TABLE 233 INVERTIS TRAINING SOLUTIONS: DEALS
             15.2.12 TEXTRON
                        TABLE 234 TEXTRON: BUSINESS OVERVIEW
                        FIGURE 52 TEXTRON: COMPANY SNAPSHOT
                        TABLE 235 TEXTRON: PRODUCTS/SOLUTIONS/SERVICES OFFERED
                        TABLE 236 TEXTRON: DEALS
             15.2.13 ELBIT SYSTEMS LTD
                        TABLE 237 ELBIT SYSTEMS LTD: BUSINESS OVERVIEW
                        FIGURE 53 ELBIT SYSTEMS LTD: COMPANY SNAPSHOT
                        TABLE 238 ELBIT SYSTEMS: PRODUCTS/SOLUTIONS/SERVICES OFFERED
             15.2.14 BOHEMIA INTERACTIVE SIMULATIONS
                        TABLE 239 BOHEMIA INTERACTIVE SIMULATIONS: BUSINESS OVERVIEW
                        TABLE 240 BOHEMIA INTERACTIVE SIMULATIONS: PRODUCTS/SOLUTIONS/SERVICES OFFERED
                        TABLE 241 BOHEMIA INTERACTIVE SIMULATION: DEALS
             15.2.15 CUBIC CORPORATION
                        TABLE 242 CUBIC CORPORATION: BUSINESS OVERVIEW
                        FIGURE 54 CUBIC CORPORATION: COMPANY SNAPSHOT
                        TABLE 243 CUBIC CORPORATION: PRODUCTS/SOLUTIONS/SERVICES OFFERED
                        TABLE 244 CUBIC CORPORATION: DEALS
             15.2.16 THALES SA
                        TABLE 245 THALES SA: BUSINESS OVERVIEW
                        FIGURE 55 THALES SA: COMPANY SNAPSHOT
                        TABLE 246 THALES SA: PRODUCTS/SOLUTIONS/SERVICES OFFERED
                        TABLE 247 THALES SA: DEALS
             15.2.17 AVT SIMULATION
                        TABLE 248 AVT SIMULATION: BUSINESS OVERVIEW
                        TABLE 249 AVT SIMULATION: PRODUCTS/SOLUTIONS/SERVICES OFFERED
                        TABLE 250 AVT SIMULATION: DEALS
             15.2.18 BOOZ ALLEN HAMILTON
                        TABLE 251 BOOZ ALLEN HAMILTON: BUSINESS OVERVIEW
                        FIGURE 56 BOOZ ALLEN HAMILTON: COMPANY SNAPSHOT
                        TABLE 252 BOOZ ALLEN HAMILTON: PRODUCTS/SOLUTIONS/SERVICES OFFERED
             15.2.19 ECA GROUP
                        TABLE 253 ECA GROUP: BUSINESS OVERVIEW
                        TABLE 254 ECA GROUP: PRODUCTS/SOLUTIONS/SERVICES OFFERED
             15.2.20 INDRA SISTEMAS SA
                        TABLE 255 INDRA SISTEMAS AS: BUSINESS OVERVIEW
                        TABLE 256 INDRA SISTEMAS AS: PRODUCTS/SOLUTIONS/SERVICES OFFERED
             15.2.21 KONGSBERG MARITIME
                        TABLE 257 KONGSBERG MARITIME.: BUSINESS OVERVIEW
                        TABLE 258 KONGSBERG MARITIME: PRODUCTS/SOLUTIONS/SERVICES OFFERED
                        TABLE 259 KONGBERG MARITIME: DEALS
     15.3 OTHER PLAYERS 
             15.3.1 PRECISION FLIGHT CONTROLS, INC.
                        TABLE 260 PRECISION FLIGHT CONTROLS, INC.: BUSINESS OVERVIEW
                        TABLE 261 PRECISION FLIGHT CONTROLS, INC.: PRODUCTS/SOLUTIONS/SERVICES OFFERED
             15.3.2 AVION GROUP
                        TABLE 262 AVION GROUP: BUSINESS OVERVIEW
                        TABLE 263 AVION GROUP: PRODUCTS/SOLUTIONS/SERVICES OFFERED
             15.3.3 VSTEP BV
                        TABLE 264 VSTEP BV: BUSINESS OVERVIEW
                        TABLE 265 VSTEP BV: PRODUCTS/SOLUTIONS/SERVICES OFFERED
 
             15.3.4 VIRTRA
                        TABLE 266 VIRTRA: BUSINESS OVERVIEW
                        TABLE 267 VIRTRA: PRODUCTS/SOLUTIONS/SERVICES OFFERED
                        TABLE 268 VIRTRA: DEALS
             15.3.5 FRASCA INTERNATIONAL, INC.
                        TABLE 269 FRASCA INTERNATIONAL, INC.: BUSINESS OVERVIEW
                        TABLE 270 FRASCA INTERNATIONAL, INC: PRODUCTS/SOLUTIONS/SERVICES OFFERED
                        TABLE 271 FRASCA INTERNATIONAL, INC: DEALS
*Details on Business Overview, Products/Solutions/Services offered, Recent Developments, MnM View might not be captured in case of unlisted companies.  
 
16 APPENDIX (Page No. - 249)
     16.1 DISCUSSION GUIDE 
     16.2 KNOWLEDGESTORE: MARKETSANDMARKETS’ SUBSCRIPTION PORTAL 
     16.3 RELATED REPORTS 
     16.4 AUTHOR DETAILS 
 

The research study conducted on the Military Simulation and Training market involved extensive use of secondary sources, directories, and databases such as Hoovers, Bloomberg Businessweek, and Factiva to identify and collect information relevant to the market. The primary sources considered included industry experts from the Military Simulation and Training market consisting of Military Simulation and Training service providers, government agencies, technology vendors, system integrators, research organizations, and original equipment manufacturers related to all segments of the value chain of this industry. In-depth interviews with various primary respondents, including key industry participants, Subject Matter Experts (SMEs), industry consultants, and C-level executives, have been conducted to obtain and verify critical qualitative and quantitative information pertaining to the Military display as well as to assess the growth prospects of the market.

Secondary Research

Secondary sources referred for this research study included Boeing and Airbus Market Outlook 2019, General Aviation Manufacturers Association (GAMA); International Air Transport Association (IATA) publications; Flight Global World Airforce Fleet; Stockholm International Peace Research Institute, corporate filings (such as annual reports, investor presentations, and financial statements); Federal Aviation Administration (FAA) and trade, business, and professional associations. Secondary data was collected and analyzed to arrive at the overall market size, which was further validated by primary respondents.
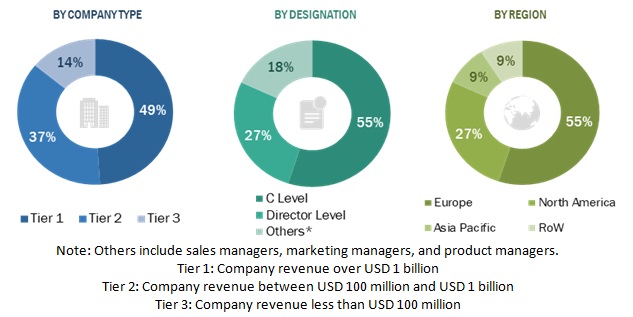
Military Simulation and Training Market  Size, and Share

To know about the assumptions considered for the study, download the pdf brochure

Market Size Estimation

Both top-down and bottom-up approaches were used to estimate and validate the size of the Military display market. The research methodology used to estimate the market size also included the following details:

  • Key players in the market were identified through secondary research, and their market ranking was determined through primary and secondary research. This included a study of annual and financial reports of top market players and extensive interviews with industry experts with knowledge on Military display
  • All percentage shares, splits, and breakdowns were determined using secondary sources and verified through primary sources.
  • All possible parameters that affect the markets covered in this research study were accounted for, viewed in extensive detail, verified through primary research, and analyzed to obtain the final quantitative and qualitative data. This data was consolidated, enhanced with detailed inputs, and analyzed by MarketsandMarkets and presented in this report.

Market size estimation methodology: Bottom-up approach
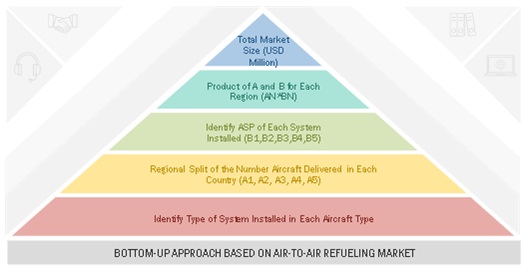
Military Simulation and Training Market  Size, and Share

To know about the assumptions considered for the study, Request for Free Sample Report

Data Triangulation

After arriving at the overall market size from the market size estimation process, the total market was split into several segments and subsegments. Data triangulation and market breakdown procedures explained below were implemented, wherever applicable, to complete the overall market engineering process and arrive at the estimated market numbers for the segments and subsegments of Military display market. The data was triangulated by studying various factors and trends from both the demand and supply sides. Along with this, the market size was validated using both top-down and bottom-up approaches.

Report Objectives

  • To define, describe, and forecast the size of the Military display market based on System, Propulsion Type, Passenger Capacity, End use, Range, Autonomy and Region.
  • To identify and analyze key drivers, opportunities, and challenges influencing the growth of the market
  • To identify industry trends, market trends, and technology trends currently prevailing in the market
  • To forecast the size of different segments of the market with respect to North America, Europe, Asia Pacific, Middle East and Latin America.
  • To profile leading market players based on their product portfolios, financial positions, and key growth strategies
  • To analyze the degree of competition in the market by identifying key growth strategies, such as mergers & acquisitions, contracts, agreements, collaborations, new product launches, and funding, adopted by leading market players.
  • To provide a detailed competitive landscape of the market, along with rank analysis, revenue share analysis, and market share analysis of key players
  • To provide a comprehensive analysis of business and corporate strategies adopted by key market players.

Available Customizations

Along with the market data, MarketsandMarkets offers customizations as per the specific needs of companies. The following customization options are available for the report:

Product Analysis

  • Product matrix, which gives a detailed comparison of the product portfolio of each company

Regional Analysis

  • Further breakdown of the market segments at country-level

Company Information

  • Detailed analysis and profiling of additional market players (up to 5)
Custom Market Research Services

We will customize the research for you, in case the report listed above does not meet with your exact requirements. Our custom research will comprehensively cover the business information you require to help you arrive at strategic and profitable business decisions.

Request Customization

Instant Answers with GPT - Ask Now!

Ask real questions. Get complete answers !
Report Code
AS 1125
Published ON
Apr, 2022
Choose License Type
BUY NOW
  • SHARE
X
Request Customization
Speak to Analyst
Speak to Analyst
OR FACE-TO-FACE MEETING
PERSONALIZE THIS RESEARCH
  • Triangulate with your Own Data
  • Get Data as per your Format and Definition
  • Gain a Deeper Dive on a Specific Application, Geography, Customer or Competitor
  • Any level of Personalization
REQUEST A FREE CUSTOMIZATION
LET US HELP YOU!
  • What are the Known and Unknown Adjacencies Impacting the Military Simulation and Training Market
  • What will your New Revenue Sources be?
  • Who will be your Top Customer; what will make them switch?
  • Defend your Market Share or Win Competitors
  • Get a Scorecard for Target Partners
CUSTOMIZED WORKSHOP REQUEST
knowledgestore logo

Want to explore hidden markets that can drive new revenue in Military Simulation and Training Market?

Find Hidden Markets
  • Call Us
  • +1-888-600-6441 (Corporate office hours)
  • +1-888-600-6441 (US/Can toll free)
  • +44-800-368-9399 (UK office hours)
CONNECT WITH US
ABOUT TRUST ONLINE
©2024 MarketsandMarkets Research Private Ltd. All rights reserved
DMCA.com Protection Status
Website Feedback