Natural Refrigerants Market by Type (Ammonia, Carbon dioxide, Hydrocarbons and Others), by Application (Refrigeration: Industrial, Commercial, and Domestic, Air Conditioning: Stationary and Mobile, and Others) - Global Trends & Forecasts to 2020


Natural refrigerants are the alternatives for the environmentally harmful HCFC and HFC refrigerants. Natural refrigerants are called �natural� as the chemicals are derived from the natural bio-chemical process itself. These refrigerants have very low impact on the environment in terms of ozone depletion and global warming.
The natural refrigerants market size is projected to be USD 1,419.19 Million by 2020 from USD 821.74 Million in 2015, at a CAGR of 11.5%. The market is projected to grow on account of the enforcement of stringent environmental regulations and due to the need to improve the energy efficiency of refrigeration systems.
Expansion in terms of production capacity and distribution network is the main area of focus for the players in the market. Major initiatives are also aimed at developing new variants of natural refrigerants with better performance qualities and increased functionality. All these developments are a reaction to phasing out of HCFC and HFC refrigerants that in turn, is accelerating the demand for natural refrigerants.
This report includes estimates for the market size in 2015 and provides projections for the market till 2020. The projections and forecasts involve the analysis of various past and present trends in the market that have a potential impact on the market�s future. It also includes a detailed qualitative and quantitative analysis of the natural refrigerants market on the basis of its types, applications, and regions. Various secondary sources, such as directories, annual reports, white papers, and databases have been used to identify and collect information that is useful for this extensive commercial study. The primary sources for the report included experts from related industries and suppliers who have been interviewed to obtain and verify critical information as well as to assess the future prospects of the market.
Competitive scenarios of the top players in the market have been discussed in detail. The leading players of this industry with their recent developments and other strategic industry activities are profiled. These top companies The Linde Group (Germany), Airgas Inc. (U.S.), A-Gas international (U.K.), Puyang Zhongwei Fine Chemical Co. Ltd. (China), Sinochem (China), Engas Australasia (Australia), Tazzetti S.p.A (Italy), and Shangdong Yueon Chemical Co. Ltd. (China), among others.
Scope of the Report
This research report categorizes the global natural refrigerants market on the basis of type, application and region in terms of market size and analyzing trends in each of the sub markets.
On the basis of type: The market is segmented by type of natural refrigerants � Ammonia (R-717), hydrocarbons (R-290, R-1270, R-600a), and carbon dioxide (CO2) (R-744). Each of these types has been further described in detail in the report with market size forecasts as well.
On the basis of application: The market is segmented by the applications of natural refrigerants � Industrial refrigeration, commercial refrigeration, domestic refrigeration, stationary air-conditioning and mobile air-conditioning among others. All of the applications have been further described in detail in the report with market size forecasts.
On the basis of region: Europe, North America, Asia-Pacific, South America, and the Middle East & Africa; for key countries within these regions.
The natural refrigerants market is projected to be worth USD 1,419.19 Million in 2020 from USD 821.74 Million in 2015, at a CAGR of 11.5% between 2015 and 2020. This is on account of the various regulations that limit the usage of HFC and promote natural refrigerants. Increasing demand from refrigeration and air-conditioning (RAC) sector are also driving the growth for the market. They are used in various applications for refrigeration: industrial, commercial and domestic; and air-conditioning: stationary and mobile among other applications such as in chillers and heat pumps.
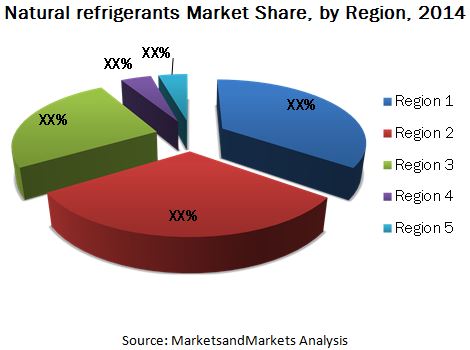
Europe is the largest market majorly driven due to environmental concerns and emission regulations. Asia-Pacific ranks second in terms of market size which is followed by North America.
The manufacturers in the natural refrigerants market are looking to expand their distribution network to take advantage of the enforcement of regulations that have been estimated to increase the demand for natural refrigerants. Companies have used merger & acquisition strategy to expand their presence as well as to increase their production.
The intial high cost of natural refrigerant based system, lack of technical knowledge for handling of natural refrigerants, and the related flammability and toxicity issues of the refrigerants are the major restraints for the market that have to be dealt with.
The major players in the natural refrigerants market are Linde Group (Germany), Airgas Inc. (the U.S.), A-Gas International (the U.K.), Sinochem (China), Puyang Zongwei Fine Chemical Co. Ltd. (China), and Shangdong Yueon Chemical Co. Ltd. (China) among others. The market also has a high presence of small to medium manufacturers that cater to smaller parts of the end-use industries.
The competition in this market was low due to low volume demand and focus on different regions. The enforcement of environmental regulations will be increasing the competition between the companies in the coming years. Expansion in terms of production capacity and region is the preferred strategy adopted by the major players. The companies are also focusing on developing new products with better performance to increase their share in the natural refrigerants market.
 Exclusive indicates content/data unique to MarketsandMarkets and not available with any competitors.
Table of Contents
1 Introduction (Page No. - 18)
1.1 Objectives of the Study
1.2 Market Definition
1.3 Market Scope
1.3.1 Markets Covered
1.3.2 Scope, By Region
1.3.3 Years Considered in the Report
1.4 Currency
1.5 Package Size
1.6 Stakeholders
2 Research Methodology (Page No. - 22)
2.1 Market Size Estimation
2.1.1 Bottom-Up Approach
2.1.2 Top-Down Approach
2.2 Market Breakdown and Data Triangulation
2.2.1 Secondary Data
2.2.2 Primary Data
2.2.2.1 Key Industry Insights
2.2.2.2 Breakdown of Primaries
2.3 Assumptions
3 Executive Summary (Page No. - 30)
4 Premium Insights (Page No. - 34)
4.1 Attractive Market Opportunity for Natural Refrigerants Manufacturers
4.2 Natural Refrigerants Market Growing at A Fast Pace
4.3 Market Attractiveness, By Type
4.4 Lifecycle Analysis
5 Market Overview (Page No. - 39)
5.1 Introduction
5.2 Market Segmentation
5.2.1 By Type
5.2.2 By Application
5.2.3 By Region
5.3 Market Dynamics
5.3.1 Drivers
5.3.1.1 Low Environmental Impact
5.3.1.2 Phasing Out of Cfc, HCFC, and HFC Refrigerants
5.3.1.3 Long-Term Viability
5.3.1.4 Increasing Demand for Refrigeration and Air-Conditioning Application
5.3.2 Restraints
5.3.2.1 Higher Initial Capital Cost Requirement
5.3.2.2 Low Demand
5.3.2.3 Flammability and Toxicity Issues
5.3.3 Opportunities
5.3.3.1 Effects of Global Warming
5.3.3.2 Lower Operating Cost With Higher Performance
5.3.3.3 Technological Advancement for Increasing Performance
5.3.4 Challenges
5.3.4.1 Few Purification Companies
5.3.4.2 Lack of Education and Awareness in Hvac Contractors and Technicians
5.4 Value-Chain Analysis
5.4.1 Raw Material
5.4.2 Manufacturing
5.4.3 Distribution of Natural Refrigerants
5.4.4 Marketing and Sales
5.5 Pricing and Cost Analysis
5.5.1 Price Drivers
5.5.1.1 Raw Materials
5.5.1.2 Energy Prices
5.5.1.3 Exchange Rates
5.6 Porter�s Five Forces Analysis
5.6.1 Threat of New Entrants
5.6.2 Bargaining Power of Suppliers
5.6.3 Threat of Substitutes
5.6.4 Bargaining Power of Buyers
5.6.5 Intensity of Rivalry
5.7 Policies and Regulations
5.7.1 Europe
5.7.1.1 Eu F-Gas Regulations
5.7.1.2 Montreal Protocol
5.7.1.3 Mac Directive
5.7.1.4 Denmark
5.7.1.5 Austria
5.7.1.6 Switzerland
5.7.2 North America
5.7.2.1 Significant New Alternative Policy (SNAP) By Epa
5.7.3 Asia-Pacific
5.7.3.1 Japan: Revised F-Gas Law
5.7.3.2 China- Feco: First Catalogue of Recommended Substitutes for HCFCs
5.7.3.3 China: Room Air-Conditioning Industry HCFC Phase-Out Management Action Plan
5.7.4 South America
5.7.4.1 Brazil: Label for Commercial Refrigeration Under Discussion
5.7.4.2 Chile: New Meps for Domestic Refrigeration By 2016
6 Natural Refrigerants Market, By Type (Page No. - 57)
6.1 Introduction
6.2 Ammonia Refrigerant
6.2.1 Most Widely Used Natural Refrigerant in the Market
6.3 Hydrocarbon Refrigerant
6.3.1 Hydrocarbon Refrigerant to Register the Highest Growth in North America
6.3.2 Propane (R-290)
6.3.3 Butane (R-600)
6.3.4 Iso-Butane (R-600a)
6.3.5 Other Hydrocarbons
6.4 CO2 Refrigerant
6.4.1 CO2 Refrigerant to Register the Highest Growth in North America
6.5 Other Refrigerants
6.5.1 Other Refrigerants to Register the Highest Growth in North America
6.5.2 Water
6.5.3 Air
7 Natural Refrigerants Market, By Application (Page No. - 73)
7.1 Introduction
7.2 Commercial Refrigeration
7.2.1 Europe to Be the Main Driver for Commercial Refrigeration Application
7.3 Industrial Refrigeration
7.3.1 Investments in the Industrial Refrigeration Sector in Asia-Pacific Driving the Market
7.4 Domestic Refrigeration
7.4.1 Asia-Pacific Showing Potential for Domestic Refrigeration Application of Natural Refrigerants
7.5 Stationary Air-Conditioning
7.5.1 North America to Show Strong Potential for Stationary Air-Conditioning Application of Natural Refrigerants
7.6 Mobile Air-Conditioning
7.6.1 Europe and North America to Show High Potential for Mobile Air-Conditioning Application of Natural Refrigerants
7.7 Others
7.7.1 North America Projected to Lead the Market for Other Applications
8 Regional Analysis (Page No. - 94)
8.1 Introduction
8.2 Europe
8.2.1 Germany
8.2.2 U.K.
8.2.3 France
8.2.4 Rest of Europe
8.3 North America
8.3.1 U.S.
8.3.2 Canada
8.3.3 Mexico
8.4 Asia-Pacific
8.4.1 China
8.4.2 Japan
8.4.3 India
8.4.4 Australia
8.4.5 Rest of Asia-Pacific
8.5 Middle East & Africa
8.6 South America
9 Competitive Landscape (Page No. - 139)
9.1 Overview
9.2 Expansion: The Most Popular Growth Strategy
9.3 Maximum Developments in 2012
9.4 A-Gas: The Top Most Player
9.5 Competitive Situation and Trends
9.5.1 Expansion
9.5.2 New Product Launch
9.5.3 Merger & Acquisition
9.5.4 Distribution, Supply, and Licensing Agreement
9.5.5 Others
10 Company Profiles (Page No. - 149)
10.1 Introduction
10.2 Airgas Inc.
10.2.1 Business Overview
10.2.2 Products Offered
10.2.3 MnM View
10.2.4 SWOT Analysis
10.2.5 Recent Developments
10.3 The Linde Group
10.3.1 Business Overview
10.3.2 Products Offered
10.3.3 MnM View
10.3.4 SWOT Analysis
10.3.5 Recent Developments
10.4 Sinochem Group
10.4.1 Business Overview
10.4.2 Products Offered
10.4.3 MnM View
10.4.4 Recent Developments
10.5 Engas Australasia
10.5.1 Business Overview
10.5.2 Products Offered
10.5.3 MnM View
10.5.4 Recent Developments
10.6 Harp International Ltd.
10.6.1 Business Overview
10.6.2 Products Offered
10.6.3 MnM View
10.6.4 Recent Developments
10.7 Tazzetti S.P.A.
10.7.1 Business Overview
10.7.2 Products Offered
10.7.3 MnM View
10.8 Puyang Zhongwei Fine Chemical Co. Ltd.
10.8.1 Business Overview
10.8.2 Products Offered
10.8.3 MnM View
10.8.4 Recent Developments
10.9 Shandong Yueon Chemical Industry Ltd.
10.9.1 Business Overview
10.9.2 Products Offered
10.9.3 MnM View
10.9.4 Recent Developments
10.10 A-Gas International
10.10.1 Business Overview
10.10.2 Products Offered
10.10.3 MnM View
10.10.4 Recent Developments
10.11 Hychill Australia Pvt. Ltd.
10.11.1 Business Overview
10.11.2 Products Offered
10.11.3 MnM View
10.11.4 Recent Developments
10.12 GTS S.P.A
10.12.1 Business Overview
10.12.2 Products Offered
10.12.3 MnM View
10.12.4 Recent Developments
10.13 A.S. Trust and Holdings
10.13.1 Business Overview
10.13.2 Products Offered
10.13.3 MnM View
10.13.4 Recent Developments
11 Appendix (Page No. - 176)
11.1 Insights From Industry Experts
11.2 Discussion Guide
11.3 Introducing RT: Real Time Market Intelligence
11.4 Available Customizations
11.5 Related Reports
List of Tables (108 Tables)
Table 1 GWP and ODP of Major Refrigerants
Table 2 Properties of Various Refrigerants
Table 3 Natural Refrigerants Market: Average Prices, By Region (USD/Ton)
Table 4 Natural Refrigerants Market: Average Prices, By Type (USD/Ton)
Table 5 Natural Refrigerants Market Size, By Type, 2013�2020 (Ton)
Table 6 Natural Refrigerants Market Size, By Type, 2013�2020 (USD Million)
Table 7 Leading Companies Manufacturing Ammonia Refrigerants
Table 8 Ammonia Refrigerant Market Size, By Region, 2013�2020 (Ton)
Table 9 Ammonia Refrigerant Market Size, By Region, 2013�2020 (USD Million)
Table 10 Leading Companies Producing Hydrocarbon Refrigerants
Table 11 Hydrocarbon Refrigerant Market Size, By Region, 2013�2020 (Ton)
Table 12 Hydrocarbon Refrigerant Market Size, By Region, 2013�2020 (USD Million)
Table 13 Leading Companies Producing CO2 Refrigerants
Table 14 CO2 Refrigerant Market Size, By Region, 2013�2020 (Ton)
Table 15 CO2 Refrigerant Market Size, By Region, 2013�2020 (USD Million)
Table 16 Other Refrigerants Market Size, By Region, 2013�2020 (Ton)
Table 17 Other Refrigerants Market Size, By Region, 2013�2020 (USD Million)
Table 18 Natural Refrigerants Market Size, By Application, 2013�2020 (Ton)
Table 19 Market Size, By Application, 2013�2020 (USD Million)
Table 20 Market Size in Commercial Refrigeration, By Region, 2013�2020 (Ton)
Table 21 Market Size in Commercial Refrigeration, By Region, 2013�2020 (USD Million)
Table 22 Criteria for Industrial Refrigeration
Table 23 Natural Refrigerants Market Size in Industrial Refrigeration, By Region, 2013�2020 (Ton)
Table 24 Natural Refrigerants in Industrial Refrigeration Market Size, By Region, 2013�2020 (USD Million)
Table 25 Natural Refrigerants in Domestic Refrigeration Market Size, By Region, 2013�2020 (Ton)
Table 26 Natural Refrigerants Market Size in Domestic Refrigeration, By Region, 2013�2020 (USD Million)
Table 27 Types of Refrigerant Used in Air Conditioners
Table 28 Natural Refrigerants Market Size in Stationary Air-Conditioning, By Region, 2013�2020 (Ton)
Table 29 Market Size in Stationary Air-Conditioning, By Region, 2013�2020 (USD Million)
Table 30 Market Size in Mobile Air-Conditioning, By Region, 2013�2020 (Ton)
Table 31 Market Size in Mobile Air-Conditioning, By Region, 2013�2020 (USD Million)
Table 32 Alternate Refrigerants, Their Advantages and Difficulties for Use
Table 33 Natural Refrigerants Market Size in Other Applications, By Region, 2013�2020 (Ton)
Table 34 Market Size in Other Applications, By Region, 2013�2020 (USD Million)
Table 35 Market Size, By Region, 2013�2020 (Ton)
Table 36 Market Size, By Region, 2013�2020 (USD MN)
Table 37 Europe: Natural Refrigerants Market Size, By Country, 2013�2020 (Ton)
Table 38 Market Size, By Country, 2013�2020 (USD MN)
Table 39 Market Size, By Type, 2013�2020 (Ton)
Table 40 Market Size, By Type, 2013�2020 (USD MN)
Table 41 Market Size, By Application, 2013�2020 (Ton)
Table 42 Market Size, By Application, 2013�2020 (USD MN)
Table 43 Germany: Natural Refrigerants Market Size, By Type, 2013�2020 (Ton)
Table 44 Market Size, By Type, 2013�2020 (USD MN)
Table 45 Market Size, By Application, 2013�2020 (Ton)
Table 46 Market Size, By Application, 2013�2020 (USD MN)
Table 47 U.K.: Natural Refrigerants Market Size, By Type, 2013�2020 (Ton)
Table 48 Market Size, By Type, 2013�2020 (USD MN)
Table 49 Market Size, By Application, 2013�2020 (Ton)
Table 50 Market Size, By Application, 2013�2020 (USD MN)
Table 51 France: Natural Refrigerants Market Size, By Type, 2013�2020 (Ton)
Table 52 Market Size, By Type, 2013�2020 (USD MN)
Table 53 Market Size, By Application, 2013�2020 (Ton)
Table 54 Market Size, By Application, 2013�2020 (USD MN)
Table 55 North America: Natural Refrigerants Market Size, By Country, 2013�2020 (Ton)
Table 56 Market Size, By Country, 2013�2020 (USD MN)
Table 57 Market Size, By Type, 2013�2020 (Ton)
Table 58 North America: Natural Refrigerants Market Size, By Type, 2013�2020 (USD MN)
Table 59 Market Size, By Application, 2013�2020 (Ton)
Table 60 Market Size, By Application, 2013�2020 (USD MN)
Table 61 U.S.: Natural Refrigerants Market Size, By Type, 2013�2020 (Ton)
Table 62 Market Size, By Type, 2013�2020 (USD MN)
Table 63 Market Size, By Application, 2013�2020 (Ton)
Table 64 Market Size, By Application, 2013�2020 (USD MN)
Table 65 Canada: Natural Refrigerants Market Size, By Type, 2013�2020 (Ton)
Table 66 Market Size, By Type, 2013�2020 (USD MN)
Table 67 Market Size, By Application, 2013�2020 (Ton)
Table 68 Market Size, By Application, 2013�2020 (USD MN)
Table 69 Mexico: Natural Refrigerants Market Size, By Type, 2013�2020 (Ton)
Table 70 Market Size, By Type, 2013�2020 (USD MN)
Table 71 Market Size, By Application, 2013�2020 (Ton)
Table 72 Market Size, By Application, 2013�2020 (USD MN)
Table 73 Increasing Demand in Asia-Pacific
Table 74 Asia-Pacific: Natural Refrigerants Market Size, By Country, 2013�2020 (Ton)
Table 75 Market Size, By Country, 2013�2020 (USD MN)
Table 76 Market Size, By Type, 2013�2020 (Ton)
Table 77 Market Size, By Type, 2013�2020 (USD MN)
Table 78 Market Size, By Application, 2013�2020 (Ton)
Table 79 Market Size, By Application, 2013�2020 (USD MN)
Table 80 China: Natural Refrigerants Market Size, By Type, 2013�2020 (Ton)
Table 81 Market Size, By Type, 2013�2020 (USD MN)
Table 82 Market Size, By Application, 2013�2020 (Ton)
Table 83 Market Size, By Application, 2013�2020 (USD MN)
Table 84 Japan: Natural Refrigerants Market Size, By Type, 2013�2020 (Ton)
Table 85 Market Size, By Type, 2013�2020 (USD MN)
Table 86 Market Size, By Application, 2013�2020 (Ton)
Table 87 Market Size, By Application, 2013�2020 (USD MN)
Table 88 India: Natural Refrigerants Market Size, By Type, 2013�2020 (Ton)
Table 89 Market Size, By Type, 2013�2020 (USD MN)
Table 90 Market Size, By Application, 2013�2020 (Ton)
Table 91 Market Size, By Application, 2013�2020 (USD MN)
Table 92 Australia: Natural Refrigerants Market Size, By Type, 2013�2020 (Ton)
Table 93 Market Size, By Type, 2013�2020 (USD MN)
Table 94 Market Size, By Application, 2013�2020 (Ton)
Table 95 Australia: Natural Refrigerants Market Size, By Application, 2013�2020 (USD MN)
Table 96 Middle East & Africa: Natural Refrigerants Market Size, By Type, 2013�2020 (Ton)
Table 97 Market Size, By Type, 2013�2020 (USD MN)
Table 98 Market Size, By Application, 2013�2020 (Ton)
Table 99 Market Size, By Application, 2013�2020 (USD MN)
Table 100 South America: Natural Refrigerants Market Size, By Type, 2013�2020 (Ton)
Table 101 Market Size, By Type, 2013�2020 (USD MN)
Table 102 Market Size, By Application, 2013�2020 (Ton)
Table 103 South America: Natural Refrigerants Market Size, By Application, 2013�2020 (USD MN)
Table 104 Expansion, 2010�2015
Table 105 New Product Launch, 2010�2015
Table 106 Merger & Acquisition, 2010�2015
Table 107 Distribution, Supply, and Licensing Agreement, 2010�2015
Table 108 Others, 2010�2015
List of Figures (77 Figures)
Figure 1 Natural Refrigerants Market: Research Design
Figure 2 Market Size Estimation: Bottom-Up Approach
Figure 3 Market Size Estimation: Top-Down Approach
Figure 4 Key Data From Secondary Sources
Figure 5 Key Data From Primary Sources
Figure 6 Breakdown of Primary Interviews, By Company Type, Designation, and Region
Figure 7 Natural Refrigerants Market Snapshot: By Type, USD Million, 2015 vs 2020
Figure 8 Natural Refrigerant Market: By Application
Figure 9 Commercial Refrigeration to Witness the Highest Growth
Figure 10 Natural Refrigerants Market Share (By Value), By Region, 2015: Europe Estimated to Be the Largest Market
Figure 11 Natural Refrigerant Market: Opportunity for Manufacturers
Figure 12 Industrial Refrigeration is the Largest Application (2013�2020)
Figure 13 CO2 Driving the Growth for the Natural Refrigerants Market
Figure 14 Ammonia: Most Widely Used Natural Refrigerant
Figure 15 Asia-Pacific Market Soon to Enter the Growth Phase
Figure 16 Natural Refrigerant Market: Leading Countries (2015 vs 2020)
Figure 17 Europe: The Largest Market for Natural Refrigerants, 2015
Figure 18 Natural Refrigerants: Market Segmentation, By Type
Figure 19 Natural Refrigerants Market Segmentation, By Application
Figure 20 Natural Refrigerants Market, By Region
Figure 21 Overview of Factors Governing the Global Natural Refrigerants Market
Figure 22 Phase Out Timeline for HCFC and HFC Refrigerants: Developed and Developing Economies
Figure 23 Value Chain for Natural Refrigerants Industry
Figure 24 Natural Refrigerants: Supply Chain
Figure 25 Porter�s Five Forces Analysis: Natural Refrigerants Market, 2015
Figure 26 Natural Refrigerants Market: Impact of Regulations Over the Ages
Figure 27 Natural Refrigerants Regulations: A Global Overview
Figure 28 Natural Refrigerant: Types
Figure 29 CO2 Refrigerants to Witness the Fastest Growth
Figure 30 Ammonia Refrigerant to Expereience High Value Growth Between 2015 and 2020
Figure 31 North America to Be the Fastest-Growing Region for Ammonia Refrigerant Market (2015 vs 2020)
Figure 32 Ammonia Refrigerant to Witness High Growth in Europe and North America Between 2015 and 2020
Figure 33 North America to Be the Fastest-Growing Region for Hydrocarbon Refrigerant Market
Figure 34 Hydrocarbon Refrigerant to Witness High Growth in Europe Between 2015 and 2020
Figure 35 North America to Be the Fastest-Growing Region for CO2 Refrigerant Market
Figure 36 CO2 Refrigerant to Witness High Growth in Europe Between 2015 And2020
Figure 37 Natural Refrigerants: Breakdown of Application
Figure 38 Natural Refrigerants Market to Experience High Demand for Commercial Refrigeration
*Other Applications Include Chillers and Water Heat Pumps 76
Figure 39 Commercial Refrigeration to Register the Highest Growth in Terms of Value, 2015�2020
Figure 40 Commercial Refrigeration Segment to Witness High Growth in North America (2015 vs 2020)
Figure 41 Europe to Register the Highest Growth for Commercial Refrigeration, in Terms of Value
Figure 42 Asia-Pacific Driving the Growth in the Industrial Refrigeration Application Between 2015 and 2020
Figure 43 Europe Driving the Growth in the Industrial Refrigeration Application By Value Between 2015 and 2020
Figure 44 Asia-Pacific to Register the Highest CAGR in Domestic Refrigeration Application of Natural Refrigerants Between 2015 and 2020
Figure 45 Highest Growth in Domestic Refrigeration Application to Be Registered By Asia-Pacific (2015 vs 2020)
Figure 46 North America to Register the Highest CAGR in Stationary Air-Conditioning Application of Natural Refrigerants Between 2015 and 2020
Figure 47 Highest Growth By Value for Stationary Air-Conditioning Application to Be Registered By Europe (2015 vs 2020)
Figure 48 North America to Register the Highest CAGR in Mobile Air-Conditioning Application of Natural Refrigerants Between 2015 and 2020
Figure 49 Highest Growth By Value for Mobile Air-Conditioning Application to Be Registered By Europe (2015 vs 2020)
Figure 50 North America to Register the Highest Growth in the Natural Refrigerants Market (2015 vs 2020)
Figure 51 Europe is Projected to Emerge as the Fastest-Growing Natural Refrigerants Market, Between 2015 and 2020
Figure 52 Leading Countries in the Natural Refrigerants Market: Benchmarking, By Type
Figure 53 Natural Refrigerants Market Snapshot: Regulations are the Major Growth Drivers
Figure 54 Germany Dominating the Natural Refrigerants Market (2015 vs 2020)
Figure 55 Europe: Natural Refrigerants Market Snapshot
Figure 56 Germany: Largest Market for Natural Refrigerants (2015 vs 2020)
Figure 57 Asia-Pacific: Natural Refrigerants Market Snapshot
Figure 58 China: Largest Market for Natural Refrigerants in Asia-Pacific (2015 vs 2020)
Figure 59 Companies Primarily Adopted Organic Growth Strategies
Figure 60 Key Growth Strategies in Global Natural Refrigerants Market, 2010�2015
Figure 61 Natural Refrigerants Market Developmental Share, 2010�2015
Figure 62 Growth Strategies, By Company, 2010�2015
Figure 63 Market Penetration of Major Players, By Region
Figure 64 Airgas Inc.: Company Snapshot
Figure 65 SWOT Analysis: Airgas Inc.
Figure 66 The Linde Group: Company Snapshot
Figure 67 SWOT Analysis: Linde Group
Figure 68 Sinochem Group: Company Snapshot
Figure 69 Engas Australasia: Company Snapshot
Figure 70 Harp International Ltd.: Company Snapshot
Figure 71 Tazzetti S.P.A: Company Snapshot
Figure 72 Puyang Zhongwei Fine Chemcial Co. Ltd.: Company Snapshot
Figure 73 Shandong Yueon Chemical Industry Ltd.: Company Snapshot
Figure 74 A-Gas: Company Snapshot
Figure 75 Hychill: Company Snapshot
Figure 76 GTS S.P.A: Company Snapshot
Figure 77 A.S. Trust and Holdings.: Company Snapshot


Growth opportunities and latent adjacency in Natural Refrigerants Market