Transcritical CO2 Systems Market by Function (Refrigeration, Heating, Air Conditioning), Application (Supermarkets And Convenience Stores, Heat Pumps, Food Processing & Storage Facilities, Ice Skating Rinks), and Region - Global Forecast to 2023


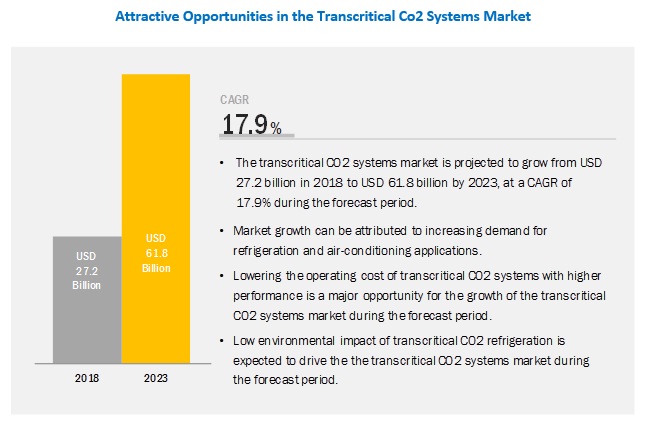
[148 Pages Report] The transcritical CO2 systems market is estimated to grow from USD 27.2 billion in 2018 to USD 61.8 billion by 2023, at a CAGR of 17.9%. The major driving factors for the transcritical CO2 systems market are the low environmental impact of transcritical CO2 systems; phasing out of CFC, HCFC, and HFC refrigerants; increasing demand for refrigeration and air-conditioning applications; and low operating costs of transcritical CO2 refrigeration systems.
The refrigeration function segment is expected to grow at the highest rate due to the increasing demand from the construction and infrastructure sectors.
Refrigeration is mostly used in supermarkets and convenience stores. Transcritical CO2 refrigeration has a high safety rating and is non-toxic and non-flammable. Additionally, these systems are used in the refrigeration processes due to their high volumetric cooling capacity.
Supermarkets & convenience stores application segment is the largest segment.
Refrigeration systems account for more than 50% of the total electricity consumption in supermarkets. The use of transcritical CO₂ helps retailers reduce energy consumption by reducing the maintenance cost of refrigeration systems. Transcritical CO2 systems operate at higher pressure than other refrigeration systems. Low Ozone-Depletion Potential (ODP) and low Global Warming Potential (GWP) of these systems make them preferable in supermarkets in Europe, Australia, and Japan.
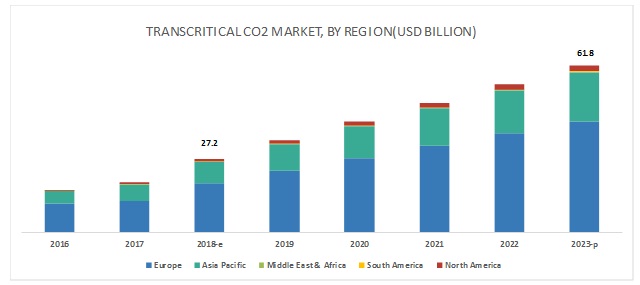
Europe is expected to account for the largest market size during the forecast period.
The transcritical CO2 systems market in Europe is expected to witness significant growth on account of the recent F-Gas regulations/HFC phase-out plan which dictates the reduction of use of HFC refrigerants by almost half by 2025. The region also houses the highest number of end-user entities such as Tesco (UK) and Metro AG (Germany) that have already switched to refrigeration systems based on transcritical CO2 systems.
Key Market Players
Key players in the market include Carrier Commercial Refrigeration (US), Green & Cool World Refrigeration AB (Sweden), Hillphoenix, Inc. (US), Advansor (Denmark), Danfoss (Denmark), BITZER (Germany), Carnot Refrigeration (Canada), SCM Frigo S.p.A. (Italy), Emerson Climate Technologies (US), Baltimore Aircoil Company (US), Henry Technologies, Inc. (US), Systemes LMP, Inc. (Canada), Mayekawa Mfg. Co., Ltd. (Japan), and Panasonic (Japan). These players have expanded their geographical presence through new product launches, acquisitions, and expansions.
Scope of the report:
|
Report Metric |
Details |
|
Market size available for years |
2016-2023 |
|
Base year considered |
2017 |
|
Forecast period |
2018-2023 |
|
Forecast units |
Value (USD) and Volume (Number of Installations) |
|
Segments covered |
Function, Application, and Region |
|
Geographies covered |
North America, APAC, Europe, Middle East & Africa, and South America |
|
Companies covered |
Carrier Commercial Refrigeration (US), Green & Cool World Refrigeration AB (Sweden), Hillphoenix, Inc. (US), Advansor (Denmark), Danfoss (Denmark), BITZER (Germany), Carnot Refrigeration (Canada), SCM Frigo S.p.A. (Italy), Emerson Climate Technologies (US), Baltimore Aircoil Company (US), Henry Technologies, Inc. (US), Systemes LMP, Inc. (Canada), Mayekawa Mfg. Co., Ltd. (Japan) and Panasonic (Japan) |
This research report categorizes the transcritical CO2 systems market based on function, application, and region, forecasting volumes and revenues as well as analyzing trends in each of these submarkets.
Based on function the transcritical CO2 systems market is segmented into:
- Refrigeration
- Heating
- Air Conditioning
Based on application the transcritical CO2 systems market is segmented into:
- Supermarkets and Convenience Stores
- Heat Pumps
- Food Processing & Storage Facilities
- Ice Skating Rinks
- Others (Hotels, Buildings, and Water Treatment Plants)
Based on region the transcritical CO2 systems market is segmented into:
- Asia Pacific
- North America
- Europe
- Middle East & Africa
- South America
Recent Developments
- In November 2018, Baltimore Aircoil Company, Inc. launched Vertex Evaporative Condenser, which offers maximum uptime. It has low maintenance and operation costs and reduces the installation cost by 30%. This product launch is expected to help the company enhance its product portfolio.
- In October 2018, Danfoss launched a new series of pumps to target the large capacity industrial wastewater treatment plants. This product launch enhanced the product portfolio of the company to cater to the requirements of its customers.
Key Questions Addressed by the Report
- Where will all these developments take the industry in the mid to long term?
- What are the upcoming industry applications for transcritical CO2 systems?
- What is the impact of the change in the environmental policy in the transcritical CO2 systems market?
To speak to our analyst for a discussion on the above findings, click Speak to Analyst
 Exclusive indicates content/data unique to MarketsandMarkets and not available with any competitors.
Table of Contents
1 Introduction (Page No. - 16)
1.1 Objectives of the Study
1.2 Market Definition
1.3 Scope of the Study
1.3.1 Markets Covered
1.3.2 Years Considered for the Study
1.4 Currency
1.5 Limitations
1.6 Stakeholders
2 Research Methodology (Page No. - 19)
2.1 Research Data
2.1.1 Secondary Data
2.1.1.1 Key Data From Secondary Sources
2.1.2 Primary Data
2.1.2.1 Key Data From Primary Sources
2.1.2.2 Key Industry Insights
2.1.2.3 Breakdown of Primary Interviews
2.2 Market Size Estimation
2.2.1 Bottom-Up Approach
2.2.2 Top-Down Approach
2.3 Data Triangulation Methodology
2.4 Research Assumptions
2.4.1 Assumptions
3 Executive Summary (Page No. - 27)
4 Premium Insights (Page No. - 30)
4.1 Attractive Opportunities in Transcritical CO2 Systems Market
4.2 Transcritical CO2 Systems Market, By Region
4.3 Europe Transcritical CO2 Systems Market, By Application & Country
4.4 Transcritical CO2 Systems Market, By Application & Region
4.5 Top Countries in Transcritical CO2 Systems Market
5 Market Overview (Page No. - 33)
5.1 Introduction
5.2 Evolution
5.3 Transcritical CO2 System
5.4 Comparison of CO2 With Ammonia and HyDROCarbons
5.5 Market Dynamics
5.5.1 Drivers
5.5.1.1 Low Environmental Impact
5.5.1.2 Phasing Out CFC, HCFC, and HFC Refrigerants
5.5.1.3 Increasing Demand for Refrigeration and Air-Conditioning Applications
5.5.2 Restraints
5.5.2.1 Requirement of Higher Initial Capital Investment
5.5.2.2 Low Demand for Transcritical CO2 Systems
5.5.2.3 Flammability and Toxicity Issues
5.5.3 Opportunities
5.5.3.1 Effects of Global Warming
5.5.3.2 Lower Operating Cost of Transcritical CO2 Refrigerant Systems Along With Enhanced Performance
5.5.4 Challenges
5.5.4.1 Few Companies for the Purification of CO2 Refrigerants
5.5.4.2 Lack of Training and Awareness About Transcritical CO2 Refrigerant Systems Among Hvac Contractors and Technicians
5.6 Macroeconomic Indicators
5.6.1 Annual GDP Growth of Major Economies
5.6.1.1 Cold Storage
5.6.1.2 Construction
5.6.1.3 Manufacturing
5.7 Porter�s Five Forces Analysis
5.7.1 Threat of New Entrants
5.7.2 Bargaining Power of Suppliers
5.7.3 Threat of Substitutes
5.7.4 Bargaining Power of Buyers
5.7.5 Intensity of Rivalry
6 Transcritical CO2 Systems Market, By Function (Page No. - 43)
6.1 Introduction
6.2 Refrigeration
6.3 Heating
6.4 Air Conditioning
7 Transcritical CO2 Systems Market, By Application (Page No. - 48)
7.1 Introduction
7.2 Supermarkets & Convenience Stores
7.3 Heat Pumps
7.4 Food Processing & Storage Facilities
7.5 ICE Skating Rinks
7.6 Others
8 Regional Analysis (Page No. - 56)
8.1 Introduction
8.2 Europe
8.2.1 Germany
8.2.2 Norway
8.2.3 UK
8.2.4 Denmark
8.2.5 Switzerland
8.2.6 Sweden
8.2.7 Rest of Europe
8.3 Asia Pacific
8.3.1 Japan
8.3.2 China
8.3.3 New Zealand
8.3.4 Indonesia
8.3.5 Australia
8.3.6 Taiwan
8.3.7 Malaysia
8.4 North America
8.4.1 US
8.4.2 Canada
8.4.3 Mexico
8.5 Middle East & Africa
8.5.1 South Africa
8.5.2 Jordan
8.6 South America
8.6.1 Argentina
8.6.2 Chile
8.6.3 Brazil
8.6.4 Colombia
9 Competitive Landscape (Page No. - 98)
9.1 Introduction
9.2 Market Ranking Analysis
9.3 Competitive Situation & Trends
9.3.1 New Product Launches
9.3.2 Expansions
9.3.3 Partnerships & Joint Ventures
9.3.4 Agreements & Contracts
9.3.5 Mergers & Acquisitions
10 Company Profiles (Page No. - 107)
(Business Overview, Products Offered, Recent Developments, SWOT Analysis, MnM View)*
10.1 Advansor
10.2 Teko GmbH
10.3 Carrier Commercial Refrigeration
10.4 Green & Cool World Refrigeration AB
10.5 Hillphoenix, Inc.
10.6 Danfoss
10.7 Bitzer
10.8 Carnot Refrigeration
10.9 SCM Frigo S.P.A.
10.10 Emerson Climate Technologies
10.11 Panasonic Corporation
10.12 Baltimore Aircoil Company, Inc.
10.13 Henry Technologies, Inc.
10.14 Systemes LMP, Inc.
10.15 Mayekawa MFG. Co., Ltd.
10.16 Shecco SPRL
*Details on Business Overview, Products Offered, Recent Developments, SWOT Analysis, MnM View Might Not Be Captured in Case of Unlisted Companies.
11 Appendix (Page No. - 141)
11.1 Discussion Guide
11.2 Knowledge Store: Marketsandmarkets� Subscription Portal
11.3 Available Customizations
11.4 Related Reports
11.5 Author Details
List of Tables (108 Tables)
Table 1 Annual GDP Growth of Major Economies, 2012 to 2016
Table 2 Transcritical CO2 Systems Market, By Function, 2016�2023 (USD Million)
Table 3 Transcritical CO2 Systems Market, By Function, 2016�2023 (Number of Installations)
Table 4 Refrigeration Market Size, By Region, 2016�2023 (USD Million)
Table 5 Refrigeration Market Size, By Region, 2016�2023 (Number of Installations)
Table 6 Heating Market Size, By Region, 2016�2023 (USD Million)
Table 7 Heating Market Size, By Region, 2016�2023 (Number of Installations)
Table 8 Air Conditioning Market Size, By Region, 2016�2023 (USD Million)
Table 9 Air Conditioning Market Size, By Region, 2016�2023 (Number of Installations)
Table 10 Transcritical CO2 Systems Market, By Application, 2016�2023 (USD Million)
Table 11 Transcritical CO2 Systems Market, By Application, 2016�2023 (Number of Installations)
Table 12 Supermarkets & Convenience Stores Market Size, By Region, 2016�2023 (USD Million)
Table 13 Supermarkets & Convenience Stores Market Size, By Region, 2016�2023 (Number of Installations)
Table 14 Heat Pumps Market Size, By Region, 2016�2023 (USD Million)
Table 15 Heat Pumps Market Size, By Region, 2016�2023 (Number of Installations)
Table 16 Food Processing & Storage Facilities Market Size, By Region, 2016�2023 (USD Million)
Table 17 Food Processing & Storage Facilities Market Size, By Region, 2016�2023 (Number of Installations)
Table 18 ICE Skating Rinks Market Size, By Region, 2016�2023 (USD Million)
Table 19 ICE Skating Rinks Market Size, By Region, 2016�2023 (Number of Installations)
Table 20 Other Applications Market Size, By Region, 2016�2023 (USD Million)
Table 21 Other Applications Market Size, By Region, 2016�2023 (Number of Installations)
Table 22 Transcritical CO2 Systems Market, By Region, 2016�2023 (USD Million)
Table 23 Transcritical CO2 Systems Market, By Region, 2016�2023 (Number of Installations)
Table 24 Transcritical CO2 Systems Market, By Function, 2016�2023 (USD Million)
Table 25 Transcritical CO2 Systems Market, By Function, 2016�2023 (Number of Installations)
Table 26 Transcritical CO2 Systems Market, By Application, 2016�2023 (USD Million)
Table 27 Transcritical CO2 Systems Market, By Application, 2016�2023 (Number of Installations)
Table 28 Europe Transcritical CO2 Systems Market, By Country, 2016�2023 (USD Million)
Table 29 Europe Transcritical CO2 Systems Market, By Country, 2016�2023 (Number of Installations)
Table 30 Europe Transcritical CO2 Systems Market, By Function, 2016�2023 (USD Million)
Table 31 Europe Transcritical CO2 Systems Market, By Function, 2016�2023 (Number of Installations)
Table 32 Europe Transcritical CO2 Systems Market, By Application, 2016�2023 (USD Million)
Table 33 Europe Transcritical CO2 Systems Market, By Application, 2016�2023 (Number of Installations)
Table 34 Germany Transcritical CO2 Systems Market, By Application, 2016�2023 (USD Million)
Table 35 Germany Transcritical CO2 Systems Market, By Application, 2016�2023 (Number of Installations)
Table 36 Norway Transcritical CO2 Systems Market, By Application, 2016�2023 (USD Million)
Table 37 Norway Transcritical CO2 Systems Market, By Application, 2016�2023 (Number of Installations)
Table 38 UK Transcritical CO2 Systems Market, By Application, 2016�2023 (USD Million)
Table 39 UK Transcritical CO2 Systems Market, By Application, 2016�2023 (Number of Installations)
Table 40 Denmark Transcritical CO2 Systems Market, By Application, 2016�2023 (USD Million)
Table 41 Denmark Transcritical CO2 Systems Market, By Application, 2016�2023 (Number of Installations)
Table 42 Switzerland Transcritical CO2 Systems Market, By Application, 2016�2023 (USD Million)
Table 43 Switzerland Transcritical CO2 Systems Market, By Application, 2016�2023 (Number of Installations)
Table 44 Sweden Transcritical CO2 Systems Market, By Application, 2016�2023 (USD Million)
Table 45 Sweden Transcritical CO2 Systems Market, By Application, 2016�2023 (Number of Installations)
Table 46 Rest of Europe Transcritical CO2 Systems Market, By Application, 2016�2023 (USD Million)
Table 47 Rest of Europe Transcritical CO2 Systems Market, By Application, 2016�2023 (Number of Installations)
Table 48 Asia Pacific Transcritical CO2 Systems Market, By Country, 2016�2023 (USD Million)
Table 49 Asia Pacific Transcritical CO2 Systems Market, By Country, 2016�2023 (Number of Installations)
Table 50 Asia Pacific Transcritical CO2 Systems Market, By Function, 2016�2023 (USD Million)
Table 51 Asia Pacific Transcritical CO2 Systems Market, By Function, 2016�2023 (Number of Installations)
Table 52 Asia Pacific Transcritical CO2 Systems Market, By Application, 2016�2023 (USD Million)
Table 53 Asia Pacific Transcritical CO2 Systems Market, By Application, 2016�2023 (Number of Installations)
Table 54 Japan Transcritical CO2 Systems Market, By Application, 2016�2023 (USD Million)
Table 55 Japan Transcritical CO2 Systems Market, By Application, 2016�2023 (Number of Installations)
Table 56 China Transcritical CO2 Systems Market, By Application, 2016�2023 (USD Million)
Table 57 China Transcritical CO2 Systems Market, By Application, 2016�2023 (Number of Installations)
Table 58 New Zealand Transcritical CO2 Systems Market, By Application, 2016�2023 (USD Million)
Table 59 New Zealand Transcritical CO2 Systems Market, By Application, 2016�2023 (Number of Installations)
Table 60 Indonesia Transcritical CO2 Systems Market, By Application, 2016�2023 (USD Million)
Table 61 Indonesia Transcritical CO2 Systems Market, By Application, 2016�2023 (Number of Installations)
Table 62 Australia Transcritical CO2 Systems Market, By Application, 2016�2023 (USD Million)
Table 63 Australia Transcritical CO2 Systems Market, By Application, 2016�2023 (Number of Installations)
Table 64 Taiwan Transcritical CO2 Systems Market, By Application, 2016�2023 (USD Million)
Table 65 Taiwan Transcritical CO2 Systems Market, By Application, 2016�2023 (Number of Installations)
Table 66 Malaysia Transcritical CO2 Systems Market, By Application, 2016�2023 (USD Million)
Table 67 Malaysia Transcritical CO2 Systems Market, By Application, 2016�2023 (Number of Installations)
Table 68 North America Transcritical CO2 Systems Market, By Country, 2016�2023 (USD Million)
Table 69 North America Transcritical CO2 Systems Market, By Country, 2016�2023 (Number of Installations)
Table 70 North America Transcritical CO2 Systems Market, By Function, 2016�2023 (USD Million)
Table 71 North America Transcritical CO2 Systems Market, By Function, 2016�2023 (Number of Installations)
Table 72 North America Transcritical CO2 Systems Market, By Application, 2016�2023 (USD Million)
Table 73 North America Transcritical CO2 Systems Market, By Application, 2016�2023 (Number of Installations)
Table 74 US Transcritical CO2 Systems Market, By Application, 2016�2023 (USD Million)
Table 75 US Transcritical CO2 Systems Market, By Application, 2016�2023 (Number of Installations)
Table 76 Canada Transcritical CO2 Systems Market, By Application, 2016�2023 (USD Million)
Table 77 Canada Transcritical CO2 Systems Market, By Application, 2016�2023 (Number of Installations)
Table 78 Mexico Transcritical CO2 Systems Market, By Application, 2016�2023 (USD Million)
Table 79 Mexico Transcritical CO2 Systems Market, By Application, 2016�2023 (Number of Installations)
Table 80 Middle East & Africa Transcritical CO2 Systems Market, By Country, 2016�2023 (USD Million)
Table 81 Middle East & Africa Transcritical CO2 Systems Market, By Country, 2016�2023 (Number of Installations)
Table 82 Middle East & Africa Transcritical CO2 Systems Market, By Function, 2016�2023 (USD Million)
Table 83 Middle East & Africa Transcritical CO2 Systems Market, By Function, 2016�2023 (Number of Installations)
Table 84 Middle East & Africa Transcritical CO2 Systems Market, By Application, 2016�2023 (USD Million)
Table 85 Middle East & Africa Transcritical CO2 Systems Market, By Application, 2016�2023 (Number of Installations)
Table 86 South Africa Transcritical CO2 Systems Market, By Application, 2016�2023 (USD Million)
Table 87 South Africa Transcritical CO2 Systems Market, By Application, 2016�2023 (Number of Installations)
Table 88 Jordan Transcritical CO2 Systems Market, By Application, 2016�2023 (USD Million)
Table 89 Jordan Transcritical CO2 Systems Market, By Application, 2016�2023 (Number of Installations)
Table 90 South America Transcritical CO2 Systems Market, By Country, 2016�2023 (USD Million)
Table 91 South America Transcritical CO2 Systems Market, By Country, 2016�2023 (Number of Installations)
Table 92 South America Transcritical CO2 Systems Market, By Function, 2016�2023 (USD Million)
Table 93 South America Transcritical CO2 Systems Market, By Function, 2016�2023 (Number of Installations)
Table 94 South America Transcritical CO2 Systems Market, By Application, 2016�2023 (USD Million)
Table 95 South America Transcritical CO2 Systems Market, By Application, 2016�2023 (Number of Installations)
Table 96 Argentina Transcritical CO2 Systems Market, By Application, 2016�2023 (USD Million)
Table 97 Argentina Transcritical CO2 Systems Market, By Application, 2016�2023 (Number of Installations)
Table 98 Chile Transcritical CO2 Systems Market, By Application, 2016�2023 (USD Million)
Table 99 Chile Transcritical CO2 Systems Market, By Application, 2016�2023 (Number of Installations)
Table 100 Brazil Transcritical CO2 Systems Market, By Application, 2016�2023 (USD Million)
Table 101 Brazil Transcritical CO2 Systems Market, By Application, 2016�2023 (Number of Installations)
Table 102 Colombia Transcritical CO2 Systems Market, By Application, 2016�2023 (USD Million)
Table 103 Colombia Transcritical CO2 Systems Market, By Application, 2016�2023 (Number of Installations)
Table 104 New Product Launches, 2013�2018
Table 105 Expansions, 2013�2018
Table 106 Partnerships & Joint Ventures, 2013�2018
Table 107 Agreements & Contracts, 2013�2018
Table 108 Mergers & Acquisitions, 2013�2018
List of Figures (30 Figures)
Figure 1 Transcritical CO2 Systems Market: Research Design
Figure 2 Market Size Estimation: Bottom-Up Approach
Figure 3 Market Size Estimation: Top-Down Approach
Figure 4 Transcritical CO2 Systems Market: Data Triangulation
Figure 5 Refrigeration Segment to Lead Transcritical CO2 Systems Market Between 2018 and 2023
Figure 6 Supermarkets & Convenience Stores Segment to Lead Transcritical CO2 Systems Market During Forecast Period
Figure 7 Europe Estimated to Lead Transcritical CO2 Systems Market in 2018
Figure 8 Growth of Supermarket Application Expected to Drive Transcritical CO2 Systems Market Between 2018 and 2023
Figure 9 Transcritical CO2 Systems Market in Middle East & Africa Projected to Grow at Highest CAGR During Forecast Period
Figure 10 Application Segment Estimated to Account for Largest Share of Europe Transcritical CO2 Systems Market in 2018
Figure 11 Segment Estimated to Account for Largest Share of Transcritical CO2 Systems Market Across All Regions in 2018
Figure 12 Japan Projected to Lead Transcritical CO2 Systems Market Between 2018 and 2023
Figure 13 Drivers, Restraints, Opportunities, and Challenges in the Transcritical CO2 Systems Market
Figure 14 Cold Storage Construction Market, 2016 & 2021
Figure 15 Construction Industry Growth Rate, 2014
Figure 16 Manufacturing Industry Growth Rate, 2014
Figure 17 Porter�s Five Forces Analysis: Transcritical CO2 Systems Market
Figure 18 Refrigeration Function Segment Projected to Lead Transcritical CO2 Systems Market During Forecast Period
Figure 19 Supermarkets & Convenience Stores Application Segment Projected to Lead Transcritical CO2 Systems Market During Forecast Period
Figure 20 Regional Snapshot
Figure 21 Europe Transcritical CO2 Systems Market Snapshot
Figure 22 Asia Pacific Transcritical CO2 Systems Market Snapshot
Figure 23 North America Transcritical CO2 Systems Market Snapshot
Figure 24 Middle East & Africa Transcritical CO2 Systems Market Snapshot
Figure 25 South America Transcritical CO2 Systems Market Snapshot
Figure 26 Companies Have Adopted Organic Growth Strategies Between 2013 and 2018 to Strengthen Their Position in Transcritical CO2 Systems Market
Figure 27 Transcritical CO2 Systems Market Ranking, By Company, 2018
Figure 28 Danfoss: Company Snapshot
Figure 29 Emerson Climate Technologies: Company Snapshot
Figure 30 Panasonic Corporation: Company Snapshot
The study involved 4 major activities to estimate the current market size of transcritical CO2 systems. Exhaustive secondary research was done to collect information on market, peer market, and parent market. The next step was to validate these findings, assumptions, and sizing with industry experts across the value chain through primary research. Both, top-down and bottom-up approaches were employed to estimate the complete market size. Thereafter, market breakdown and data triangulation procedures were used to estimate the market size of segments and subsegments.
Secondary Research
As a part of the secondary research process, various secondary sources, such as Hoovers, Bloomberg BusinessWeek, and Dun & Bradstreet were referred to identify and collect information for this study. The secondary sources included annual reports, press releases & investor presentations of companies, white papers, certified publications, and articles from recognized authors, authenticated directories, and databases.
Secondary research was mainly conducted to obtain key information about the industry�s supply chain, market�s monetary chain, total pool of players, and market classification and segmentation according to industry trends to the bottom-most level, regional markets, and key developments from both, market- and technology-oriented perspectives.
Primary Research
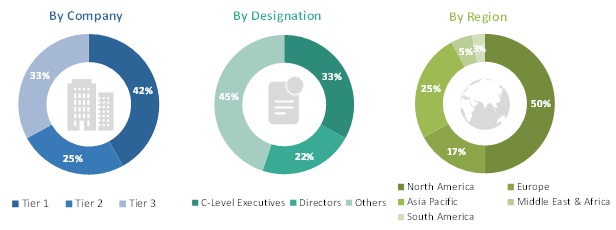
As a part of the primary research process, various primary sources from both, supply and demand sides were interviewed to obtain qualitative and quantitative information for this report. Primary sources from the supply side included industry experts, such as CEOs, vice presidents, marketing directors, technology and innovation directors, and related key executives from various key companies and organizations operating in the transcritical CO2 systems market. Primary sources from the demand side included directors, marketing heads, and purchase managers from end-use industries. Following is the breakdown of primary respondents.
To know about the assumptions considered for the study, download the pdf brochure
Market Size Estimation
Both, top-down and bottom-up approaches were used to estimate and validate the total size of the transcritical CO2 systems market. These methods were also used extensively to estimate the size of various subsegments in the market. The research methodology used to estimate the market size includes the following:
- The key players in the industry and markets have been identified through extensive secondary research.
- The industry�s supply chain and market size, in terms of volume and value, have been determined through primary and secondary research processes.
- All percentage shares, splits, and breakdowns have been determined using secondary sources and verified through primary sources.
Data Triangulation
After arriving at the overall size from the market size estimation process explained above, the total market was split into several segments and subsegments. To complete the overall market engineering process, and to arrive at the exact statistics for all segments and subsegments, data triangulation and market breakdown procedures were used, wherever applicable. The data were triangulated by studying various factors and trends from both, the demand and supply sides. In addition to this, the market was validated using both, top-down and bottom-up approaches.
Report Objectives
- To define, describe, and forecast the global transcritical CO2 systems market based on function, application, and region
- To strategically analyze micromarkets with respect to individual growth trends, prospects, and contribution to the total market
- To analyze the opportunities in the market for stakeholders and draw a competitive landscape of the market
- To forecast the market size in terms of value with respect to main regions (along with countries), namely, Asia Pacific, North America, Europe, Middle East & Africa, and South America
- To strategically profile key players and comprehensively analyze their market shares and core competencies
- To analyze competitive developments, such as joint ventures, mergers & acquisitions, new product developments, and Research & Development (R&D) activities in the global transcritical CO2 systems market
The following customization options are available for the report:
- Further breakdown of Asia Pacific & Europe transcritical CO2 systems markets
- Company information
- Detailed analysis and profiles of additional market players (up to 3)


Growth opportunities and latent adjacency in Transcritical CO2 Systems Market
Transcritical CO2 systems
Entire value chain for refrigerations present in various market studies
Specific information on booster systems, cascade systems and condensing unit
Commercial refrigerant market
Looking for list of potential customers for ice generators and suppliers of condensing units.