Molded Plastics Market

Molded Plastics Market by Type (PE, PP, PVC, PET, PS, PU), Application (Packaging, Automotive & Transportation, Construction & Infrastructure, Electronics & Electrical, Pharmaceutical, Agriculture), and Region - Global Forecast to 2027

Report Code: CH 6279 Nov, 2022, by marketsandmarkets.com

The Molded Plastics Market is projected to reach USD 675.7 billion by 2027 from USD 499.1 billion in 2022, at a cagr 6.2% during the forecast period. The overall increase in demand for molded plastics in emerging regions such as Asia Pacific and Middle East & Africa is driving the molded plastics market. Rising demand from end-use industries including, packaging, automotive, construction, and agriculture is driving the global molded plastics market.

Global Molded Plastics Market Trends
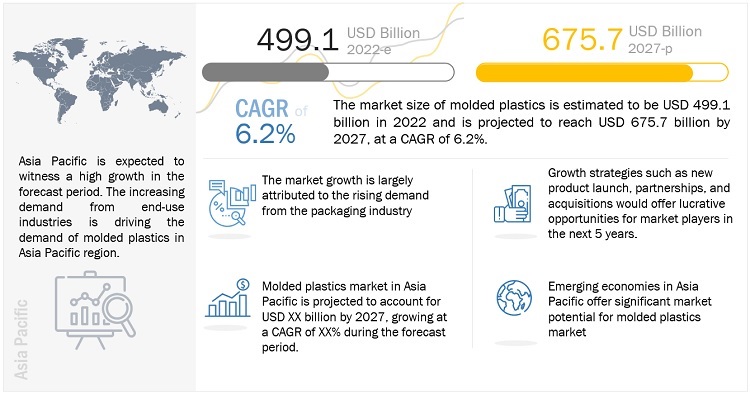
molded-plastic-market

Note: e-estimated, p-projected

Source: Expert Interviews, Secondary Sources, and MarketsandMarkets Analysis

To know about the assumptions considered for the study, Request for Free Sample Report

Molded Plastics Market Dynamics

Driver: Rising demand from packaging industry

Molded plastics are largely utilized in the packaging and automotive industries. The packaging industry is a major consumer of molded plastics. The commonly used molded plastics in packaging application include PE, PP, and PET. These plastic products, which can be rigid or flexible depending on the end-use requirements, are used in various packaging applications, including food & beverage, pharmaceutical, and cosmetics. The different molding technologies, including blow molding, injection molding, and extrusion molding, offer various advantages, such as durability, medical safety & effectiveness, and food preservation. Owing to these benefits over other materials (such as metals, glass, and paper), plastic packaging has found universal use. Products manufactured through blow molding technology are replacing traditional materials. Cold-filled beverage containers, drinking water bottles, alcohol beverage containers, soft drink containers, and dairy containers are being preferred in the food & beverage industry, thus driving the demand for molded plastics.

Restrain: Stringent Regulations

Plastic waste harms the ecosystem as it takes decades to decompose. Governments worldwide are addressing this issue by imposing strict laws that the plastics industry is subjected to adhering to. Governments in Europe have undertaken various measures to deal with packaging waste and recycling issues. In developing nations, governments have become more cautious about protecting the environment, wherein steps are being taken to promote sustainable packaging. As these laws prohibit companies from sourcing raw materials, which fail to comply with environmental legislation, the cost of raw materials is higher, thereby increasing the operational costs. This affects the overall plastic packaging revenues, which hinders the growth of the plastic injection molding industry.

Opportunity: Rising adoption of 3D printing plastic composities

The growing adoption of 3D printing technology in commercial applications is supporting the growth of 3D printing plastic composites globally. These grades offer optimum performance in extreme conditions such as corrosive and high temperature/pressure environments. The composite grades of plastics after some value additions, such as carbon fibers, offer improved performance. Commonly used molded plastics in 3D printing plastic composites include PA, ABS, and PC. Some of the popular grades of 3D printing plastic composites include PC-ABS, stainless steel-PLA, and carbon fiber-PLA. Major manufacturers of molded plastics, such as SABIC, have started manufacturing 3D printing plastics by carrying out forward integration in the last few years. The growth in the demand for 3D printing plastic composites will provide growth opportunities for the molded plastics market.

Challenge: High cost of recycling

The percentage of plastic recycling is growing at a slower rate. According to the World Economic, the widely circulated statistic states that only 5 to 6% of plastic waste is recycled instead of 9% as estimated. In 2020, the US witnessed a decrease by 5.7% in recycled plastic waste as compared to 2019. The major reason for the slow growth of plastic recycling is the high costs associated with recycling of plastic, as compared to other materials such as paper and glass. According to Eurostat, the average prices of recycling secondary materials were: 55 EUR/tonne for glass, 104 EUR/tonne for paper and cardboard and 245 EUR/tonne for plastic in 2020. Furthermore, glass, metal, and plastic cannot be repeatedly recycled without degrading in quality. However, plastic recycling is one of the major challenges in the overall plastics industry, which can affect the growth of the molded plastics market.

Polyethylene segment accounted for the largest share amongst type in the molded plastics market

Polyethylene based molded plastics are among the most dominant plastics owing to their superior properties such as high impact strength, insulation, good heat resistance, flame retardancy, environmental stress cracking resistance (ESCR), high load melt strength, and excellent rigidity. BASF and DuPont are the two leading suppliers of PE for engineering applications.

Injection molded plastics market segment is projected to grow the fastest amongst technologies in the overall molded plastics market

Injection molding is the most dominated and popular technology for the molded plastics. This technology is widely used in multiple end use industries such as packaging, automotive, construction, agriculture, and electronics for mass production. Additionally, it’s automated process minimize the waste produced during the manufacturing process thereby, reducing the manufacturing cost. These factors are driving the growth of the injection molded plastics market.

Packaging application accounted for the largest market share amongst all the applications in the molded plastics market

Packaging accounted for the largest market share in applications in the molded plastics market. The dominant market position is attributed to the exponential growth in demand for molded plastics in the packaging applications. With the increasing trade globally, changing in lifestyle and buying pattern, the demand for effective, efficient, and sustainable packaging increased. These factors are expected to drive the molded plastics market during the forecast period.

Asia Pacific is estimated to grow at the fastest growth rate in the global molded plastics market

The Asia Pacific region accounted for the largest market share in 2021 and is also expected to grow at the highest CAGR, during the forecast period. The increase in demand in the region for molded plastics can be largely attributed to the growing population, urbanization & industrialization. Besides, there are less stringent norms and standards for the use of raw materials for the manufacturing of molded plastics, along with the easy availability of cheap labor, which is attracting the major players to expand their operations in the region. Furthermore, the increase in demand for plastics from the emerging economies of Asia Pacific is expected to boost the market for molded plastics as well.
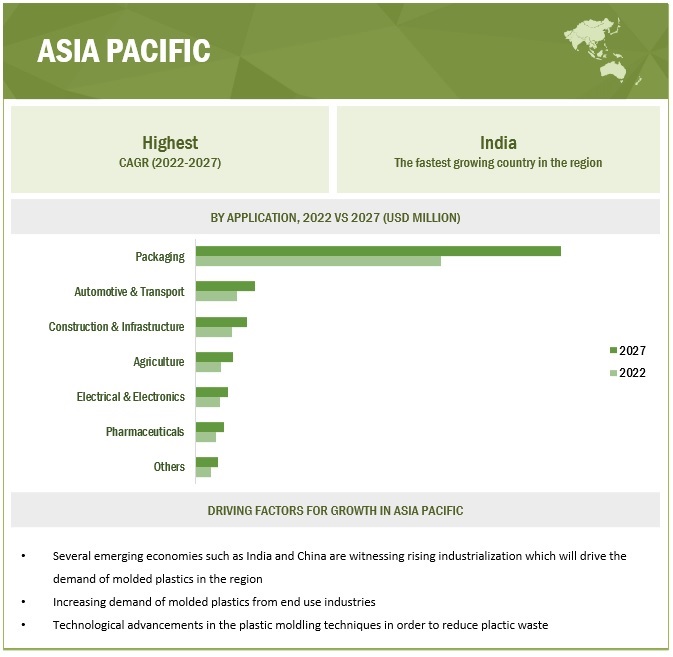
molded-plastic-market by Region

Source: Secondary Research, Primary Interviews, and MarketsandMarkets Analysis

To know about the assumptions considered for the study, download the pdf brochure

Key Market Players

The key players in the molded plastics market LyondellBasell (Netherlands), SABIC (Saudi Arabia), INEOS (Switzerland), DuPont (US), ExxonMobil (US), Sinopec (China), Dow Inc (US), BASF SE (Germany), Eastman Chemical Company (US), Chevron Corporation (US), Formosa Plastics Corporation (Taiwan), Solvay (Belgium), China Plastics Extrusion Ltd. (China), Lanxess AG (Germany), Versalis(Italy), LG Chem(South Korea) and Reliance Industries (India). These players have established a strong foothold in the market by adopting strategies, such as new product launches, strategic partnerships, investment & expansions, and acquisitions between 2019 and 2022.

Molded Plastics Market Report Scope

Report Metric

Details

Years considered for the study

2018–2027

Base year considered

2021

Forecast period

2022–2027

Units considered

Value (USD Million/USD Billion) and Volume (KT/Tons)

Segments

Type, Technology, Application, and Region

Regions

North America, Asia Pacific, Europe, Middle East & Africa, and Latin America

Companies

LyondellBasell (Netherlands), SABIC (Saudi Arabia), INEOS (Switzerland), DuPont (US), ExxonMobil (US), Sinopec (China), Dow Inc (US), BASF SE (Germany), Eastman Chemical Company (US), Chevron Corporation (US), Formosa Plastics Corporation (Taiwan), Solvay (Belgium), China Plastics Extrusion Ltd. (China), Lanxess AG (Germany), Versalis (Italy), LG Chem (South Korea) and Reliance Industries (India)
Total 27 players covered.

This research report categorizes the molded plastics market based on type, technology, application, and region.

By Type:

By Technology:

  • Injection Molding
  • Blow Molding
  • Extrusion Molding
  • Thermoforming
  • Rotational Molding
  • Others

By Application:

  • Packaging
  • Automotive & Transportation
  • Construction & Infrastructure
  • Agriculture
  • Pharmaceuticals
  • Electrical & Electronics
  • Others

By Region:

  • North America
  • Asia Pacific
  • Europe
  • Middle East & Africa
  • Latin America
  • The molded plastics market has been further analyzed based on key countries in each of these regions.

Recent Developments

  • In June 2021, LyondellBasell announced the successful startup of Ulsan PP Co., Ltd.’s polypropylene production facility, with a capacity of 400 kilotons per annum (KTA), in South Korea. Ulsan PP Co., Ltd. is a joint venture between PolyMirae Company Ltd. (a 50:50 partnership between LyondellBasell and DL Chemical) and SK Advanced. This move complements LyondellBasell’s reach into the polypropylene production market and provides the company with a strong foundation for growth in adjacent sectors.
  • In July 2022, INEOS signed three petrochemical deals (aggregate value of USD 7 billion) with Sinopec to strengthen its presence in China.

Frequently Asked Questions (FAQ):

To speak to our analyst for a discussion on the above findings, click Speak to Analyst

Exclusive indicates content/data unique to MarketsandMarkets and not available with any competitors.

 
TABLE OF CONTENTS
 
1 INTRODUCTION (Page No. - 32)
    1.1 STUDY OBJECTIVES 
    1.2 MARKET DEFINITION 
    1.3 INCLUSIONS AND EXCLUSIONS 
          TABLE 1 MOLDED PLASTICS MARKET: INCLUSIONS AND EXCLUSIONS
    1.4 MARKET SCOPE 
           1.4.1 MARKET SEGMENTATION
           1.4.2 REGIONS COVERED
           1.4.3 YEARS CONSIDERED
    1.5 CURRENCY CONSIDERED 
    1.6 UNIT CONSIDERED 
    1.7 STAKEHOLDERS 
    1.8 SUMMARY OF CHANGES 
 
2 RESEARCH METHODOLOGY (Page No. - 36)
    2.1 RESEARCH DATA 
          FIGURE 1 MOLDED PLASTICS MARKET: RESEARCH DESIGN
           2.1.1 SECONDARY DATA
                    2.1.1.1 List of major secondary sources
                    2.1.1.2 Key data from secondary sources
           2.1.2 PRIMARY DATA
                    2.1.2.1 Key data from primary sources
           2.1.3 PRIMARY INTERVIEWS
                    2.1.3.1 Primary interviews–Demand and supply sides
                    2.1.3.2 Key industry insights
                    2.1.3.3 Breakdown of primary interviews
    2.2 MARKET SIZE ESTIMATION 
          FIGURE 2 MARKET SIZE ESTIMATION: APPROACH 1
          FIGURE 3 MARKET SIZE ESTIMATION: APPROACH 2
           2.2.1 TOP-DOWN APPROACH
                    2.2.1.1 Approach for arriving at market size using top-down analysis
                                FIGURE 4 TOP-DOWN APPROACH
           2.2.2 BOTTOM-UP APPROACH
                    2.2.2.1 Approach for arriving at market size using bottom-up analysis
                                FIGURE 5 BOTTOM-UP APPROACH
    2.3 DATA TRIANGULATION 
          FIGURE 6 MOLDED PLASTICS MARKET: DATA TRIANGULATION
    2.4 FACTOR ANALYSIS 
    2.5 RESEARCH ASSUMPTIONS 
    2.6 RESEARCH LIMITATIONS AND RISKS 
 
3 EXECUTIVE SUMMARY (Page No. - 48)
    FIGURE 7 POLYETHYLENE TO BE LARGEST TYPE OF MOLDED PLASTIC BETWEEN 2022 AND 2027
    FIGURE 8 PACKAGING TO BE LARGEST AND FASTEST-GROWING APPLICATION OF MOLDED PLASTICS
    FIGURE 9 INJECTION MOLDING TECHNOLOGY TO LEAD MOLDED PLASTICS MARKET
    FIGURE 10 ASIA PACIFIC LED MOLDED PLASTICS MARKET IN 2021
 
4 PREMIUM INSIGHTS (Page No. - 52)
    4.1 ATTRACTIVE OPPORTUNITIES FOR MARKET PLAYERS IN MOLDED PLASTICS MARKET 
          FIGURE 11 ASIA PACIFIC TO DRIVE MOLDED PLASTICS MARKET
    4.2 MOLDED PLASTICS MARKET, BY TYPE 
          FIGURE 12 POLYETHYLENE TO BE FASTEST-GROWING TYPE OF MOLDED PLASTIC
    4.3 MOLDED PLASTICS MARKET, BY TECHNOLOGY 
          FIGURE 13 INJECTION MOLDING TO BE FASTEST-GROWING TECHNOLOGY FOR MOLDED PLASTICS
    4.4 MOLDED PLASTICS MARKET, BY APPLICATION 
          FIGURE 14 PACKAGING TO BE FASTEST-GROWING APPLICATION OF MOLDED PLASTICS
    4.5 ASIA PACIFIC MOLDED PLASTICS MARKET, BY APPLICATION AND COUNTRY, 2021 
          FIGURE 15 PACKAGING SEGMENT AND CHINA ACCOUNTED FOR LARGEST SHARES
    4.6 MOLDED PLASTICS MARKET, BY KEY COUNTRIES 
          FIGURE 16 INDIA TO REGISTER HIGHEST CAGR DURING FORECAST PERIOD
 
5 MARKET OVERVIEW (Page No. - 55)
    5.1 INTRODUCTION 
    5.2 MARKET DYNAMICS 
          FIGURE 17 DRIVERS, RESTRAINTS, OPPORTUNITIES, AND CHALLENGES IN MOLDED PLASTICS MARKET
           5.2.1 DRIVERS
                    5.2.1.1 Rising demand from packaging application
                    5.2.1.2 Growth of automotive industry
                                TABLE 2 VEHICLE PRODUCTION, BY COUNTRY, 2021 (MILLION UNITS)
                    5.2.1.3 Positive outlook for construction industry
                    5.2.1.4 Increasing demand for sustainable plastics
                                TABLE 3 BIOPLASTIC AND CONVENTIONAL PLASTIC PROPERTIES
                                TABLE 4 PACKAGING-RELATED COMMITMENTS BY END USERS
           5.2.2 RESTRAINTS
                    5.2.2.1 Stringent regulations
                                TABLE 5 KEY REGULATORY CHANGES LIKELY TO IMPACT MOLDED PLASTICS MARKET
                                TABLE 6 KEY MOLDED PLASTICS MARKET PLAYERS’ FOCUS ON BIO-BASED PLASTICS
                    5.2.2.2 Volatility in raw material prices
                                TABLE 7 MOLDED PLASTICS MARKET: PRICE INCREASE BY VARIOUS SUPPLIERS IN 2020–2022
                                FIGURE 18 CRUDE OIL PRICES, 2016–2021 (USD/BARREL)
           5.2.3 OPPORTUNITIES
                    5.2.3.1 Rising population and urbanization in emerging economies
                    5.2.3.2 Increasing demand for electric vehicles
                                TABLE 8 ANNOUNCEMENTS REGARDING ELECTRIC VEHICLES BY KEY AUTOMAKERS
                    5.2.3.3 Rising adoption of 3D printing plastic composites
           5.2.4 CHALLENGES
                    5.2.4.1 Disposal of molded plastics
                    5.2.4.2 High cost of recycling
                                FIGURE 19 AVERAGE PRICE OF RECYCLING, BY MATERIAL, EU-27, 2012–2020 (EUR/TONNE)
    5.3 PORTER'S FIVE FORCES ANALYSIS 
          FIGURE 20 PORTER'S FIVE FORCES ANALYSIS OF MOLDED PLASTICS MARKET
           5.3.1 THREAT OF NEW ENTRANTS
           5.3.2 THREAT OF SUBSTITUTES
           5.3.3 BARGAINING POWER OF SUPPLIERS
           5.3.4 BARGAINING POWER OF BUYERS
           5.3.5 INTENSITY OF COMPETITIVE RIVALRY
                    TABLE 9 IMPACT OF PORTER'S FIVE FORCES ON MOLDED PLASTICS MARKET
    5.4 VALUE CHAIN 
          FIGURE 21 VALUE CHAIN ANALYSIS
           5.4.1 RAW MATERIAL SUPPLIERS
           5.4.2 ADDITIVE SUPPLIERS
                    5.4.2.1 Fillers
                    5.4.2.2 Pigments
                    5.4.2.3 Additives
           5.4.3 POLYMER MANUFACTURERS
           5.4.4 MOLDERS/COMPOUNDERS
           5.4.5 DISTRIBUTORS
           5.4.6 END CONSUMERS
    5.5 REGULATIONS 
           5.5.1 NORTH AMERICA
           5.5.2 ASIA PACIFIC
           5.5.3 EUROPE
           5.5.4 REGULATORY BODIES, GOVERNMENT AGENCIES, AND OTHER ORGANIZATIONS
                    TABLE 10 REGULATORY BODIES, GOVERNMENT AGENCIES, AND OTHER ORGANIZATIONS
    5.6 TRADE ANALYSIS 
           5.6.1 IMPORT-EXPORT SCENARIO OF MOLDED PLASTICS
                    TABLE 11 IMPORT TRADE DATA FOR PLASTICS AND RELATED ARTICLES (USD MILLION)
                    TABLE 12 EXPORT TRADE DATA FOR PLASTICS AND RELATED ARTICLES (USD MILLION)
    5.7 ECOSYSTEM OF MOLDED PLASTICS MARKET 
          FIGURE 22 ECOSYSTEM MAP
          TABLE 13 MOLDED PLASTICS ECOSYSTEM
    5.8 TECHNOLOGY ANALYSIS 
           5.8.1 MULTI-MATERIAL INJECTION MOLDING
           5.8.2 STRUCTURAL FOAM MOLDING
    5.9 PRICING ANALYSIS 
           5.9.1 AVERAGE PRICING TREND, BY REGION
                    FIGURE 23 AVERAGE SELLING PRICE BASED ON REGION (USD/KT)
           5.9.2 AVERAGE PRICING TREND, BY APPLICATION
                    TABLE 14 AVERAGE SELLING PRICE BASED ON APPLICATION (USD/KT)
           5.9.3 TOP FIVE PLAYERS’ PRICING TREND
                    FIGURE 24 TOP FIVE PLAYERS’ PRICING TREND
    5.10 CASE STUDIES 
           5.10.1 DUPONT
           5.10.2 EXXONMOBIL
    5.11 TRENDS/DISRUPTIONS IMPACTING CUSTOMER'S BUSINESS 
           FIGURE 25 TRENDS/DISRUPTIONS IN MOLDED PLASTICS MARKET
    5.12 KEY CONFERENCES AND EVENTS IN 2022–2023 
           TABLE 15 KEY CONFERENCES AND EVENTS, 2022–2023
    5.13 PATENT ANALYSIS 
           5.13.1 INTRODUCTION
           5.13.2 METHODOLOGY
           5.13.3 DOCUMENT TYPE
                     TABLE 16 TOTAL NUMBER OF PATENTS IN LAST 10 YEARS
                     FIGURE 26 PUBLICATION TRENDS, 2011–2021
           5.13.4 INSIGHTS
           5.13.5 LEGAL STATUS OF PATENTS
                     FIGURE 27 LEGAL STATUS OF PATENTS
           5.13.6 JURISDICTION ANALYSIS
                     FIGURE 28 TOP JURISDICTIONS
           5.13.7 TOP COMPANIES/APPLICANTS
                     FIGURE 29 KEY PATENT APPLICANTS
                     TABLE 17 LIST OF PATENTS BY BASF SE
                     TABLE 18 LIST OF PATENTS BY KRONES AG
                     TABLE 19 TOP 10 PATENT OWNERS (US) IN LAST 10 YEARS
    5.14 KEY FACTORS AFFECTING BUYING DECISION 
           5.14.1 QUALITY
           5.14.2 SERVICE
                     FIGURE 30 SUPPLIER SELECTION CRITERION
    5.15 MACROECONOMIC INDICATORS 
           5.15.1 GDP TRENDS AND FORECASTS OF MAJOR ECONOMIES
                     TABLE 20 GDP TRENDS AND FORECASTS, PERCENTAGE CHANGE OF KEY COUNTRIES, 2019–2027
 
6 MOLDED PLASTICS MARKET, BY TECHNOLOGY (Page No. - 84)
    6.1 INTRODUCTION 
          TABLE 21 MOLDED PLASTICS MARKET SIZE, BY TECHNOLOGY, 2018–2021 (KILOTON)
          TABLE 22 MOLDED PLASTICS MARKET SIZE, BY TECHNOLOGY, 2018–2021 (USD MILLION)
          TABLE 23 MOLDED PLASTICS MARKET SIZE, BY TECHNOLOGY, 2022–2027 (KILOTON)
          TABLE 24 MOLDED PLASTICS MARKET SIZE, BY TECHNOLOGY, 2022–2027 (USD MILLION)
    6.2 BLOW MOLDING 
    6.3 INJECTION MOLDING 
    6.4 EXTRUSION MOLDING 
    6.5 ROTATIONAL MOLDING 
    6.6 THERMOFORMING 
 
7 MOLDED PLASTICS MARKET, BY TYPE (Page No. - 89)
    7.1 INTRODUCTION 
          FIGURE 31 POLYETHYLENE TO BE LARGEST TYPE OF MOLDED PLASTICS
          TABLE 25 MOLDED PLASTICS MARKET SIZE, BY TYPE, 2018–2021 (KILOTON)
          TABLE 26 MOLDED PLASTICS MARKET SIZE, BY TYPE, 2018–2021 (USD MILLION)
          TABLE 27 MOLDED PLASTICS MARKET SIZE, BY TYPE, 2022–2027 (KILOTON)
          TABLE 28 MOLDED PLASTICS MARKET SIZE, BY TYPE, 2022–2027 (USD MILLION)
    7.2 POLYETHYLENE (PE) 
    7.3 POLYPROPYLENE (PP) 
    7.4 POLYVINYL CHLORIDE (PVC) 
    7.5 POLYETHYLENE TEREPHTHALATE (PET) 
    7.6 POLYSTYRENE (PS) 
    7.7 POLYURETHANE (PU) 
    7.8 OTHERS 
 
8 MOLDED PLASTICS MARKET, BY APPLICATION (Page No. - 95)
    8.1 INTRODUCTION 
          TABLE 29 KEY PLAYERS CATERING TO VARIOUS APPLICATIONS
          FIGURE 32 PACKAGING TO BE LARGEST APPLICATION OF MOLDED PLASTICS
          TABLE 30 MOLDED PLASTICS MARKET SIZE, BY APPLICATION, 2018–2021 (KILOTON)
          TABLE 31 MOLDED PLASTICS MARKET SIZE, BY APPLICATION, 2018–2021 (USD MILLION)
          TABLE 32 MOLDED PLASTICS MARKET SIZE, BY APPLICATION, 2022–2027 (KILOTON)
          TABLE 33 MOLDED PLASTICS MARKET SIZE, BY APPLICATION, 2022–2027 (USD MILLION)
    8.2 PACKAGING 
    8.3 AUTOMOTIVE & TRANSPORTATION 
    8.4 CONSTRUCTION & INFRASTRUCTURE 
    8.5 AGRICULTURE 
    8.6 PHARMACEUTICALS 
    8.7 ELECTRICAL & ELECTRONICS 
    8.8 OTHERS 
 
9 MOLDED PLASTICS MARKET, BY REGION (Page No. - 102)
    9.1 INTRODUCTION 
          FIGURE 33 ASIA PACIFIC TO BE FASTEST-GROWING MARKET DURING FORECAST PERIOD
          TABLE 34 MOLDED PLASTICS MARKET SIZE, BY REGION, 2018–2021 (KILOTON)
          TABLE 35 MOLDED PLASTICS MARKET SIZE, BY REGION, 2018–2021 (USD MILLION)
          TABLE 36 MOLDED PLASTICS MARKET SIZE, BY REGION, 2022–2027 (KILOTON)
          TABLE 37 MOLDED PLASTICS MARKET SIZE, BY REGION, 2022–2027 (USD MILLION)
    9.2 ASIA PACIFIC 
          FIGURE 34 ASIA PACIFIC: MOLDED PLASTICS MARKET SNAPSHOT
          TABLE 38 ASIA PACIFIC: MOLDED PLASTICS MARKET SIZE, BY COUNTRY, 2018–2021 (KILOTON)
          TABLE 39 ASIA PACIFIC: MOLDED PLASTICS MARKET SIZE, BY COUNTRY, 2018–2021 (USD MILLION)
          TABLE 40 ASIA PACIFIC: MOLDED PLASTICS MARKET SIZE, BY COUNTRY, 2022–2027 (KILOTON)
          TABLE 41 ASIA PACIFIC: MOLDED PLASTICS MARKET SIZE, BY COUNTRY, 2022–2027 (USD MILLION)
          TABLE 42 ASIA PACIFIC: MOLDED PLASTICS MARKET SIZE, BY TYPE, 2018–2021 (KILOTON)
          TABLE 43 ASIA PACIFIC: MOLDED PLASTICS MARKET SIZE, BY TYPE, 2018–2021 (USD MILLION)
          TABLE 44 ASIA PACIFIC: MOLDED PLASTICS MARKET SIZE, BY TYPE, 2022–2027 (KILOTON)
          TABLE 45 ASIA PACIFIC: MOLDED PLASTICS MARKET SIZE, BY TYPE, 2022–2027 (USD MILLION)
          TABLE 46 ASIA PACIFIC: MOLDED PLASTICS MARKET SIZE, BY APPLICATION, 2018–2021 (KILOTON)
          TABLE 47 ASIA PACIFIC: MOLDED PLASTICS MARKET SIZE, BY APPLICATION, 2018–2021 (USD MILLION)
          TABLE 48 ASIA PACIFIC: MOLDED PLASTICS MARKET SIZE, BY APPLICATION, 2022–2027 (KILOTON)
          TABLE 49 ASIA PACIFIC: MOLDED PLASTICS MARKET SIZE, BY APPLICATION, 2022–2027 (USD MILLION)
           9.2.1 CHINA
                    9.2.1.1 Largest market in Asia Pacific
                                TABLE 50 CHINA: MOLDED PLASTICS MARKET SIZE, BY APPLICATION, 2018–2021 (KILOTON)
                                TABLE 51 CHINA: MOLDED PLASTICS MARKET SIZE, BY APPLICATION, 2018–2021 (USD MILLION)
                                TABLE 52 CHINA: MOLDED PLASTICS MARKET SIZE, BY APPLICATION, 2022–2027 (KILOTON)
                                TABLE 53 CHINA: MOLDED PLASTICS MARKET SIZE, BY APPLICATION, 2022–2027 (USD MILLION)
           9.2.2 JAPAN
                    9.2.2.1 Strong industrial sector to boost market
                                TABLE 54 JAPAN: MOLDED PLASTICS MARKET SIZE, BY APPLICATION, 2018–2021 (KILOTON)
                                TABLE 55 JAPAN: MOLDED PLASTICS MARKET SIZE, BY APPLICATION, 2018–2021 (USD MILLION)
                                TABLE 56 JAPAN: MOLDED PLASTICS MARKET SIZE, BY APPLICATION, 2022–2027 (KILOTON)
                                TABLE 57 JAPAN: MOLDED PLASTICS MARKET SIZE, BY APPLICATION, 2022–2027 (USD MILLION)
           9.2.3 INDIA
                    9.2.3.1 Positive economic outlook and government initiatives to fuel demand
                                TABLE 58 INDIA: MOLDED PLASTICS MARKET SIZE, BY APPLICATION, 2018–2021 (KILOTON)
                                TABLE 59 INDIA: MOLDED PLASTICS MARKET SIZE, BY APPLICATION, 2018–2021 (USD MILLION)
                                TABLE 60 INDIA: MOLDED PLASTICS MARKET SIZE, BY APPLICATION, 2022–2027 (KILOTON)
                                TABLE 61 INDIA: MOLDED PLASTICS MARKET SIZE, BY APPLICATION, 2022–2027 (USD MILLION)
           9.2.4 SOUTH KOREA
                    9.2.4.1 Skilled workforce and manufacturing sector to favor market growth
                                TABLE 62 SOUTH KOREA: MOLDED PLASTICS MARKET SIZE, BY APPLICATION, 2018–2021 (KILOTON)
                                TABLE 63 SOUTH KOREA: MOLDED PLASTICS MARKET SIZE, BY APPLICATION, 2018–2021 (USD MILLION)
                                TABLE 64 SOUTH KOREA: MOLDED PLASTICS MARKET SIZE, BY APPLICATION, 2022–2027 (KILOTON)
                                TABLE 65 SOUTH KOREA: MOLDED PLASTICS MARKET SIZE, BY APPLICATION, 2022–2027 (USD MILLION)
           9.2.5 TAIWAN
                    9.2.5.1 Growing economy to support market growth
                                TABLE 66 TAIWAN: MOLDED PLASTICS MARKET SIZE, BY APPLICATION, 2018–2021 (KILOTON)
                                TABLE 67 TAIWAN: MOLDED PLASTICS MARKET SIZE, BY APPLICATION, 2018–2021 (USD MILLION)
                                TABLE 68 TAIWAN: MOLDED PLASTICS MARKET SIZE, BY APPLICATION, 2022–2027 (KILOTON)
                                TABLE 69 TAIWAN: MOLDED PLASTICS MARKET SIZE, BY APPLICATION, 2022–2027 (USD MILLION)
           9.2.6 REST OF ASIA PACIFIC
                    TABLE 70 REST OF ASIA PACIFIC: MOLDED PLASTICS MARKET SIZE, BY APPLICATION, 2018–2021 (KILOTON)
                    TABLE 71 REST OF ASIA PACIFIC: MOLDED PLASTICS MARKET SIZE, BY APPLICATION, 2018–2021 (USD MILLION)
                    TABLE 72 REST OF ASIA PACIFIC: MOLDED PLASTICS MARKET SIZE, BY APPLICATION, 2022–2027 (KILOTON)
                    TABLE 73 REST OF ASIA PACIFIC: MOLDED PLASTICS MARKET SIZE, BY APPLICATION, 2022–2027 (USD MILLION)
    9.3 NORTH AMERICA 
          FIGURE 35 NORTH AMERICA: MOLDED PLASTICS MARKET SNAPSHOT
          TABLE 74 NORTH AMERICA: MOLDED PLASTICS MARKET SIZE, BY COUNTRY, 2018–2021 (KILOTON)
          TABLE 75 NORTH AMERICA: MOLDED PLASTICS MARKET SIZE, BY COUNTRY, 2018–2021 (USD MILLION)
          TABLE 76 NORTH AMERICA: MOLDED PLASTICS MARKET SIZE, BY COUNTRY, 2022–2027 (KILOTON)
          TABLE 77 NORTH AMERICA: MOLDED PLASTICS MARKET SIZE, BY COUNTRY, 2022–2027 (USD MILLION)
          TABLE 78 NORTH AMERICA: MOLDED PLASTICS MARKET SIZE, BY TYPE, 2018–2021 (KILOTON)
          TABLE 79 NORTH AMERICA: MOLDED PLASTICS MARKET SIZE, BY TYPE, 2018–2021 (USD MILLION)
          TABLE 80 NORTH AMERICA: MOLDED PLASTICS MARKET SIZE, BY TYPE, 2022–2027 (KILOTON)
          TABLE 81 NORTH AMERICA: MOLDED PLASTICS MARKET SIZE, BY TYPE, 2022–2027 (USD MILLION)
          TABLE 82 NORTH AMERICA: MOLDED PLASTICS MARKET SIZE, BY APPLICATION, 2018–2021 (KILOTON)
          TABLE 83 NORTH AMERICA: MOLDED PLASTICS MARKET SIZE, BY APPLICATION, 2018–2021 (USD MILLION)
          TABLE 84 NORTH AMERICA: MOLDED PLASTICS MARKET SIZE, BY APPLICATION, 2022–2027 (KILOTON)
          TABLE 85 NORTH AMERICA: MOLDED PLASTICS MARKET SIZE, BY APPLICATION, 2022–2027 (USD MILLION)
           9.3.1 US
                    9.3.1.1 US to dominate market in North America
                                TABLE 86 US: MOLDED PLASTICS MARKET SIZE, BY APPLICATION, 2018–2021 (KILOTON)
                                TABLE 87 US: MOLDED PLASTICS MARKET SIZE, BY APPLICATION, 2018–2021 (USD MILLION)
                                TABLE 88 US: MOLDED PLASTICS MARKET SIZE, BY APPLICATION, 2022–2027 (KILOTON)
                                TABLE 89 US: MOLDED PLASTICS MARKET SIZE, BY APPLICATION, 2022–2027 (USD MILLION)
           9.3.2 CANADA
                    9.3.2.1 Increasing government support for wastewater treatment to accelerate market growth
                                TABLE 90 CANADA: MOLDED PLASTICS MARKET SIZE, BY APPLICATION, 2018–2021 (KILOTON)
                                TABLE 91 CANADA: MOLDED PLASTICS MARKET SIZE, BY APPLICATION, 2018–2021 (USD MILLION)
                                TABLE 92 CANADA: MOLDED PLASTICS MARKET SIZE, BY APPLICATION, 2022–2027 (KILOTON)
                                TABLE 93 CANADA: MOLDED PLASTICS MARKET SIZE, BY APPLICATION, 2022–2027 (USD MILLION)
    9.4 EUROPE 
          FIGURE 36 EUROPE: MOLDED PLASTICS MARKET SNAPSHOT
          TABLE 94 EUROPE: MOLDED PLASTICS MARKET SIZE, BY COUNTRY, 2018–2021 (KILOTON)
          TABLE 95 EUROPE: MOLDED PLASTICS MARKET SIZE, BY COUNTRY, 2018–2021 (USD MILLION)
          TABLE 96 EUROPE: MOLDED PLASTICS MARKET SIZE, BY COUNTRY, 2022–2027 (KILOTON)
          TABLE 97 EUROPE: MOLDED PLASTICS MARKET SIZE, BY COUNTRY, 2022–2027 (USD MILLION)
          TABLE 98 EUROPE: MOLDED PLASTICS MARKET SIZE, BY TYPE, 2018–2021 (KILOTON)
          TABLE 99 EUROPE: MOLDED PLASTICS MARKET SIZE, BY TYPE, 2018–2021 (USD MILLION)
          TABLE 100 EUROPE: MOLDED PLASTICS MARKET SIZE, BY TYPE, 2022–2027 (KILOTON)
          TABLE 101 EUROPE: MOLDED PLASTICS MARKET SIZE, BY TYPE, 2022–2027 (USD MILLION)
          TABLE 102 EUROPE: MOLDED PLASTICS MARKET SIZE, BY APPLICATION, 2018–2021 (KILOTON)
          TABLE 103 EUROPE: MOLDED PLASTICS MARKET SIZE, BY APPLICATION, 2018–2021 (USD MILLION)
          TABLE 104 EUROPE: MOLDED PLASTICS MARKET SIZE, BY APPLICATION, 2022–2027 (KILOTON)
          TABLE 105 EUROPE: MOLDED PLASTICS MARKET SIZE, BY APPLICATION, 2022–2027 (USD MILLION)
           9.4.1 GERMANY
                    9.4.1.1 Most technologically advanced country in Europe
                                TABLE 106 GERMANY: MOLDED PLASTICS MARKET SIZE, BY APPLICATION, 2018–2021 (KILOTON)
                                TABLE 107 GERMANY: MOLDED PLASTICS MARKET SIZE, BY APPLICATION, 2018–2021 (USD MILLION)
                                TABLE 108 GERMANY: MOLDED PLASTICS MARKET SIZE, BY APPLICATION, 2022–2027 (KILOTON)
                                TABLE 109 GERMANY: MOLDED PLASTICS MARKET SIZE, BY APPLICATION, 2022–2027 (USD MILLION)
           9.4.2 ITALY
                    9.4.2.1 Growing demand and positive economic outlook to support market growth
                                TABLE 110 ITALY: MOLDED PLASTICS MARKET SIZE, BY APPLICATION, 2018–2021 (KILOTON)
                                TABLE 111 ITALY: MOLDED PLASTICS MARKET SIZE, BY APPLICATION, 2018–2021 (USD MILLION)
                                TABLE 112 ITALY: MOLDED PLASTICS MARKET SIZE, BY APPLICATION, 2022–2027 (KILOTON)
                                TABLE 113 ITALY: MOLDED PLASTICS MARKET SIZE, BY APPLICATION, 2022–2027 (USD MILLION)
           9.4.3 FRANCE
                    9.4.3.1 Packaging, automotive, and pharmaceuticals industries to drive market
                                TABLE 114 FRANCE: MOLDED PLASTICS MARKET SIZE, BY APPLICATION, 2018–2021 (KILOTON)
                                TABLE 115 FRANCE: MOLDED PLASTICS MARKET SIZE, BY APPLICATION, 2018–2021 (USD MILLION)
                                TABLE 116 FRANCE: MOLDED PLASTICS MARKET SIZE, BY APPLICATION, 2022–2027 (KILOTON)
                                TABLE 117 FRANCE: MOLDED PLASTICS MARKET SIZE, BY APPLICATION, 2022–2027 (USD MILLION)
           9.4.4 SPAIN
                    9.4.4.1 Growing automotive industry to support market growth
                                TABLE 118 SPAIN: MOLDED PLASTICS MARKET SIZE, BY APPLICATION, 2018–2021 (KILOTON)
                                TABLE 119 SPAIN: MOLDED PLASTICS MARKET SIZE, BY APPLICATION, 2018–2021 (USD MILLION)
                                TABLE 120 SPAIN: MOLDED PLASTICS MARKET SIZE, BY APPLICATION, 2022–2027 (KILOTON)
                                TABLE 121 SPAIN: MOLDED PLASTICS MARKET SIZE, BY APPLICATION, 2022–2027 (USD MILLION)
           9.4.5 UK
                    9.4.5.1 Growing pharmaceuticals, food & beverage, and healthcare industries to drive market
                                TABLE 122 UK: MOLDED PLASTICS MARKET SIZE, BY APPLICATION, 2018–2021 (KILOTON)
                                TABLE 123 UK: MOLDED PLASTICS MARKET SIZE, BY APPLICATION, 2018–2021 (USD MILLION)
                                TABLE 124 UK: MOLDED PLASTICS MARKET SIZE, BY APPLICATION, 2022–2027 (KILOTON)
                                TABLE 125 UK: MOLDED PLASTICS MARKET SIZE, BY APPLICATION, 2022–2027 (USD MILLION)
           9.4.6 REST OF EUROPE
                    TABLE 126 REST OF EUROPE: MOLDED PLASTICS MARKET SIZE, BY APPLICATION, 2018–2021 (KILOTON)
                    TABLE 127 REST OF EUROPE: MOLDED PLASTICS MARKET SIZE, BY APPLICATION, 2018–2021 (USD MILLION)
                    TABLE 128 REST OF EUROPE: MOLDED PLASTICS MARKET SIZE, BY APPLICATION, 2022–2027 (KILOTON)
                    TABLE 129 REST OF EUROPE: MOLDED PLASTICS MARKET SIZE, BY APPLICATION, 2022–2027 (USD MILLION)
    9.5 MIDDLE EAST & AFRICA 
          TABLE 130 MIDDLE EAST & AFRICA: MOLDED PLASTICS MARKET SIZE, BY COUNTRY, 2018–2021 (KILOTON)
          TABLE 131 MIDDLE EAST & AFRICA: MOLDED PLASTICS MARKET SIZE, BY COUNTRY, 2018–2021 (USD MILLION)
          TABLE 132 MIDDLE EAST & AFRICA: MOLDED PLASTICS MARKET SIZE, BY COUNTRY, 2022–2027 (KILOTON)
          TABLE 133 MIDDLE EAST & AFRICA: MOLDED PLASTICS MARKET SIZE, BY COUNTRY, 2022–2027 (USD MILLION)
          TABLE 134 MIDDLE EAST & AFRICA: MOLDED PLASTICS MARKET SIZE, BY TYPE, 2018–2021 (KILOTON)
          TABLE 135 MIDDLE EAST & AFRICA: MOLDED PLASTICS MARKET SIZE, BY TYPE, 2018–2021 (USD MILLION)
          TABLE 136 MIDDLE EAST & AFRICA: MOLDED PLASTICS MARKET SIZE, BY TYPE, 2022–2027 (KILOTON)
          TABLE 137 MIDDLE EAST & AFRICA: MOLDED PLASTICS MARKET SIZE, BY TYPE, 2022–2027 (USD MILLION)
          TABLE 138 MIDDLE EAST & AFRICA: MOLDED PLASTICS MARKET SIZE, BY APPLICATION, 2018–2021 (KILOTON)
          TABLE 139 MIDDLE EAST & AFRICA: MOLDED PLASTICS MARKET SIZE, BY APPLICATION, 2018–2021 (USD MILLION)
          TABLE 140 MIDDLE EAST & AFRICA: MOLDED PLASTICS MARKET SIZE, BY APPLICATION, 2022–2027 (KILOTON)
          TABLE 141 MIDDLE EAST & AFRICA: MOLDED PLASTICS MARKET SIZE, BY APPLICATION, 2022–2027 (USD MILLION)
           9.5.1 UAE
                    9.5.1.1 Government initiatives to be favorable for market growth
                                TABLE 142 UAE: MOLDED PLASTICS MARKET SIZE, BY APPLICATION, 2018–2021 (KILOTON)
                                TABLE 143 UAE: MOLDED PLASTICS MARKET SIZE, BY APPLICATION, 2018–2021 (USD MILLION)
                                TABLE 144 UAE: MOLDED PLASTICS MARKET SIZE, BY APPLICATION, 2022–2027 (KILOTON)
                                TABLE 145 UAE: MOLDED PLASTICS MARKET SIZE, BY APPLICATION, 2022–2027 (USD MILLION)
           9.5.2 SAUDI ARABIA
                    9.5.2.1 Fastest-growing market in region
                                TABLE 146 SAUDI ARABIA: MOLDED PLASTICS MARKET SIZE, BY APPLICATION, 2018–2021 (KILOTON)
                                TABLE 147 SAUDI ARABIA: MOLDED PLASTICS MARKET SIZE, BY APPLICATION, 2018–2021 (USD MILLION)
                                TABLE 148 SAUDI ARABIA: MOLDED PLASTICS MARKET SIZE, BY APPLICATION, 2022–2027 (KILOTON)
                                TABLE 149 SAUDI ARABIA: MOLDED PLASTICS MARKET SIZE, BY APPLICATION, 2022–2027 (USD MILLION)
           9.5.3 REST OF MIDDLE EAST & AFRICA
                    TABLE 150 REST OF MIDDLE EAST & AFRICA: MOLDED PLASTICS MARKET SIZE, BY APPLICATION, 2018–2021 (KILOTON)
                    TABLE 151 REST OF MIDDLE EAST & AFRICA: MOLDED PLASTICS MARKET SIZE, BY APPLICATION, 2018–2021 (USD MILLION)
                    TABLE 152 REST OF MIDDLE EAST & AFRICA: MOLDED PLASTICS MARKET SIZE, BY APPLICATION, 2022–2027 (KILOTON)
                    TABLE 153 REST OF MIDDLE EAST & AFRICA: MOLDED PLASTICS MARKET SIZE, BY APPLICATION, 2022–2027 (USD MILLION)
    9.6 LATIN AMERICA 
          FIGURE 37 BRAZIL IS LARGEST AND FASTEST-GROWING MARKET IN LATIN AMERICA
          TABLE 154 LATAM: MOLDED PLASTICS MARKET SIZE, BY COUNTRY, 2018–2021 (KILOTON)
          TABLE 155 LATAM: MOLDED PLASTICS MARKET SIZE, BY COUNTRY, 2018–2021 (USD MILLION)
          TABLE 156 LATAM: MOLDED PLASTICS MARKET SIZE, BY COUNTRY, 2022–2027 (KILOTON)
          TABLE 157 LATAM: MOLDED PLASTICS MARKET SIZE, BY COUNTRY, 2022–2027 (USD MILLION)
          TABLE 158 LATAM: MOLDED PLASTICS MARKET SIZE, BY TYPE, 2018–2021 (KILOTON)
          TABLE 159 LATAM: MOLDED PLASTICS MARKET SIZE, BY TYPE, 2018–2021 (USD MILLION)
          TABLE 160 LATAM: MOLDED PLASTICS MARKET SIZE, BY TYPE, 2022–2027 (KILOTON)
          TABLE 161 LATAM: MOLDED PLASTICS MARKET SIZE, BY TYPE, 2022–2027 (USD MILLION)
          TABLE 162 LATAM: MOLDED PLASTICS MARKET SIZE, BY APPLICATION, 2018–2021 (KILOTON)
          TABLE 163 LATAM: MOLDED PLASTICS MARKET SIZE, BY APPLICATION, 2018–2021 (USD MILLION)
          TABLE 164 LATAM: MOLDED PLASTICS MARKET SIZE, BY APPLICATION, 2022–2027 (KILOTON)
          TABLE 165 LATAM: MOLDED PLASTICS MARKET SIZE, BY APPLICATION, 2022–2027 (USD MILLION)
           9.6.1 MEXICO
                    9.6.1.1 High growth of Mexican polymer industry
                                TABLE 166 MEXICO: MOLDED PLASTICS MARKET SIZE, BY APPLICATION, 2018–2021 (KILOTON)
                                TABLE 167 MEXICO: MOLDED PLASTICS MARKET SIZE, BY APPLICATION, 2018–2021 (USD MILLION)
                                TABLE 168 MEXICO: MOLDED PLASTICS MARKET SIZE, BY APPLICATION, 2022–2027 (KILOTON)
                                TABLE 169 MEXICO: MOLDED PLASTICS MARKET SIZE, BY APPLICATION, 2022–2027 (USD MILLION)
           9.6.2 BRAZIL
                    9.6.2.1 Global agricultural powerhouse
                                TABLE 170 BRAZIL: MOLDED PLASTICS MARKET SIZE, BY APPLICATION, 2018–2021 (KILOTON)
                                TABLE 171 BRAZIL: MOLDED PLASTICS MARKET SIZE, BY APPLICATION, 2018–2021 (USD MILLION)
                                TABLE 172 BRAZIL: MOLDED PLASTICS MARKET SIZE, BY APPLICATION, 2022–2027 (KILOTON)
                                TABLE 173 BRAZIL: MOLDED PLASTICS MARKET SIZE, BY APPLICATION, 2022–2027 (USD MILLION)
           9.6.3 ARGENTINA
                    9.6.3.1 Growing packaging industry to contribute to market growth
                                TABLE 174 ARGENTINA: MOLDED PLASTICS MARKET SIZE, BY APPLICATION, 2018–2021 (KILOTON)
                                TABLE 175 ARGENTINA: MOLDED PLASTICS MARKET SIZE, BY APPLICATION, 2018–2021 (USD MILLION)
                                TABLE 176 ARGENTINA: MOLDED PLASTICS MARKET SIZE, BY APPLICATION, 2022–2027 (KILOTON)
                                TABLE 177 ARGENTINA: MOLDED PLASTICS MARKET SIZE, BY APPLICATION, 2022–2027 (USD MILLION)
           9.6.4 REST OF LATAM
                    TABLE 178 REST OF LATAM: MOLDED PLASTICS MARKET SIZE, BY APPLICATION, 2018–2021 (KILOTON)
                    TABLE 179 REST OF LATAM: MOLDED PLASTICS MARKET SIZE, BY APPLICATION, 2018–2021 (USD MILLION)
                    TABLE 180 REST OF LATAM: MOLDED PLASTICS MARKET SIZE, BY APPLICATION, 2022–2027 (KILOTON)
                    TABLE 181 REST OF LATAM: MOLDED PLASTICS MARKET SIZE, BY APPLICATION, 2022–2027 (USD MILLION)
 
10 COMPETITIVE LANDSCAPE (Page No. - 171)
     10.1 INTRODUCTION 
             10.1.1 MOLDED PLASTICS MARKET: KEY DEVELOPMENTS
                        TABLE 182 OVERVIEW OF STRATEGIES ADOPTED BY KEY MARKET PLAYERS
     10.2 RANKING ANALYSIS OF KEY MARKET PLAYERS 
             FIGURE 38 RANKING OF TOP FIVE MARKET PLAYERS
             10.2.1 LYONDELLBASELL
             10.2.2 SABIC
             10.2.3 INEOS
             10.2.4 DUPONT
             10.2.5 EXXONMOBIL
     10.3 MARKET SHARE ANALYSIS 
             FIGURE 39 MOLDED PLASTICS: MARKET SHARE ANALYSIS
     10.4 MARKET EVALUATION MATRIX 
             TABLE 183 MARKET EVALUATION MATRIX
     10.5 COMPETITIVE EVALUATION QUADRANT (TIER-1 PLAYERS) 
             10.5.1 STARS
             10.5.2 EMERGING LEADERS
             10.5.3 PERVASIVE PLAYERS
             10.5.4 PARTICIPANTS
                        FIGURE 40 GLOBAL MOLDED PLASTICS MARKET: COMPANY EVALUATION MATRIX FOR TIER-1 COMPANIES
     10.6 COMPANY TYPE FOOTPRINT 
     10.7 COMPANY APPLICATION FOOTPRINT 
     10.8 COMPANY REGION FOOTPRINT 
     10.9 STRENGTH OF STRATEGY EXCELLENCE 
     10.10 STRENGTH OF PRODUCT PORTFOLIO 
     10.11 COMPETITIVE EVALUATION QUADRANT (SMES) 
             10.11.1 STARTING BLOCKS
             10.11.2 RESPONSIVE COMPANIES
             10.11.3 PROGRESSIVE COMPANIES
             10.11.4 DYNAMIC COMPANIES
                        FIGURE 41 GLOBAL MOLDED PLASTICS MARKET: COMPANY EVALUATION MATRIX FOR SMES
     10.12 COMPETITIVE BENCHMARKING 
              TABLE 184 MOLDED PLASTICS MARKET: DETAILED LIST OF SMES
              TABLE 185 MOLDED PLASTICS MARKET: COMPETITIVE BENCHMARKING OF SMES
     10.13 COMPETITIVE SCENARIO AND TRENDS 
             10.13.1 PRODUCT LAUNCHES
                        TABLE 186 MOLDED PLASTICS MARKET: PRODUCT LAUNCHES, 2019–2022
             10.13.2 DEALS
                        TABLE 187 MOLDED PLASTICS MARKET: DEALS, 2019–2022
             10.13.3 OTHERS
                        TABLE 188 MOLDED PLASTICS MARKET: OTHER DEVELOPMENTS, 2019–2022
 
11 COMPANY PROFILES (Page No. - 189)
     11.1 KEY PLAYERS 
(Business Overview, Products/Solutions/Services offered, Recent Developments, and MnM View)*
             11.1.1 LYONDELLBASELL INDUSTRIES HOLDINGS B.V.
                        TABLE 189 LYONDELLBASELL: COMPANY OVERVIEW
                        FIGURE 42 LYONDELLBASELL: COMPANY SNAPSHOT
                        TABLE 190 LYONDELLBASELL: PRODUCTS OFFERED
                        TABLE 191 LYONDELLBASELL: DEALS
                        TABLE 192 LYONDELLBASELL: OTHER DEVELOPMENTS
             11.1.2 SABIC
                        TABLE 193 SABIC: COMPANY OVERVIEW
                        FIGURE 43 SABIC: COMPANY SNAPSHOT
                        TABLE 194 SABIC: PRODUCTS OFFERED
                        TABLE 195 SABIC: PRODUCT LAUNCHES
                        TABLE 196 SABIC: DEALS
                        TABLE 197 SABIC: OTHER DEVELOPMENTS
             11.1.3 INEOS
                        TABLE 198 INEOS: COMPANY OVERVIEW
                        FIGURE 44 INEOS: COMPANY SNAPSHOT
                        TABLE 199 INEOS: PRODUCTS OFFERED
                        TABLE 200 INEOS: DEALS
                        TABLE 201 INEOS: OTHER DEVELOPMENTS
             11.1.4 DUPONT
                        TABLE 202 DUPONT: COMPANY OVERVIEW
                        FIGURE 45 DUPONT: COMPANY SNAPSHOT
                        TABLE 203 DUPONT: PRODUCTS OFFERED
                        TABLE 204 DUPONT: PRODUCT LAUNCHES
                        TABLE 205 DUPONT: DEALS
             11.1.5 EXXONMOBIL
                        TABLE 206 EXXONMOBIL: COMPANY OVERVIEW
                        FIGURE 46 EXXONMOBIL: COMPANY SNAPSHOT
                        TABLE 207 EXXONMOBIL: PRODUCTS OFFERED
                        TABLE 208 EXXONMOBIL: PRODUCT LAUNCHES
             11.1.6 SINOPEC
                        TABLE 209 SINOPEC: COMPANY OVERVIEW
                        FIGURE 47 SINOPEC: COMPANY SNAPSHOT
                        TABLE 210 SINOPEC: PRODUCTS OFFERED
             11.1.7 DOW INC.
                        TABLE 211 DOW INC.: COMPANY OVERVIEW
                        FIGURE 48 DOW INC.: COMPANY SNAPSHOT
                        TABLE 212 DOW INC.: PRODUCTS OFFERED
                        TABLE 213 DOW INC.: PRODUCT LAUNCHES
             11.1.8 BASF SE
                        TABLE 214 BASF SE: COMPANY OVERVIEW
                        FIGURE 49 BASF SE: COMPANY SNAPSHOT
                        TABLE 215 BASF SE: PRODUCTS OFFERED
                        TABLE 216 BASF SE: PRODUCT LAUNCHES
                        TABLE 217 BASF SE: DEALS
                        TABLE 218 BASF SE: OTHER DEVELOPMENTS
             11.1.9 EASTMAN CHEMICAL COMPANY
                        TABLE 219 EASTMAN CHEMICAL COMPANY: COMPANY OVERVIEW
                        FIGURE 50 EASTMAN CHEMICAL COMPANY: COMPANY SNAPSHOT
                        TABLE 220 EASTMAN CHEMICAL COMPANY: PRODUCTS OFFERED
                        TABLE 221 EASTMAN CHEMICAL COMPANY: PRODUCT LAUNCHES
                        TABLE 222 EASTMAN CHEMICAL COMPANY: DEALS
                        TABLE 223 EASTMAN CHEMICAL COMPANY: OTHER DEVELOPMENTS
             11.1.10 CHEVRON CORPORATION
                        TABLE 224 CHEVRON CORPORATION: COMPANY OVERVIEW
                        FIGURE 51 CHEVRON CORPORATION: COMPANY SNAPSHOT
                        TABLE 225 CHEVRON CORPORATION: PRODUCTS OFFERED
                        TABLE 226 CHEVRON CORPORATION: OTHER DEVELOPMENTS
             11.1.11 FORMOSA PLASTICS CORPORATION
                        TABLE 227 FORMOSA PLASTICS CORPORATION: COMPANY OVERVIEW
                        TABLE 228 FORMOSA PLASTICS CORPORATION: PRODUCTS OFFERED
                        TABLE 229 FORMOSA PLASTICS CORPORATION: OTHER DEVELOPMENTS
             11.1.12 SOLVAY
                        TABLE 230 SOLVAY: COMPANY OVERVIEW
                        FIGURE 52 SOLVAY: COMPANY SNAPSHOT
                        TABLE 231 SOLVAY: PRODUCTS OFFERED
* Business Overview, Products/Solutions/Services offered, Recent Developments, and MnM View might not be captured in case of unlisted companies.
     11.2 OTHER PLAYERS 
             11.2.1 CHINA PLASTIC EXTRUSION LTD.
             11.2.2 EMS CHEMIE
             11.2.3 GSH INDUSTRIES
             11.2.4 HTI PLASTICS
             11.2.5 HUNTSMAN CORPORATION
             11.2.6 LANXESS AG
             11.2.7 LG CHEM LTD.
             11.2.8 LOTTE CHEMICAL
             11.2.9 PROTO LABS
             11.2.10 PSI MOLDED PLASTICS
             11.2.11 RELIANCE INDUSTRIES LIMITED
             11.2.12 SIBUR
             11.2.13 TAKWEEN ADVANCED INDUSTRIES
             11.2.14 VERSALIS S.P.A.
             11.2.15 WESTLAKE CORPORATION
 
12 APPENDIX (Page No. - 228)
     12.1 DISCUSSION GUIDE 
     12.2 KNOWLEDGESTORE: MARKETSANDMARKETS’ SUBSCRIPTION PORTAL 
     12.3 CUSTOMIZATION OPTIONS 
     12.4 RELATED REPORTS 
     12.5 AUTHOR DETAILS 

The study involved four major activities in estimating the current market size for molded plastics market. The exhaustive secondary research was conducted to collect information on the market, peer market, and child market. The next step was to validate these findings, assumptions, and sizing with industry experts across the value chain through primary research. Both top-down and bottom-up approaches were employed to estimate the complete market size. After that, the market breakdown and data triangulation methodologies were used to estimate the market size of segments and sub-segments.

Secondary Research

In the secondary research process, extensive use of secondary sources, directories, and databases, such as World Bank, Statista, Organization for Economic Cooperation and Development (OECD), Bloomberg, International Monetary Fund (IMF), Trademap, Zauba, Environmental Protection Agency (EPA), European Environment Agency, and other government & private websites, associations related to the molded plastics industry. The study also involves analyzing regulations and regional government websites to identify and collect information useful for this technical, market-oriented, and commercial molded plastics market study.

Primary Research

The molded plastics market comprises several stakeholders such as raw material suppliers, distributors, manufacturers, end-users, and regulatory organizations in the supply chain. Primary sources include experts from the core and related industries and preferred suppliers, manufacturers, distributors, service providers, technology developers, alliances, and organizations related to all segments of this industry's value chain. In-depth interviews with various primary respondents, including key industry participants, subject matter experts (SMEs), C-level executives of major market players, and industry consultants, have been conducted to obtain and verify critical qualitative and quantitative information and assess growth prospects.

Following is the breakdown of primary respondents
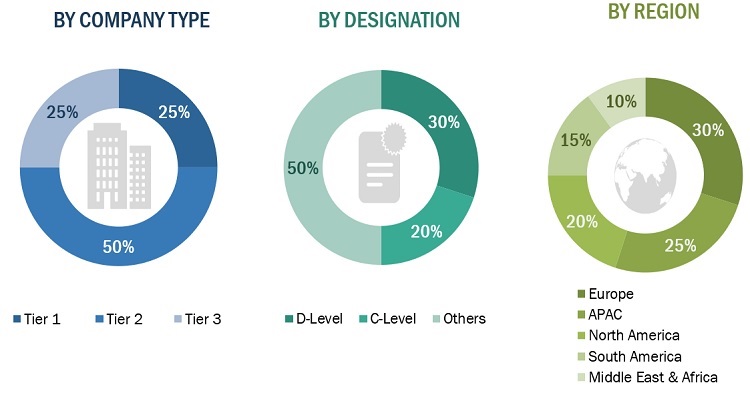
molded-plastic-market Size, and Share

To know about the assumptions considered for the study, download the pdf brochure

Market Size Estimation

Both top-down and bottom-up approaches were used to estimate and validate the total size of the molded plastics market. These methods were also used extensively to estimate the size of various sub-segments in the market. The research methodology used to estimate the market size includes the following:

  • The key players, type, technology, and applications in various industries and markets were identified through extensive secondary research.
  • The industry’s value chain and market size, in terms of value and volume, were determined through primary and secondary research processes.
  • All percentage shares, splits, and breakdowns were determined using secondary sources and verified through primary sources.

Data Triangulation

After arriving at the overall market size - using the market size estimation process explained above - the market was split into several segments and sub-segments. To complete the overall market engineering process and arrive at the exact statistics of each market segment and sub-segment, the data triangulation, and market breakdown procedures were employed, wherever applicable. The data was triangulated by studying various factors and trends from both the demand and supply of molded plastics and their applications.

Objectives of the Study:

  • To analyze and forecast the molded plastics market size, in terms of value and volume
  • To provide detailed information about the key factors (drivers, restraints, opportunities, and challenges) influencing the market growth
  • To define, describe, and forecast the market by type, technology, and application
  • To forecast the size of the market with respect to five regions, namely, Asia Pacific, Europe, North America, Latin America, and the Middle East & Africa, along with the key countries
  • To strategically analyze micromarkets1 with respect to individual trends, growth prospects, and their contribution to the overall market
  • To analyze the opportunities in the market for stakeholders and provide a competitive landscape for the market leaders
  • To analyze competitive developments such as new product launch, merger & acquisition, agreement & collaboration, and investment & expansion in the market
  • To strategically profile the key players and comprehensively analyze their market shares and core competencies2
  • Notes: 1. Micro markets are defined as sub segments of the molded plastics market included in the report.
  • 2. Core competencies of the companies are covered in terms of their key developments and strategies adopted to sustain their position in the market.

Available Customizations:

  • With the given market data, MarketsandMarkets offers customizations according to the specific requirements of companies. The following customization options are available for the report:

Regional Analysis:

  • Country-level analysis of the molded plastics market

Company Information:

  • Detailed analysis and profiling of additional market players


Custom Market Research Services

We will customize the research for you, in case the report listed above does not meet with your exact requirements. Our custom research will comprehensively cover the business information you require to help you arrive at strategic and profitable business decisions.

Request Customization

Instant Answers with GPT - Ask Now!

Ask real questions. Get complete answers !
Report Code
CH 6279
Published ON
Nov, 2022
Choose License Type
BUY NOW
  • SHARE
X
Request Customization
Speak to Analyst
Speak to Analyst
OR FACE-TO-FACE MEETING
PERSONALIZE THIS RESEARCH
  • Triangulate with your Own Data
  • Get Data as per your Format and Definition
  • Gain a Deeper Dive on a Specific Application, Geography, Customer or Competitor
  • Any level of Personalization
REQUEST A FREE CUSTOMIZATION
LET US HELP YOU!
  • What are the Known and Unknown Adjacencies Impacting the Molded Plastics Market
  • What will your New Revenue Sources be?
  • Who will be your Top Customer; what will make them switch?
  • Defend your Market Share or Win Competitors
  • Get a Scorecard for Target Partners
CUSTOMIZED WORKSHOP REQUEST
knowledgestore logo

Want to explore hidden markets that can drive new revenue in Molded Plastics Market?

Find Hidden Markets
  • Call Us
  • +1-888-600-6441 (Corporate office hours)
  • +1-888-600-6441 (US/Can toll free)
  • +44-800-368-9399 (UK office hours)
CONNECT WITH US
ABOUT TRUST ONLINE
©2024 MarketsandMarkets Research Private Ltd. All rights reserved
DMCA.com Protection Status
Website Feedback