Gas Equipment Market by Industrial Gas (Atmospheric, Hydrogen, Acetylene, Helium), Type (Gas delivery, Regulators, Purifiers & filters, Flow devices, Gas generation, Cryogenics, Gas detection), Process (Generation, Storage, Detection, Transportation) - Forecast to 2021


[533 Pages Report] The gas equipment market size is estimated to grow from USD 51.93 billion in 2016 to reach USD 72.22 billion by 2021, at a CAGR of 6.82%. The segments considered for this report are based on the equipment category, gas type, process, end-use sector of gas equipment, and region. The base year considered for the study is 2015 and the market size is projected from 2016 to 2021. Factors such as increasing demand for industrial gases for diverse applications in healthcare & medical, metal fabrication, and chemical industries have propelled the growth of the gas equipment market.
The research methodology used to estimate and forecast the gas equipment market begins with capturing data on key vendor revenues through secondary research. The vendor offerings are also taken into consideration to determine the market segmentation. The bottom-up procedure was employed to arrive at the overall market size of the global gas equipment market from the revenue of the key players in the market. After arriving at the overall market size, the total market was split into several segments and subsegments, which were then verified through primary research by conducting extensive interviews with key people such as CEOs, VPs, directors, and executives. These data triangulation and market breakdown procedures were used to complete the overall market engineering process and arrive at the exact statistics for all segments and subsegments. The breakdown of profiles of primary is depicted in the figure below:
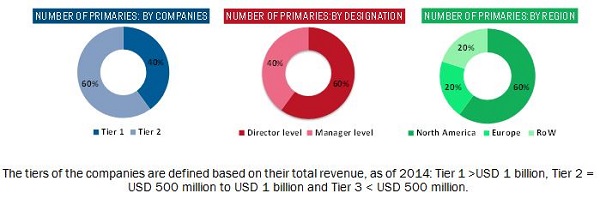
To know about the assumptions considered for the study, download the pdf brochure
The market comprises gas equipment manufacturing companies such as Linde AG (Germany), Air Liquide S.A (France), Praxair, Inc. (U.S.), Air Products And Chemicals, Inc. (U.S.), Iwatani Corporation (Japan), Itron, Inc. (U.S), Colfax Corporation (U.S.), Messer Group GmbH (Germany), Matheson Tri-Gas, Inc. (U.S.), and GCE Holding AB (Sweden). These products are further used by industrial gas manufacturing companies such as Xebec Adsorption Inc. (Canada), BASF SE (Germany), ABB Ltd. (Switzerland), Ellenbarrie Industrial Gases Ltd. (India), and Criomec S.A (Romania).
Target audience
- Gas equipment manufacturers
- Gas equipment importers and exporters
- Gas equipment traders, distributors, and suppliers
- Market research and consulting firms
- Commercial R&D institutions
- Associations and industry bodies
- Government and regulatory bodies
- End users
Scope of the Report
This research report segments the gas equipment market into the following submarkets:
By Equipment Category:
- Gas delivery systems
- Gas regulators
- Flow devices
- Purifiers & filters
- Gas generating systems
- Gas detection systems
- Cryogenic products
- Accessories
By Gas:
- Atmospheric gases
- Hydrogen
- Acetylene
- Helium
- Other gases (carbon monoxide, krypton, neon, xenon, and nitrous oxide)
By Process
- Generation
- Storage
- Detection
- Transportation
By End-Use Sector:
- Metal fabrication
- Chemical
- Healthcare & medical
- Oil & gas
- Others (food & beverage, automotive, and electronics)
By Region:
- North America
- Europe
- Asia-Pacific
- RoW
Available Customizations
With the given market data, MarketsandMarkets offers customizations as per the client-specific needs. The following customization options are available for the report:
Product Analysis
- Product Matrix which gives a detailed comparison of gas equipment market for different product types
Geographic Analysis
- Further analysis of the gas equipment market for additional countries
Company Information
- Detailed analysis and profiling of additional market players (up to 5).
MarketsandMarkets projects that the gas equipment market size will grow from USD 51.93 Billion in 2016 to reach USD 72.22 Billion by 2021, at an estimated CAGR of 6.82%. The global gas equipment market is driven by basic factors, which include strong growth in demand, especially in medical care, oil & gas, energy, and other sectors. These drivers are supported by the high rise in demand from the Asian healthcare industry. Product innovations and technological developments in the market are expected to create strong investment opportunities. Strict government standards and regulatory legislations have a positive impact on the safest and proper use of gas equipment. Rapid industrialization, growing concern toward the public health, and laws & regulations have propelled the growth of the gas equipment industry.
Gas equipment market, on the basis of equipment category, consists of gas delivery systems, gas regulators, flow devices, purifiers & filters, gas generating systems, gas detection systems, cryogenic products, and accessories. The gas delivery systems segment had the largest demand in 2015 and is expected to hold the leading position through the forecast period. However, cryogenic products segment is projected to be the fastest-growing market from 2016 to 2021.
On the basis of gas, the market has been categorized into atmospheric gases, hydrogen, acetylene, helium, and other gases which include carbon monoxide, krypton, neon, xenon, and nitrous oxide. The atmospheric gases segment recorded the largest consumption of gas equipment in 2015 due to the huge demand for this type of gases in the industrial applications. Hydrogen and acetylene gas have high potential as the demand for these gases is growing rapidly in the chemical, food processing, and metallurgical industries.
The end-use sectors for the market are chemical, metal fabrication, healthcare & medical, oil & gas, and others including food & beverage, automobile, and electronics industries. The demand from the chemical sector is projected to grow at the highest CAGR during the forecast period. The growing demand for industrial chemicals in diverse industrial applications has led to the increase in demand for gas equipment in this sector.
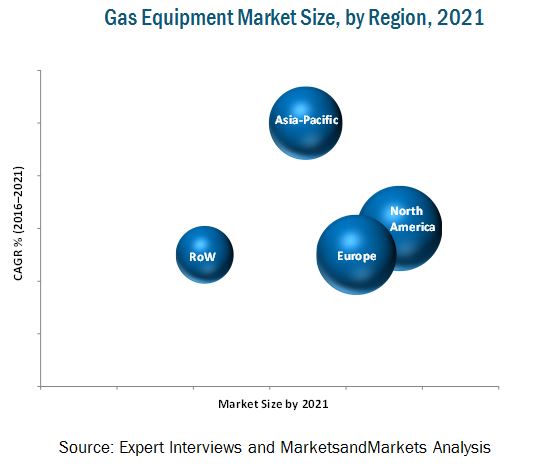
North America dominated the gas equipment market in 2015 and is projected to remain the market leader through 2021. The U.S. is the fastest growing country-level market, from 2016 to 2021. Asia-Pacific is the fastest growing region in the gas equipment market. Rising population of the region, along with rapid industrialization and infrastructural development, has propelled the growth of various industries such as metal fabrication, chemical, automotive, and electronics. This in turn has driven the growth of the market for gas equipment due to its diverse applications in these end-use sectors.
Technical issues and high cost due to the complication in the manufacturing process of gas equipment are the major restraints in the studied market. New product launch and acquisition were the major strategies adopted by most players in the gas equipment market. Companies such as Linde AG (Germany), Air Liquide S.A. (France), Praxair, Inc. (U.S.), Colfax Corporation (U.S.), Air Products and Chemicals, Inc. (U.S.), and GCE Holding AB (Sweden) were the key players who adopted this strategy to increase the reach of their offerings, improve their production capacity, and establish focus on core operations.
To speak to our analyst for a discussion on the above findings, click Speak to Analyst
 Exclusive indicates content/data unique to MarketsandMarkets and not available with any competitors.
Table of Contents
1 Introduction (Page No. - 51)
1.1 Objectives of the Study
1.2 Market Definition
1.3 Study Scope
1.3.1 Regional Scope
1.3.2 Years Considered
1.4 Currency Considered
1.5 Units Considered
1.6 Stakeholders
2 Research Methodology (Page No. - 55)
2.1 Research Data
2.1.1 Secondary Data
2.1.1.1 Key Data From Secondary Sources
2.1.2 Primary Data
2.1.2.1 Key Data From Primary Sources
2.2 Market Size Estimation
2.3 Market Breakdown & Data Triangulation
2.4 Research Assumptions & Limitations
2.4.1 Assumptions
2.4.2 Limitations of the Research Study
3 Executive Summary (Page No. - 63)
3.1 Gas Equipment Market: Driving Factors
3.2 Cryogenic Products Segment is Projected to Grow at the Highest Rate in the Gas Equipment Market From 2016 to 2021
3.3 Chemical to Be the Largest End-Use Sector for Gas Equipment Systems Through 2021
3.4 North America is Projected to Dominate the Gas Equipment Market By 2021
3.5 The U.S. to Grow at the Highest CAGR During the Forecast Period
4 Premium Insights (Page No. - 69)
4.1 Emerging Economies to Have Higher Demand for Gas Equipment
4.2 Metal Fabrication Sector is Projected to Grow at the Highest CAGR From 2016 to 2021
4.3 Gas Equipment Market, By Equipment Category (2016 vs 2021)
4.4 Gas Delivery Systems Captured the Largest Share in Asia-Pacific in 2015
4.5 North America Recorded the Highest Demand for Gas Equipment in 2015
5 Market Overview (Page No. - 74)
5.1 Introduction
5.2 Gas Equipment Market Segmentation
5.3 Market Dynamics
5.3.1 Drivers
5.3.1.1 Stringent Safety and Environmental Regulations
5.3.1.2 Growing Oil & Gas Industry
5.3.1.3 Expanding Industrial Development in the Middle East and Africa
5.3.1.4 Growing Energy Industry
5.3.2 Restraints
5.3.2.1 Technical Issues and Cost Factors
5.3.3 Opportunities
5.3.3.1 Increasing Demand in Developing Economies
5.3.3.2 Green Building Concept
5.3.3.3 High Demand From Chemical Industry
5.3.3.4 Growing Demand for Gas Equipment From Healthcare Sector
5.3.4 Challenges
5.3.4.1 Development of Affordable as Well as Effective Technologies
6 Gas Equipment Market, By Equipment Category (Page No. - 82)
6.1 Introduction
6.1.1 Gas Delivery Systems is Projected to Account for the Largest Share in Gas Equipment Market in 2021
6.2 Gas Delivery Systems
6.2.1 Atmospheric Gas Delivery Systems Market, By Region
6.2.2 Atmospheric Gas Delivery Systems Market, By Subcategory
6.2.3 Acetylene Gas Delivery Systems Market, By Region
6.2.4 Acetylene Gas Delivery Systems Market, By Subcategory
6.2.5 Hydrogen Gas Delivery Systems Market, By Region
6.2.6 Hydrogen Gas Delivery Systems Market, By Subcategory
6.2.7 Helium Gas Delivery Systems Market, By Region
6.2.8 Helium Gas Delivery Systems Market, By Subcategory
6.2.9 Other Gases: Gas Delivery Systems Market, By Region
6.2.10 Other Gases Gas Delivery Systems Market, By Subcategory
6.2.11 Gas Cylinders
6.2.11.1 Gas Cylinders: Atmospheric Gas Delivery Systems Market, By Region
6.2.11.2 Gas Cylinders: Acetylene Gas Delivery Systems Market, By Region
6.2.11.3 Gas Cylinders: Hydrogen Gas Delivery Systems Market, By Region
6.2.11.4 Gas Cylinders: Helium Gas Delivery Systems Market, By Region
6.2.11.5 Gas Cylinders: Other Gases Delivery Systems Market, By Region
6.2.12 Manifolds
6.2.12.1 Manifolds: Atmospheric Gas Delivery Systems Market, By Region
6.2.12.2 Manifolds: Acetylene Gas Delivery Systems Market, By Region
6.2.12.3 Manifolds: Hydrogen Gas Delivery Systems Market, By Region
6.2.12.4 Manifolds: Helium Gas Delivery Systems Market, By Region
6.2.12.5 Manifolds: Other Gases Delivery Systems Market, By Region
6.2.13 Switchovers
6.2.13.1 Switchovers: Atmospheric Gas Delivery Systems Market, By Region
6.2.13.2 Switchovers: Acetylene Gas Delivery Systems Market, By Region
6.2.13.3 Switchovers: Hydrogen Gas Delivery Systems Market, By Region
6.2.13.4 Switchovers: Helium Gas Delivery Systems Market, By Region
6.2.13.5 Switchovers: Other Gases Delivery Systems Market, By Region
6.2.14 Gas Cabinets
6.2.14.1 Gas Cabinets: Atmospheric Gas Delivery Systems Market, By Region
6.2.14.2 Gas Cabinets: Acetylene Gas Delivery Systems Market, By Region
6.2.14.3 Gas Cabinets: Hydrogen Gas Delivery Systems Market, By Region
6.2.14.4 Gas Cabinets: Helium Gas Delivery Systems Market, By Region
6.2.14.5 Gas Cabinets: Other Gases Delivery Systems Market, By Region
6.2.15 Protocol Stations
6.2.15.1 Protocol Stations: Atmospheric Gas Delivery Systems Market, By Region
6.2.15.2 Protocol Stations: Acetylene Gas Delivery Systems Market, By Region
6.2.15.3 Protocol Stations: Hydrogen Gas Delivery Systems Market, By Region
6.2.15.4 Protocol Stations: Helium Gas Delivery Systems Market, By Region
6.2.15.5 Protocol Stations: Other Gases Delivery Systems Market, By Region
6.2.16 Changeovers
6.2.16.1 Changeovers: Atmospheric Gas Delivery Systems Market, By Region
6.2.16.2 Changeovers: Acetylene Gas Delivery Systems Market, By Region
6.2.16.3 Changeovers: Hydrogen Gas Delivery Systems Market, By Region
6.2.16.4 Changeovers: Helium Gas Delivery Systems Market, By Region
6.2.16.5 Changeovers: Other Gases Gas Delivery Systems Market, By Region
6.3 Gas Regulators
6.3.1 Atmospheric Gas Regulators Market, By Region
6.3.2 Acetylene Gas Regulators Market, By Region
6.3.3 Hydrogen Gas Regulators Market, By Region
6.3.4 Helium Gas Regulators Market, By Region
6.3.5 Other Gases: Regulators Market, By Region
6.4 Purifiers & Filters
6.4.1 Atmospheric Purifiers & Filters Market, By Region
6.4.2 Acetylene Purifiers & Filters Market, By Region
6.4.3 Hydrogen Purifiers & Filters Market, By Region
6.4.4 Helium Purifiers & Filters Market, By Region
6.4.5 Other Gases Purifiers & Filters Market, By Region
6.5 Flow Devices
6.5.1 Atmospheric Flow Devices Market, By Region
6.5.2 Atmospheric Flow Devices Market, By Subcategory
6.5.3 Acetylene Flow Devices Market, By Region
6.5.4 Acetylene Flow Devices Market, By Subcategory
6.5.5 Hydrogen Flow Devices Market, By Region
6.5.6 Hydrogen Flow Devices Market, By Subcategory
6.5.7 Helium Flow Devices Market, By Region
6.5.8 Helium Flow Devices Market, By Subcategory
6.5.9 Other Gases: Flow Devices Market, By Region
6.5.10 Other Gases: Flow Devices Market, By Subcategory
6.5.11 Flow Meters
6.5.11.1 High-Capacity Flow Meters
6.5.11.2 Variable Area Flow Meters
6.5.11.3 Flow Meters: Atmospheric Flow Devices Market, By Region
6.5.11.4 Flow Meters: Atmospheric Flow Devices Market, By Subcategory
6.5.11.4.1 High-Capacity Flow Meters: Atmospheric Flow Meters Market, By Region
6.5.11.4.2 Variable Area Flow Meters: Atmospheric Flow Meters Market, By Region
6.5.11.4.3 Flow Meters: Acetylene Flow Devices Market, By Region
6.5.11.4.4 Flow Meters: Acetylene Flow Devices Market, By Subcategory
6.5.11.4.5 High-Capacity Flow Meters: Acetylene Flow Meters Market, By Region
6.5.11.4.6 Variable Area Flow Meters: Acetylene Flow Meters Market, By Region
6.5.11.5 Flow Meters: Hydrogen Flow Devices Market, By Region
6.5.11.6 Flow Meters: Hydrogen Flow Devices Market, By Subcategory
6.5.11.6.1 High-Capacity Flow Meters: Hydrogen Flow Meters Market, By Region
6.5.11.6.2 Variable Area Flow Meters: Hydrogen Flow Meters Market, By Region
6.5.11.7 Flow Meters: Helium Flow Devices Market, By Region
6.5.11.8 Flow Meters: Helium Flow Devices Market, By Subcategory
6.5.11.8.1 High-Capacity Flow Meters: Helium Flow Meters Market, By Region
6.5.11.8.2 Variable Area Flow Meters: Helium Flow Meters Market, By Region
6.5.11.9 Flow Meters: Flow Devices Market for Other Gases, By Region
6.5.11.10 Flow Meters: Flow Devices Market for Other Gases, By Subcategory
6.5.11.10.1 High-Capacity Flow Meters: Flow Meters Market for Other Gases, By Region
6.5.11.10.2 Variable Area Flow Meters: Flow Meters Market for Other Gases, By Region
6.5.12 Gas Blenders
6.5.12.1 Gas Blenders: Atmospheric Flow Devices Market, By Region
6.5.12.2 Gas Blenders: Acetylene Flow Devices Market, By Region
6.5.12.3 Gas Blenders: Hydrogen Flow Devices Market, By Region
6.5.12.4 Gas Blenders: Helium Flow Devices Market, By Region
6.5.12.5 Gas Blenders: Flow Devices Market for Other Gases, By Region
6.5.13 Other Flow Devices
6.5.13.1 Other Flow Devices: Atmospheric Flow Devices Market, By Region
6.5.13.2 Other Flow Devices: Acetylene Flow Devices Market, By Region
6.5.13.3 Other Flow Devices: Hydrogen Flow Devices Market, By Region
6.5.13.4 Other Flow Devices: Helium Flow Devices Market, By Region
6.5.13.5 Other Flow Devices: Flow Devices Market for Other Gases, By Region
6.6 Gas Generating Systems
6.6.1 Atmospheric Gas Generating Systems Market, By Region
6.6.2 Atmospheric Gas Generating Systems Market, By Subcategory
6.6.3 Acetylene Gas Generating Systems Market, By Region
6.6.4 Acetylene Gas Generating Systems Market, By Subcategory
6.6.5 Hydrogen Gas Generating Systems Market, By Region
6.6.6 Hydrogen Gas Generating Systems Market, By Subcategory
6.6.7 Helium Gas Generating Systems Market, By Region
6.6.8 Helium Gas Generating Systems Market, By Subcategory
6.6.9 Other Gases Gas Generating Systems Market, By Region
6.6.10 Other Gases Gas Generating Systems Market, By Subcategory
6.6.11 Gas Generators
6.6.11.1 Gas Generators: Atmospheric Gas Detection Systems Market, By Region
6.6.11.2 Gas Generators: Acetylene Gas Detection Systems Market, By Region
6.6.11.3 Gas Generators: Hydrogen Gas Detection Systems Market, By Region
6.6.11.4 Gas Generators: Helium Gas Detection Systems Market, By Region
6.6.11.5 Gas Generators: Other Gas Detection Systems Market, By Region
6.6.12 Membrane Supply Systems
6.6.12.1 Membrane Supply Systems: Atmospheric Gas Detection Systems Market, By Region
6.6.12.2 Membrane Supply Systems: Acetylene Gas Detection Systems Market, By Region
6.6.12.3 Membrane Supply Systems: Hydrogen Gas Detection Systems Market, By Region
6.6.12.4 Membrane Supply Systems: Helium Gas Detection Systems Market, By Region
6.6.12.5 Membrane Supply Systems: Other Gas Detection Systems Market, By Region
6.6.13 Membrane Air Dehydration Systems
6.6.13.1 Membrane Air Dehydration Systems: Atmospheric Gas Detection Systems Market, By Region
6.6.13.2 Membrane Air Dehydration Systems: Acetylene Gas Detection Systems Market, By Region
6.6.13.3 Membrane Air Dehydration Systems: Hydrogen Gas Detection Systems Market, By Region
6.6.13.4 Membrane Air Dehydration Systems: Helium Gas Detection Systems Market, By Region
6.6.13.5 Membrane Air Dehydration Systems: Other Gas Detection Systems Market, By Region
6.7 Cryogenic Products
6.7.1 Atmospheric Cryogenic Products Market, By Region
6.7.2 Atmospheric Cryogenic Products Market, By Subcategory
6.7.3 Acetylene Cryogenic Products Market, By Region
6.7.4 Acetylene Cryogenic Products Market, By Subcategory
6.7.5 Hydrogen Cryogenic Products Market, By Region
6.7.6 Hydrogen Cryogenic Products Market, By Subcategory
6.7.7 Helium Cryogenic Products Market, By Region
6.7.8 Helium Cryogenic Products Market, By Subcategory
6.7.9 Other Gases: Cryogenic Products Market, By Region
6.7.10 Other Gases: Cryogenic Products Market, By Subcategory
6.7.11 Vapor Shippers
6.7.11.1 Vapor Shippers: Atmospheric Cryogenic Products Market, By Region
6.7.11.2 Vapor Shippers: Acetylene Cryogenic Products Market, By Region
6.7.11.3 Vapor Shippers: Hydrogen Cryogenic Products Market, By Region
6.7.11.4 Vapor Shippers: Helium Cryogenic Products Market, By Region
6.7.11.5 Vapor Shippers: Other Gases Cryogenic Products Market, By Region
6.7.12 Cryogenic Storage
6.7.12.1 Cryogenic Storage: Atmospheric Cryogenic Products Market, By Region
6.7.12.2 Cryogenic Storage: Acetylene Cryogenic Products Market, By Region
6.7.12.3 Cryogenic Storage: Hydrogen Cryogenic Products Market, By Region
6.7.12.4 Cryogenic Storage: Helium Cryogenic Products Market, By Region
6.7.12.5 Cryogenic Storage: Other Gases Cryogenic Products Market, By Region
6.7.13 Pressure Vessels
6.7.13.1 Pressure Vessels: Atmospheric Cryogenic Products Market, By Region
6.7.13.2 Pressure Vessels: Acetylene Cryogenic Products Market, By Region
6.7.13.3 Pressure Vessels: Hydrogen Cryogenic Products Market, By Region
6.7.13.4 Pressure Vessels: Helium Cryogenic Products Market, By Region
6.7.13.5 Pressure Vessels: Other Gases Cryogenic Products Market, By Region
6.7.14 Cold Traps
6.7.14.1 Cold Traps: Atmospheric Cryogenic Products Market, By Region
6.7.14.2 Cold Traps: Acetylene Cryogenic Products Market, By Region
6.7.14.3 Cold Traps: Hydrogen Cryogenic Products Market, By Region
6.7.14.4 Cold Traps: Helium Cryogenic Products Market, By Region
6.7.14.5 Cold Traps: Other Gases Cryogenic Products Market, By Region
6.8 Accessories
6.8.1 Atmospheric Accessories Market, By Region
6.8.2 Atmospheric Accessories Market, By Subcategory
6.8.3 Acetylene Accessories Market, By Region
6.8.4 Acetylene Accessories Market, By Subcategory
6.8.5 Hydrogen Accessories Market, By Region
6.8.6 Hydrogen Accessories Market, By Subcategory
6.8.7 Helium Accessories Market, By Region
6.8.8 Helium Accessories Market, By Subcategory
6.8.9 Other Gases Accessories Market, By Region
6.8.10 Other Gases Accessories Market, By Subcategory
6.8.11 Standalone Alarms
6.8.11.1 Standalone Alarms: Atmospheric Accessories Market, By Region
6.8.11.2 Standalone Alarms: Acetylene Accessories Market, By Region
6.8.11.3 Standalone Alarms: Hydrogen Accessories Market, By Region
6.8.11.4 Standalone Alarms: Helium Accessories Market, By Region
6.8.11.5 Standalone Alarms: Other Gases Accessories Market, By Region
6.8.12 Emergency Shutdown Systems
6.8.12.1 Emergency Shutdown Systems: Atmospheric Accessories Market, By Region
6.8.12.2 Emergency Shutdown Systems: Acetylene Accessories Market, By Region
6.8.12.3 Emergency Shutdown Systems: Hydrogen Accessories Market, By Region
6.8.12.4 Emergency Shutdown Systems: Helium Accessories Market, By Region
6.8.12.5 Emergency Shutdown Systems: Other Gases Accessories Market, By Region
6.8.13 Diaphragm & Miniature Needle Valves
6.8.13.1 Diaphragm & Miniature Needle Valves: Atmospheric Gas Accessories Market, By Region
6.8.13.2 Diaphragm & Miniature Needle Valves: Acetylene Accessories Market, By Region
6.8.13.3 Diaphragm & Miniature Needle Valves: Hydrogen Accessories Market, By Region
6.8.13.4 Diaphragm & Miniature Needle Valves: Helium Accessories Market, By Region
6.8.13.5 Diaphragm & Miniature Needle Valves: Other Gas Accessories Market, By Region
6.8.14 Excess Flow Shut-Off Valves
6.8.14.1 Excess Flow Shut-Off Valves: Atmospheric Gas Accessories Market, By Region
6.8.14.2 Excess Flow Shut-Off Valves: Acetylene Accessories Market, By Region
6.8.14.3 Excess Flow Shut-Off Valves: Hydrogen Accessories Market, By Region
6.8.14.4 Excess Flow Shut-Off Valves: Helium Accessories Market, By Region
6.8.14.5 Excess Flow Shut-Off Valves: Other Gas Accessories Market, By Region
6.8.15 Check Valves & Relief Valves
6.8.15.1 Check Valves & Relief Valves: Atmospheric Gas Accessories Market, By Region
6.8.15.2 Check Valves & Relief Valves: Acetylene Accessories Market, By Region
6.8.15.3 Check Valves & Relief Valves: Hydrogen Accessories Market, By Region
6.8.15.4 Check Valves & Relief Valves: Helium Accessories Market, By Region
6.8.15.5 Check Valves & Relief Valves: Other Gas Accessories Market, By Region
6.8.16 Other Accessories
6.8.16.1 Other Accessories: Atmospheric Gas Accessories Market, By Region
6.8.16.2 Other Accessories: Acetylene Accessories Market, By Region
6.8.16.3 Other Accessories: Hydrogen Accessories Market, By Region
6.8.16.4 Other Accessories: Helium Accessories Market, By Region
6.8.16.5 Other Accessories: Other Gas Accessories Market, By Region
6.9 Gas Detection Systems
6.9.1 Atmospheric Gas Detection Systems Market, By Region
6.9.2 Atmospheric Gas Detection Systems Market, By Subcategory
6.9.3 Acetylene Gas Detection Systems Market, By Region
6.9.4 Acetylene Gas Detection Systems Market, By Subcategory
6.9.5 Hydrogen Gas Detection Systems Market, By Region
6.9.6 Hydrogen Gas Detection Systems Market, By Subcategory
6.9.7 Helium Gas Detection Systems Market, By Region
6.9.8 Helium Gas Detection Systems Market, By Subcategory
6.9.9 Other Gases: Gas Detection Systems Market, By Region
6.9.10 Other Gases Gas Detection Systems Market, By Sub-Category
6.9.11 Gas Detectors
6.9.11.1 Gas Detectors: Atmospheric Gas Detection Systems Market, By Region
6.9.11.2 Gas Detectors: Acetylene Gas Detection Systems Market, By Region
6.9.11.3 Gas Detectors: Hydrogen Gas Detection Systems Market, By Region
6.9.11.4 Gas Detectors: Helium Gas Detection Systems Market, By Region
6.9.11.5 Gas Detectors: Other Gases Gas Detection Systems Market, By Region
6.9.12 Gas Analyzers
6.9.12.1 Gas Analyzers: Atmospheric Gas Detection Systems Market, By Region
6.9.12.2 Gas Analyzers: Acetylene Gas Detection Systems Market, By Region
6.9.12.3 Gas Analyzers: Hydrogen Gas Detection Systems Market, By Region
6.9.12.4 Gas Analyzers: Helium Gas Detection Systems Market, By Region
6.9.12.5 Gas Analyzers: Other Gases Detection Systems Market, By Region
7 Gas Equipment Market, By Gas (Page No. - 298)
7.1 Introduction
7.2 Atmospheric Gases
7.2.1 Oxygen
7.2.2 Nitrogen
7.2.3 Argon
7.2.4 Carbon Dioxide
7.2.5 Atmospheric Gas Equipment Market, By Equipment Category
7.3 Hydrogen
7.3.1 Hydrogen Gas Equipment Market, By Equipment Category
7.4 Acetylene
7.4.1 Acetylene Gas Equipment Market, By Equipment Category
7.5 Helium
7.5.1 Helium Gas Equipment Market, By Equipment Category
7.6 Other Gases
7.6.1 Other Gases Gas Equipment Market, By Equipment Category
8 Gas Equipment Market, By Process (Page No. - 312)
8.1 Introduction
8.1.1 Gas Generation is Projected to Be the Dominant Process for Gas Equipment Market
8.2 Generation
8.2.1 Industrial Gas Generation Market, By Region
8.3 Storage
8.3.1 Industrial Gas Storage Market, By Region
8.4 Detection
8.4.1 Gas Detection Market, By Region
8.5 Transportation
8.5.1 Transportation Market, By Region
9 Gas Equipment Market, By End-Use Sector (Page No. - 317)
9.1 Introduction
9.1.1 Metal Fabrication Sector Was the Largest Consumer of Gas Equipment in 2015
9.2 Chemicals
9.2.1 Chemical Market, By Region
9.3 Metal Fabrication
9.3.1 Metal Fabrication Market, By Region
9.4 Healthcare & Medical
9.4.1 Healthcare & Medical Market, By Region
9.5 Oil & Gas
9.5.1 Oil & Gas Market, By Region
9.6 Others
9.6.1 Others Market Size, By Region
10 Gas Equipment Market, By Region (Page No. - 324)
10.1 Introduction
10.2 North America
10.2.1 North America: Gas Equipment Market, By Country
10.2.2 North America: Gas Equipment Market, By Equipment Category
10.2.2.1 North America: Gas Equipment Market, By Gas Delivery System
10.2.2.2 North America: Gas Equipment Market, By Flow Device
10.2.2.3 North America: Gas Equipment Market, By Gas Generating System
10.2.2.4 North America: Gas Equipment Market, By Gas Detection System
10.2.2.5 North America: Gas Equipment Market, By Cryogenic Product
10.2.2.6 North America: Gas Equipment Market, By Accessory
10.2.3 North America: Gas Equipment Market Size, By Gas
10.2.4 U.S.
10.2.4.1 U.S.: Economic Indicators
10.2.4.2 U.S.: Gas Equipment Market, By Equipment Category
10.2.4.2.1 U.S.: Gas Equipment Market, By Gas Delivery System
10.2.4.2.2 U.S.: Gas Equipment Market, By Flow Device
10.2.4.2.3 U.S.: Gas Equipment Market, By Gas Generating System
10.2.4.2.4 U.S.: Gas Equipment Market, By Gas Detection System
10.2.4.2.5 U.S.: Gas Equipment Market, By Cryogenic Product
10.2.4.2.6 U.S.: Gas Equipment Market, By Accessory
10.2.5 Canada
10.2.5.1 Canada: Economic Indicators
10.2.5.2 Canada: Gas Equipment Market, By Equipment Category
10.2.5.2.1 Canada: Gas Equipment Market, By Gas Delivery System
10.2.5.2.2 Canada: Gas Equipment Market, By Flow Device
10.2.5.2.3 Canada: Gas Equipment Market, By Gas Generating System
10.2.5.2.4 Canada: Gas Equipment Market, By Gas Detection System
10.2.5.2.5 Canada: Gas Equipment Market, By Cryogenic Product
10.2.5.2.6 Canada: Gas Equipment Market, By Accessory
10.2.6 Mexico
10.2.6.1 Mexico: Economic Indicators
10.2.6.2 Mexico: Gas Equipment Market, By Equipment Category
10.2.6.2.1 Mexico: Gas Equipment Market, By Gas Delivery System
10.2.6.2.2 Mexico: Gas Equipment Market, By Flow Device
10.2.6.2.3 Mexico: Gas Equipment Market, By Gas Generating System
10.2.6.2.4 Mexico: Gas Equipment Market, By Gas Detection System
10.2.6.2.5 Mexico: Gas Equipment Market, By Cryogenic Product
10.2.6.2.6 Mexico: Gas Equipment Market, By Accessory
10.3 Europe
10.3.1 Europe: Gas Equipment Market Size, By Country
10.3.2 Europe: Gas Equipment Market, By Equipment Category
10.3.2.1 Europe: Gas Equipment Market, By Gas Delivery System
10.3.2.2 Europe: Gas Equipment Market, By Flow Device
10.3.2.3 Europe: Gas Equipment Market, By Gas Generating System
10.3.2.4 Europe: Gas Equipment Market, By Gas Detection System
10.3.2.5 Europe: Gas Equipment Market, By Cryogenic Product
10.3.2.6 Europe: Gas Equipment Market, By Accessory
10.3.3 Europe: Gas Equipment Market Size, By Gas
10.3.4 Germany
10.3.4.1 Germany: Economic Indicators
10.3.4.2 Germany: Gas Equipment Market, By Equipment Category
10.3.4.2.1 Germany: Gas Equipment Market, By Gas Delivery System
10.3.4.2.2 Germany: Gas Equipment Market, By Flow Device
10.3.4.2.3 Germany: Gas Equipment Market, By Gas Generating System
10.3.4.2.4 Germany: Gas Equipment Market, By Gas Detection System
10.3.4.2.5 Germany: Gas Equipment Market, By Cryogenic Product
10.3.4.2.6 Germany: Gas Equipment Market, By Accessory
10.3.5 France
10.3.5.1 France: Economic Indicators
10.3.5.2 France: Gas Equipment Market, By Equipment Category
10.3.5.2.1 France: Gas Equipment Market, By Gas Delivery System
10.3.5.2.2 France: Gas Equipment Market, By Flow Device
10.3.5.2.3 France: Gas Equipment Market, By Gas Generating System
10.3.5.2.4 France: Gas Equipment Market, By Gas Detection System
10.3.5.2.5 France: Gas Equipment Market, By Cryogenic Product
10.3.5.2.6 France: Gas Equipment Market, By Accessory
10.3.6 U.K.
10.3.6.1 U.K.: Economic Indicators
10.3.6.2 U.K.: Gas Equipment Market, By Equipment Category
10.3.6.2.1 U.K.: Gas Equipment Market, By Gas Delivery Systems
10.3.6.2.2 U.K.: Gas Equipment Market, By Flow Device
10.3.6.2.3 U.K.: Gas Equipment Market, By Gas Generating System
10.3.6.2.4 U.K.: Gas Equipment Market, By Gas Detection System
10.3.6.2.5 U.K.: Gas Equipment Market, By Cryogenic Product
10.3.6.2.6 U.K.: Gas Equipment Market, By Accessory
10.3.7 Italy
10.3.7.1 Italy: Economic Indicators
10.3.7.2 Italy: Gas Equipment Market, By Equipment Category
10.3.7.2.1 Italy: Gas Equipment Market, By Gas Delivery System
10.3.7.2.2 Italy: Gas Equipment Market, By Flow Device
10.3.7.2.3 Italy: Gas Equipment Market, By Gas Generating System
10.3.7.2.4 Italy: Gas Equipment Market, By Gas Detection System
10.3.7.2.5 Italy: Gas Equipment Market, By Cryogenic Product
10.3.7.2.6 Italy: Gas Equipment Market, By Accessory
10.3.8 Spain
10.3.8.1 Spain: Economic Indicators
10.3.8.2 Spain: Gas Equipment Market, By Equipment Category
10.3.8.3 Spain: Gas Equipment Market Size, By Equipment Category, 2014�2021 (Thousand Units)
10.3.8.3.1 Spain: Gas Equipment Market, By Gas Delivery System
10.3.8.3.2 Spain: Gas Equipment Market, By Flow Device
10.3.8.3.3 Spain: Gas Equipment Market, By Gas Generating System
10.3.8.3.4 Spain: Gas Equipment Market, By Gas Detection System
10.3.8.3.5 Spain: Gas Equipment Market, By Cryogenic Product
10.3.8.3.6 Spain: Gas Equipment Market, By Accessory
10.3.9 Rest of Europe
10.3.9.1 Rest of Europe: Gas Equipment Market, By Equipment Category
10.3.9.1.1 Rest of Europe: Gas Equipment Market, By Gas Delivery System
10.3.9.1.2 Rest of Europe: Gas Equipment Market, By Flow Device
10.3.9.1.3 Rest of Europe: Gas Equipment Market, By Gas Generating System
10.3.9.1.4 Rest of Europe: Gas Equipment Market, By Gas Detection System
10.3.9.1.5 Rest of Europe: Gas Equipment Market, By Cryogenic Product
10.3.9.1.6 Rest of Europe: Gas Equipment Market, By Accessory
10.4 Asia-Pacific
10.4.1 Asia-Pacific: Gas Equipment Market, By Country
10.4.2 Asia-Pacific: Gas Equipment Market, By Equipment Category
10.4.2.1 Asia-Pacific: Gas Equipment Market, By Gas Delivery System
10.4.2.2 Asia-Pacific: Gas Equipment Market, By Flow Device
10.4.2.3 Asia-Pacific: Gas Equipment Market, By Gas Generating System
10.4.2.4 Asia-Pacific: Gas Equipment Market, By Gas Detection Systems
10.4.2.5 Asia-Pacific: Gas Equipment Market, By Cryogenic Product
10.4.2.6 Asia-Pacific: Gas Equipment Market, By Accessory
10.4.3 Asia-Pacific: Gas Equipment Market, By Gas
10.4.4 Japan
10.4.4.1 Japan: Economic Indicators
10.4.4.2 Japan: Gas Equipment Market, By Equipment Category
10.4.4.2.1 Japan: Gas Equipment Market, By Gas Delivery System
10.4.4.2.2 Japan: Gas Equipment Market, By Flow Device
10.4.4.2.3 Japan: Gas Equipment Market, By Gas Generating System
10.4.4.2.4 Japan: Gas Equipment Market, By Gas Detection System
10.4.4.2.5 Japan: Gas Equipment Market, By Cryogenic Product
10.4.4.2.6 Japan: Gas Equipment Market, By Accessory
10.4.5 China
10.4.5.1 China: Economic Indicators
10.4.5.2 China: Gas Equipment Market, By Equipment Category
10.4.5.2.1 China: Gas Equipment Market, By Gas Delivery System
10.4.5.2.2 China: Gas Equipment Market, By Flow Device
10.4.5.2.3 China: Gas Equipment Market, By Gas Generating System
10.4.5.2.4 China: Gas Equipment Market, By Gas Detection System
10.4.5.2.5 China: Gas Equipment Market, By Cryogenic Product
10.4.5.2.6 China: Gas Equipment Market, By Accessory
10.4.6 India
10.4.6.1 India: Economic Indicators
10.4.6.2 India: Gas Equipment Market, By Equipment Category
10.4.6.2.1 India: Gas Equipment Market, By Gas Delivery System
10.4.6.2.2 India: Gas Equipment Market, By Flow Device
10.4.6.2.3 India: Gas Equipment Market, By Gas Generating System
10.4.6.2.4 India: Gas Equipment Market, By Gas Detection System
10.4.6.2.5 India: Gas Equipment Market, By Cryogenic Product
10.4.6.2.6 India: Gas Equipment Market, By Accessory
10.4.7 Rest of Asia-Pacific
10.4.7.1 Rest of Asia-Pacific: Gas Equipment Market, By Equipment Category
10.4.7.1.1 Rest of Asia-Pacific: Gas Equipment Market, By Gas Delivery System
10.4.7.1.2 Rest of Asia-Pacific: Gas Equipment Market, By Flow Device
10.4.7.1.3 Rest of Asia-Pacific: Gas Equipment Market, By Gas Generating System
10.4.7.1.4 Rest of Asia-Pacific: Gas Equipment Market, By Gas Detection Systems
10.4.7.1.5 Rest of Asia-Pacific: Gas Equipment Market, By Cryogenic Product
10.4.7.1.6 Rest of Asia-Pacific: Gas Equipment Market, By Accessory
10.5 Rest of the World
10.5.1 RoW: Gas Equipment Market Size, By Country
10.5.2 RoW: Gas Equipment Market, By Equipment Category
10.5.2.1 RoW: Gas Equipment Market, By Gas Delivery System
10.5.2.2 RoW: Gas Equipment Market, By Flow Device
10.5.2.2.1 RoW: Gas Equipment Market, By Gas Generating System
10.5.2.3 RoW: Gas Equipment Market, By Gas Detection System
10.5.2.4 RoW: Gas Equipment Market, By Cryogenic Product
10.5.2.5 RoW: Gas Equipment Market, By Accessory
10.5.3 Brazil
10.5.3.1 Brazil: Economic Indicators
10.5.3.2 Brazil: Gas Equipment Market Size, By Equipment Category
10.5.3.2.1 Brazil: Gas Equipment Market, By Gas Delivery System
10.5.3.2.2 Brazil: Gas Equipment Market, By Flow Device
10.5.3.2.3 Brazil: Gas Equipment Market, By Gas Generating System
10.5.3.2.4 Brazil: Gas Equipment Market, By Gas Detection System
10.5.3.2.5 Brazil: Gas Equipment Market, By Cryogenic Product
10.5.3.2.6 Brazil: Gas Equipment Market, By Accessory
10.5.4 Others in RoW
10.5.4.1 Others in RoW: Gas Equipment Market Size, By Equipment Category
10.5.4.1.1 Others in RoW: Gas Equipment Market, By Gas Delivery System
10.5.4.1.2 Others in RoW: Gas Equipment Market, By Flow Device
10.5.4.1.3 Others in RoW: Gas Equipment Market, By Gas Generating System
10.5.4.1.4 Others in RoW: Gas Equipment Market, By Gas Detection System
10.5.4.1.5 Others in RoW: Gas Equipment Market, By Cryogenic Product
10.5.4.1.6 Others in RoW: Gas Equipment Market, By Accessory
11 Competitive Landscape (Page No. - 486)
11.1 Overview
11.1.1 Growth Scenario of Top Five Companies in the Gas Equipment Market (2010�2014)
11.2 Competitive Situation & Trends
11.2.1 Mergers & Acquisitions and New Product Launches Have Fuelled the Growth of the Gas Equipment Market
11.2.2 Mergers & Acquisitions and New Product Launches Were the Key Strategies Undertaken By Market Leaders in the Gas Equipment Market
11.2.3 New Product Development
11.3 Mergers & Acquisitions
11.4 Contracts and Agreements
11.5 Expansions
12 Company Profiles (Page No. - 495)
(Company at A Glance, Recent Financials, Products & Services, Strategies & Insights, & Recent Developments)*
12.1 Introduction
12.2 Linde AG
12.3 Air Liquide S.A.
12.4 Praxair, Inc.
12.5 Air Products and Chemicals, Inc.
12.6 Iwatani Corporation
12.7 Colfax Corporation
12.8 Itron, Inc.
12.9 Matheson Tri-Gas Inc.
12.10 Messer Group GmbH
12.11 GCE Holding AB
*Details on Company at A Glance, Recent Financials, Products & Services, Strategies & Insights, & Recent Developments Might Not Be Captured in Case of Unlisted Companies.
13 Appendix (Page No. - 526)
13.1 Discussion Guide
13.2 Knowledge Store: Marketsandmarkets� Subscription Portal
13.3 Introducing RT: Real Time Market Intelligence
13.4 Available Customizations
13.5 Related Reports
List of Tables (722 Tables)
Table 1 Industrial Regulations for Gases
Table 2 Regulations on Transportation and Storage of Gas Cylinders
Table 3 Gas Equipment Market Size, By Equipment Category, 2014�2021 (USD Million)
Table 4 Gas Equipment Market Size, By Equipment Category, 2014�2021 (Thousand Units)
Table 5 Atmospheric Gas Delivery Systems Market Size, By Region, 2014�2021 (USD Million)
Table 6 Atmospheric Gas Delivery Systems Market Size, By Region, 2014�2021 (Thousand Units)
Table 7 Atmospheric Gas Delivery Systems Market Size, By Subcategory, 2014�2021 (USD Million)
Table 8 Atmospheric Gas Delivery Systems Market Size, By Sub-Category, 2014�2021 (Thousand Units)
Table 9 Acetylene Gas Delivery Systems Market Size, By Region, 2014�2021 (USD Million)
Table 10 Acetylene Gas Delivery Systems Market Size, By Region, 2014�2021 (Thousand Units)
Table 11 Acetylene Gas Delivery Systems Market Size, By Subcategory, 2014�2021 (USD Million)
Table 12 Acetylene Gas Delivery Systems Market Size, By Sub-Category, 2014�2021 (Thousand Units)
Table 13 Hydrogen Gas Delivery Systems Market Size, By Region, 2014�2021 (USD Million)
Table 14 Hydrogen Gas Delivery Systems Market Size, By Region, 2014�2021 (Thousand Units)
Table 15 Hydrogen Gas Delivery Systems Market Size, By Subcategory, 2014�2021 (USD Million)
Table 16 Hydrogen Gas Delivery Systems Market Size, By Sub-Category, 2014�2021 (Thousand Units)
Table 17 Helium Gas Delivery Systems Market Size, By Region, 2014�2021 (USD Million)
Table 18 Helium Gas Delivery Systems Market Size, By Region, 2014�2021 (Thousand Units)
Table 19 Helium Gas Delivery Systems Market Size, By Subcategory, 2014�2021 (USD Million)
Table 20 Helium Gas Delivery Systems Market Size, By Sub-Category, 2014�2021 (Thousand Units)
Table 21 Other Gases: Gas Delivery Systems Market Size, By Region, 2014�2021 (USD Million)
Table 22 Other Gas Delivery Systems Market Size, By Region, 2014�2021 (Thousand Units)
Table 23 Other Gases Gas Delivery Systems Market Size, By Subcategory, 2014�2021 (USD Million)
Table 24 Other Gases Gas Delivery Systems Market Size, By Sub-Category, 2014�2021 (Thousand Units)
Table 25 Gas Cylinders: Atmospheric Gas Delivery Systems Market Size, By Region, 2014�2021 (USD Million)
Table 26 Gas Cylinders: Atmospheric Gas Delivery Systems Market Size, By Region, 2014�2021 (Thousand Units)
Table 27 Gas Cylinders: Acetylene Gas Delivery Systems Market Size, By Region, 2014�2021 (USD Million)
Table 28 Gas Cylinders: Acetylene Gas Delivery Systems Market Size, By Region, 2014�2021 (Thousand Units)
Table 29 Gas Cylinders: Hydrogen Gas Delivery Systems Market Size, By Region, 2014�2021 (USD Million)
Table 30 Gas Cylinders: Hydrogen Gas Delivery Systems Market Size, By Region, 2014�2021 (Thousand Units)
Table 31 Gas Cylinders: Helium Gas Delivery Systems Market Size, By Region, 2014�2021 (USD Million)
Table 32 Gas Cylinders: Helium Gas Delivery Systems Market Size, By Region, 2014�2021 (Thousand Units)
Table 33 Gas Cylinders: Other Gases Delivery Systems Market Size, By Region, 2014�2021 (USD Million)
Table 34 Gas Cylinders: Other Gases Delivery Systems Market Size, By Region, 2014�2021 (Thousand Units)
Table 35 Manifolds: Atmospheric Gas Delivery Systems Market Size, By Region, 2014�2021 (USD Million)
Table 36 Manifolds: Atmospheric Gas Delivery Systems Market Size, By Region, 2014�2021 (Thousand Units)
Table 37 Manifolds: Acetylene Gas Delivery Systems Market Size, By Region, 2014�2021 (USD Million)
Table 38 Manifolds: Acetylene Gas Delivery Systems Market Size, By Region, 2014�2021 (Thousand Units)
Table 39 Manifolds: Hydrogen Gas Delivery Systems Market Size, By Region, 2014�2021 (USD Million)
Table 40 Manifolds: Hydrogen Gas Delivery Systems Market Size, By Region, 2014�2021 (Thousand Units)
Table 41 Manifolds: Helium Gas Delivery Systems Market Size, By Region, 2014�2021 (USD Million)
Table 42 Manifolds: Helium Gas Delivery Systems Market Size, By Region, 2014�2021 (Thousand Units)
Table 43 Manifolds: Other Gases Delivery Systems Market Size, By Region, 2014�2021 (USD Million)
Table 44 Manifolds: Other Gases Delivery Systems Market Size, By Region, 2014�2021 (Thousand Units)
Table 45 Switchovers: Atmospheric Gas Delivery Systems Market Size, By Region, 2014�2021 (USD Million)
Table 46 Switchovers: Atmospheric Gas Delivery Systems Market Size, By Region, 2014�2021 (Thousand Units)
Table 47 Switchovers: Acetylene Gas Delivery Systems Market Size, By Region, 2014�2021 (USD Million)
Table 48 Switchovers: Acetylene Gas Delivery Systems Market Size, By Region, 2014�2021 (Thousand Units)
Table 49 Switchovers: Hydrogen Gas Delivery Systems Market Size, By Region, 2014�2021 (USD Million)
Table 50 Switchovers: Hydrogen Gas Delivery Systems Market Size, By Region, 2014�2021 (Thousand Units)
Table 51 Switchovers: Helium Gas Delivery Systems Market Size, By Region, 2014�2021 (USD Million)
Table 52 Switchovers: Helium Gas Delivery Systems Market Size, By Region, 2014�2021 (Thousand Units)
Table 53 Switchovers: Other Gases Delivery Systems Market Size, By Region, 2014�2021 (USD Million)
Table 54 Switchovers: Other Gases Delivery Systems Market Size, By Region, 2014�2021 (Thousand Units)
Table 55 Gas Cabinets: Atmospheric Gas Delivery Systems Market Size, By Region, 2014�2021 (USD Million)
Table 56 Gas Cabinets: Atmospheric Gas Delivery Systems Market Size, By Region, 2014�2021 (Thousand Units)
Table 57 Gas Cabinets: Acetylene Gas Delivery Systems Market Size, By Region, 2014�2021 (USD Million)
Table 58 Gas Cabinets: Acetylene Gas Delivery Systems Market Size, By Region, 2014�2021 (Thousand Units)
Table 59 Gas Cabinets: Hydrogen Gas Delivery Systems Market Size, By Region, 2014�2021 (USD Million)
Table 60 Gas Cabinets: Hydrogen Gas Delivery Systems Market Size, By Region, 2014�2021 (Thousand Units)
Table 61 Gas Cabinets: Helium Gas Delivery Systems Market Size, By Region, 2014�2021 (USD Million)
Table 62 Gas Cabinets: Helium Gas Delivery Systems Market Size, By Region, 2014�2021 (Thousand Units)
Table 63 Gas Cabinets: Other Gases Delivery Systems Market Size, By Region, 2014�2021 (USD Million)
Table 64 Gas Cabinets: Other Gases Delivery Systems Market Size, By Region, 2014�2021 (Thousand Units)
Table 65 Protocol Stations: Atmospheric Gas Delivery Systems Market Size, By Region, 2014�2021 (USD Million)
Table 66 Protocol Stations: Atmospheric Gas Delivery Systems Market Size, By Region, 2014�2021 (Thousand Units)
Table 67 Protocol Stations: Acetylene Gas Delivery Systems Market Size, By Region, 2014�2021 (USD Million)
Table 68 Protocol Stations: Acetylene Gas Delivery Systems Market Size, By Region, 2014�2021 (Thousand Units)
Table 69 Protocol Stations: Hydrogen Gas Delivery Systems Market Size, By Region, 2014�2021 (USD Million)
Table 70 Protocol Stations: Hydrogen Gas Delivery Systems Market Size, By Region, 2014�2021 (Thousand Units)
Table 71 Protocol Stations: Helium Gas Delivery Systems Market Size, By Region, 2014�2021 (USD Million)
Table 72 Protocol Stations: Helium Gas Delivery Systems Market Size, By Region, 2014�2021 (Thousand Units)
Table 73 Protocol Stations: Other Gases Delivery Systems Market Size, By Region, 2014�2021 (USD Million)
Table 74 Protocol Stations: Other Gases Delivery Systems Market Size, By Region, 2014�2021 (Thousand Units)
Table 75 Changeovers: Atmospheric Gas Delivery Systems Market Size, By Region, 2014�2021 (USD Million)
Table 76 Changeovers: Atmospheric Gas Delivery Systems Market Size, By Region, 2014�2021 (Thousand Units)
Table 77 Changeovers: Acetylene Gas Delivery Systems Market Size, By Region, 2014�2021 (USD Million)
Table 78 Changeovers: Acetylene Gas Delivery Systems Market Size, By Region, 2014�2021 (Thousand Units)
Table 79 Changeovers: Hydrogen Gas Delivery Systems Market Size, By Region, 2014�2021 (USD Million)
Table 80 Changeovers: Hydrogen Gas Delivery Systems Market Size, By Region, 2014�2021 (Thousand Units)
Table 81 Changeovers: Helium Gas Delivery Systems Market Size, By Region, 2014�2021 (USD Million)
Table 82 Changeovers: Helium Gas Delivery Systems Market Size, By Region, 2014�2021 (Thousand Units)
Table 83 Changeovers: Other Gas Delivery Systems Market Size, By Region, 2014�2021 (USD Million)
Table 84 Changeovers: Other Gases Delivery Systems Market Size, By Region, 2014�2021 (Thousand Units)
Table 85 Atmospheric Gas Regulators Market Size, By Region, 2014�2021 (USD Million)
Table 86 Atmospheric Gas Regulators Market Size, By Region, 2014�2021 (Thousand Units)
Table 87 Acetylene Gas Regulators Market Size, By Region, 2014�2021 (USD Million)
Table 88 Acetylene Gas Regulators Market Size, By Region, 2014�2021 (Thousand Units)
Table 89 Hydrogen Gas Regulators Market Size, By Region, 2014�2021 (USD Million)
Table 90 Hydrogen Gas Regulators Market Size, By Region, 2014�2021 (Thousand Units)
Table 91 Helium Gas Regulators Market Size, By Region, 2014�2021 (USD Million)
Table 92 Helium Gas Regulators Market Size, By Region, 2014�2021 (Thousand Units)
Table 93 Other Gases: Regulators Market Size, By Region, 2014�2021 (USD Million)
Table 94 Other Gases: Regulators Market Size, By Region, 2014�2021 (Thousand Units)
Table 95 Atmospheric Purifiers & Filters Market Size, By Region, 2014�2021 (USD Million)
Table 96 Atmospheric Purifiers & Filters Market Size, By Region, 2014�2021 (Thousand Units)
Table 97 Acetylene Purifiers & Filters Market Size, By Region, 2014�2021 (USD Million)
Table 98 Acetylene Purifiers & Filters Market Size, By Region, 2014�2021 (Thousand Units)
Table 99 Hydrogen Purifiers & Filters Market Size, By Region, 2014�2021 (USD Million)
Table 100 Hydrogen Purifiers & Filters Market Size, By Region, 2014�2021 (Thousand Units)
Table 101 Helium Purifiers & Filters Market Size, By Region, 2014�2021 (USD Million)
Table 102 Helium Purifiers & Filters Market Size, By Region, 2014�2021 (Thousand Units)
Table 103 Other Gases Purifiers & Filters Market Size, By Region, 2014�2021 (USD Million)
Table 104 Other Gases Purifiers & Filters Market Size, By Region, 2014�2021 (Thousand Units)
Table 105 Atmospheric Flow Devices Market Size, By Region, 2014�2021 (USD Million)
Table 106 Atmospheric Flow Devices Market Size, By Region, 2014�2021 (Thousand Units)
Table 107 Atmospheric Flow Devices Market Size, By Subcategory, 2014�2021 (USD Million)
Table 108 Atmospheric Flow Devices Market Size, By Subcategory, 2014�2021 (Thousand Units)
Table 109 Acetylene Flow Devices Market Size, By Region, 2014�2021 (USD Million)
Table 110 Acetylene Flow Devices Market Size, By Region, 2014�2021 (Thousand Units)
Table 111 Acetylene Flow Devices Market Size, By Subcategory, 2014�2021 (USD Million)
Table 112 Acetylene Flow Devices Market Size, By Subcategory, 2014�2021 (Thousand Units)
Table 113 Hydrogen Flow Devices Market Size, By Region, 2014�2021 (USD Million)
Table 114 Hydrogen Flow Devices Market Size, By Region, 2014�2021 (Thousand Units)
Table 115 Hydrogen Flow Devices Market Size, By Subcategory, 2014�2021 (USD Million)
Table 116 Hydrogen Flow Devices Market Size, By Subcategory, 2014�2021 (Thousand Units)
Table 117 Helium Flow Devices Market Size, By Region, 2014�2021 (USD Million)
Table 118 Helium Flow Devices Market Size, By Region, 2014�2021 (Thousand Units)
Table 119 Helium Flow Devices Market Size, By Subcategory, 2014�2021 (USD Million)
Table 120 Helium Flow Devices Market Size, By Subcategory, 2014�2021 (Thousand Units)
Table 121 Other Gases: Flow Devices Market Size, By Region, 2014�2021 (USD Million)
Table 122 Other Gases: Flow Devices Market Size, By Region, 2014�2021 (Thousand Units)
Table 123 Other Gases: Flow Devices Market Size, By Subcategory, 2014�2021 (USD Million)
Table 124 Other Gases: Flow Devices Market Size, By Subcategory, 2014�2021 (Thousand Units)
Table 125 Flow Meters: Atmospheric Flow Devices Market Size, By Region, 2014�2021 (USD Million)
Table 126 Flow Meters: Atmospheric Flow Devices Market Size, By Region, 2014�2021 (Thousand Units)
Table 127 Flow Meters: Atmospheric Flow Devices Market Size, By Subcategory, 2014�2021 (USD Million)
Table 128 Flow Meters: Atmospheric Flow Devices Market Size, By Subcategory, 2014�2021 (Thousand Units)
Table 129 High-Capacity Flow Meters: Atmospheric Flow Meters Market Size, By Region, 2014�2021 (USD Million)
Table 130 High-Capacity Flow Meters: Atmospheric Flow Meters Market Size, By Region, 2014�2021 (Thousand Units)
Table 131 Variable Area Flow Meters: Atmospheric Flow Meters Market Size, By Region, 2014�2021 (USD Million)
Table 132 Variable Area Flow Meters: Atmospheric Flow Meters Market Size, By Region, 2014�2021 (Thousand Units)
Table 133 Flow Meters: Acetylene Flow Devices Market Size, By Region, 2014�2021 (USD Million)
Table 134 Flow Meters: Acetylene Flow Devices Market Size, By Region, 2014�2021 (Thousand Units)
Table 135 Flow Meters: Acetylene Flow Devices Market Size, By Subcategory, 2014�2021 (USD Million)
Table 136 Flow Meters: Acetylene Flow Devices Market Size, By Subcategory, 2014�2021 (Thousand Units)
Table 137 High-Capacity Flow Meters: Acetylene Flow Meters Market Size, By Region, 2014�2021 (USD Million)
Table 138 High-Capacity Flow Meters: Acetylene Flow Meters Market Size, By Region, 2014�2021 (Thousand Units)
Table 139 Variable Area Flow Meters: Acetylene Flow Meters Market Size, By Region, 2014�2021 (USD Million)
Table 140 Variable Area Flow Meters: Acetylene Flow Meters Market Size, By Region, 2014�2021 (Thousand Units)
Table 141 Flow Meters: Hydrogen Flow Devices Market Size, By Region, 2014�2021 (USD Million)
Table 142 Flow Meters: Hydrogen Flow Devices Market Size, By Region, 2014�2021 (Thousand Units)
Table 143 Flow Meters: Hydrogen Flow Devices Market Size, By Subcategory, 2014�2021 (USD Million)
Table 144 Flow Meters: Hydrogen Flow Devices Market Size, By Subcategory, 2014�2021 (Thousand Units)
Table 145 High-Capacity Flow Meters: Hydrogen Flow Meters Market Size, By Region, 2014�2021 (USD Million)
Table 146 High-Capacity Flow Meters: Hydrogen Flow Meters Market Size, By Region, 2014�2021 (Thousand Units)
Table 147 Variable Area Flow Meters: Hydrogen Flow Meters Market Size, By Region, 2014�2021 (USD Million)
Table 148 Variable Area Flow Meters: Hydrogen Flow Meters Market Size, By Region, 2014�2021 (Thousand Units)
Table 149 Flow Meters: Helium Flow Devices Market Size, By Region, 2014�2021 (USD Million)
Table 150 Flow Meters: Helium Flow Devices Market Size, By Region, 2014�2021 (Thousand Units)
Table 151 Flow Meters: Helium Flow Devices Market Size, By Subcategory, 2014�2021 (USD Million)
Table 152 Flow Meters: Helium Flow Devices Market Size, By Subcategory, 2014�2021 (Thousand Units)
Table 153 High-Capacity Flow Meters: Helium Flow Meters Market Size, By Region, 2014�2021 (USD Million)
Table 154 High-Capacity Flow Meters: Helium Flow Meters Market Size, By Region, 2014�2021 (Thousand Units)
Table 155 Variable Area Flow Meters: Helium Flow Meters Market Size, By Region, 2014�2021 (USD Million)
Table 156 Variable Area Flow Meters: Helium Flow Meters Market Size, By Region, 2014�2021 (Thousand Units)
Table 157 Flow Meters: Flow Devices Market Size for Other Gases, By Region, 2014�2021 (USD Million)
Table 158 Flow Meters: Flow Devices Market Size for Other Gases, By Region, 2014�2021 (Thousand Units)
Table 159 Flow Meters: Flow Devices Market Size for Other Gases, By Subcategory, 2014�2021 (USD Million)
Table 160 Flow Meters: Flow Devices Market Size for Other Gases, By Subcategory, 2014�2021 (Thousand Units)
Table 161 High-Capacity Flow Meters: Flow Meters Market Size for Other Gases, By Region, 2014�2021 (USD Million)
Table 162 High-Capacity Flow Meters: Flow Meters Market Size for Other Gases, By Region, 2014�2021 (Thousand Units)
Table 163 Variable Area Flow Meters: Flow Meters Market Size for Other Gases, By Region, 2014�2021 (USD Million)
Table 164 Variable Area Flow Meters: Flow Meters Market Size for Other Gases, By Region, 2014�2021 (Thousand Units)
Table 165 Gas Blenders: Atmospheric Flow Devices Market Size, By Region, 2014�2021 (USD Million)
Table 166 Gas Blenders: Atmospheric Flow Devices Market Size, By Region, 2014�2021 (Thousand Units)
Table 167 Gas Blenders: Acetylene Flow Devices Market Size, By Region, 2014�2021 (USD Million)
Table 168 Gas Blenders: Acetylene Flow Devices Market Size, By Region, 2014�2021 (Thousand Units)
Table 169 Gas Blenders: Hydrogen Flow Devices Market Size, By Region, 2014�2021 (USD Million)
Table 170 Gas Blenders: Hydrogen Flow Devices Market Size, By Region, 2014�2021 (Thousand Units)
Table 171 Gas Blenders: Helium Flow Devices Market Size, By Region, 2014�2021 (USD Million)
Table 172 Gas Blenders: Helium Flow Devices Market Size, By Region, 2014�2021 (Thousand Units)
Table 173 Gas Blenders: Flow Devices Market Size for Other Gases, By Region, 2014�2021 (USD Million)
Table 174 Gas Blenders: Flow Devices Market Size for Other Gases, By Region, 2014�2021 (Thousand Units)
Table 175 Other Flow Devices: Atmospheric Flow Devices Market Size, By Region, 2014�2021 (USD Million)
Table 176 Other Flow Devices: Atmospheric Flow Devices Market Size, By Region, 2014�2021 (Thousand Units)
Table 177 Other Flow Devices: Acetylene Flow Devices Market Size, By Region, 2014�2021 (USD Million)
Table 178 Other Flow Devices: Acetylene Flow Devices Market Size, By Region, 2014�2021 (Thousand Units)
Table 179 Other Flow Devices: Hydrogen Flow Devices Market Size, By Region, 2014�2021 (USD Million)
Table 180 Other Flow Devices: Hydrogen Flow Devices Market Size, By Region, 2014�2021 (Thousand Units)
Table 181 Other Flow Devices: Helium Flow Devices Market Size, By Region, 2014�2021 (USD Million)
Table 182 Other Flow Devices: Helium Flow Devices Market Size, By Region, 2014�2021 (Thousand Units)
Table 183 Other Flow Devices: Flow Devices Market Size for Other Gases, By Region, 2014�2021 (USD Million)
Table 184 Other Flow Devices: Flow Devices Market Size for Other Gases, By Region, 2014�2021 (Thousand Units)
Table 185 Atmospheric Gas Generating Systems Market Size, By Region, 2014�2021 (USD Million)
Table 186 Atmospheric Gas Generating Systems Market Size, By Region, 2014�2021 (Thousand Units)
Table 187 Atmospheric Gas Generating Systems Market Size, By Subcategory, 2014�2021 (USD Million)
Table 188 Atmospheric Gas Generating Systems Market Size, By Sub-Category, 2014�2021 (Thousand Units)
Table 189 Acetylene Gas Generating Systems Market Size, By Region, 2014�2021 (USD Million)
Table 190 Acetylene Gas Generators Market Size, By Region, 2014�2021 (Thousand Units)
Table 191 Acetylene Gas Generating Systems Market Size, By Subcategory, 2014�2021 (USD Million)
Table 192 Acetylene Gas Generating Systems Market Size, By Sub-Category, 2014�2021 (Thousand Units)
Table 193 Hydrogen Gas Generating Systems Market Size, By Region, 2014�2021 (USD Million)
Table 194 Hydrogen Gas Generating Systems Market Size, By Region, 2014�2021 (Thousand Units)
Table 195 Hydrogen Gas Generating Systems Market Size, By Subcategory , 2014�2021 (USD Million)
Table 196 Hydrogen Gas Generating Systems Market Size, By Sub-Category, 2014�2021 (Thousand Units)
Table 197 Helium Gas Generating Systems Market Size, By Region, 2014�2021 (USD Million)
Table 198 Helium Gas Generators Market Size, By Region, 2014�2021 (Thousand Units)
Table 199 Helium Gas Generating Systems Market Size, By Subcategory, 2014�2021 (USD Million)
Table 200 Helium Gas Generating Systems Market Size, By Sub-Category, 2014�2021 (Thousand Units)
Table 201 Other Gases Gas Generating Systems Market Size, By Region, 2014�2021 (USD Million)
Table 202 Other Gases: Gas Generating Systems Market Size, By Region, 2014�2021 (Thousand Units)
Table 203 Other Gases Gas Generating Systems Market Size, By Subcategory, 2014�2021 (USD Million)
Table 204 Other Gases: Gas Generating Systems Market Size, By Sub-Category, 2014�2021 (Thousand Units)
Table 205 Gas Generators: Atmospheric Gas Detection Systems Market Size, By Region, 2014�2021 (USD Million)
Table 206 Gas Generators: Atmospheric Gas Detection Systems Market Size, By Region, 2014�2021 (Thousand Units)
Table 207 Gas Generators: Acetylene Gas Detection Systems Market Size, By Region, 2014�2021 (USD Million)
Table 208 Gas Generators: Acetylene Gas Detection Systems Market Size, By Region, 2014�2021 (Thousand Units)
Table 209 Gas Generators: Hydrogen Gas Detection Systems Market Size, By Region, 2014�2021 (USD Million)
Table 210 Gas Generators: Hydrogen Gas Detection Systems Market Size, By Region, 2014�2021 (Thousand Units)
Table 211 Gas Generators: Helium Gas Detection Systems Market Size, By Region, 2014�2021 (USD Million)
Table 212 Gas Generators: Helium Gas Detection Systems Market Size, By Region, 2014�2021 (Thousand Units)
Table 213 Gas Generators: Other Gas Detection Systems Market Size, By Region, 2014�2021 (USD Million)
Table 214 Gas Generators: Other Gas Detection Systems Market Size, By Region, 2014�2021 (Thousand Units)
Table 215 Membrane Supply Systems: Atmospheric Gas Detection Systems Market Size, By Region, 2014�2021 (USD Million)
Table 216 Membrane Supply Systems: Atmospheric Gas Detection Systems Market Size, By Region, 2014�2021 (Thousand Units)
Table 217 Membrane Supply Systems: Acetylene Gas Detection Systems Market Size, By Region, 2014�2021 (USD Million)
Table 218 Membrane Supply Systems: Acetylene Gas Detection Systems Market Size, By Region, 2014�2021 (Thousand Units)
Table 219 Membrane Supply Systems: Hydrogen Gas Detection Systems Market Size, By Region, 2014�2021 (USD Million)
Table 220 Membrane Supply Systems: Hydrogen Gas Detection Systems Market Size, By Region, 2014�2021 (Thousand Units)
Table 221 Membrane Supply Systems: Helium Gas Detection Systems Market Size, By Region, 2014�2021 (USD Million)
Table 222 Membrane Supply Systems: Helium Gas Detection Systems Market Size, By Region, 2014�2021 (Thousand Units)
Table 223 Membrane Supply Systems: Other Gas Detection Systems Market Size, By Region, 2014�2021 (USD Million)
Table 224 Membrane Supply Systems: Other Gas Detection Systems Market Size, By Region, 2014�2021 (Thousand Units)
Table 225 Membrane Air Dehydration Systems: Atmospheric Gas Detection Systems Market Size, By Region, 2014�2021 (USD Million)
Table 226 Membrane Air Dehydration Systems: Atmospheric Gas Detection Systems Market Size, By Region, 2014�2021 (Thousand Units)
Table 227 Membrane Air Dehydration Systems: Acetylene Gas Detection Systems Market Size, By Region, 2014�2021 (USD Million)
Table 228 Membrane Air Dehydration Systems: Acetylene Gas Detection Systems Market Size, By Region, 2014�2021 (Thousand Units)
Table 229 Membrane Air Dehydration Systems: Hydrogen Gas Detection Systems Market Size, By Region, 2014�2021 (USD Million)
Table 230 Membrane Air Dehydration Systems: Hydrogen Gas Detection Systems Market Size, By Region, 2014�2021 (Thousand Units)
Table 231 Membrane Air Dehydration Systems: Helium Gas Detection Systems Market Size, By Region, 2014�2021 (USD Million)
Table 232 Membrane Air Dehydration Systems: Helium Gas Detection Systems Market Size, By Region, 2014�2021 (Thousand Units)
Table 233 Membrane Air Dehydration Systems: Other Gas Detection Systems Market Size, By Region, 2014�2021 (USD Million)
Table 234 Membrane Air Dehydration Systems: Other Gas Detection Systems Market Size, By Region, 2014�2021 (Thousand Units)
Table 235 Atmospheric Cryogenic Products Market Size, By Region, 2014�2021 (USD Million)
Table 236 Atmospheric Cryogenic Products Market Size, By Region, 2014�2021 (Thousand Units)
Table 237 Atmospheric Cryogenic Products Market Size, By Subcategory, 2014�2021 (USD Million)
Table 238 Atmospheric Cryogenic Products Market Size, By Sub-Category, 2014�2021 (Thousand Units)
Table 239 Acetylene Cryogenic Products Market Size, By Region, 2014�2021 (USD Million)
Table 240 Acetylene Cryogenic Products Market Size, By Region, 2014�2021 (Thousand Units)
Table 241 Acetylene Cryogenic Products Market Size, By Subcategory, 2014�2021 (USD Million)
Table 242 Acetylene Cryogenic Products Market Size, By Sub-Category, 2014�2021 (Thousand Units)
Table 243 Hydrogen Cryogenic Products Market Size, By Region, 2014�2021 (USD Million)
Table 244 Hydrogen Cryogenic Products Market Size, By Region, 2014�2021 (Thousand Units)
Table 245 Hydrogen Cryogenic Products Market Size, By Subcategory, 2014�2021 (USD Million)
Table 246 Hydrogen Cryogenic Products Market Size, By Sub-Category, 2014�2021 (Thousand Units)
Table 247 Helium Cryogenic Products Market Size, By Region, 2014�2021 (USD Million)
Table 248 Helium Cryogenic Products Market Size, By Region, 2014�2021 (Thousand Units)
Table 249 Helium Cryogenic Products Market Size, By Subcategory, 2014�2021 (USD Million)
Table 250 Helium Cryogenic Products Market Size, By Sub-Category, 2014�2021 (Thousand Units)
Table 251 Other Gases: Cryogenic Products Market Size, By Region, 2014�2021 (USD Million)
Table 252 Other Gases: Cryogenic Products Market Size, By Region, 2014�2021 (Thousand Units)
Table 253 Other Gases: Cryogenic Products Market Size, By Subcategory, 2014�2021 (USD Million)
Table 254 Other Gases: Cryogenic Products Market Size, By Sub-Category, 2014�2021 (Thousand Units)
Table 255 Vapor Shippers: Atmospheric Cryogenic Products Market Size, By Region, 2014�2021 (USD Million)
Table 256 Vapor Shippers: Atmospheric Cryogenic Products Market Size, By Region, 2014�2021 (Thousand Units)
Table 257 Vapor Shippers: Acetylene Cryogenic Products Market Size, By Region, 2014�2021 (USD Million)
Table 258 Vapor Shippers: Acetylene Cryogenic Products Market Size, By Region, 2014�2021 (Thousand Units)
Table 259 Vapor Shippers: Hydrogen Cryogenic Products Market Size, By Region, 2014�2021 (USD Million)
Table 260 Vapor Shippers: Hydrogen Cryogenic Products Market Size, By Region, 2014�2021 (Thousand Units)
Table 261 Vapor Shippers: Helium Cryogenic Products Market Size, By Region, 2014�2021 (USD Million)
Table 262 Vapor Shippers: Helium Cryogenic Products Market Size, By Region, 2014�2021 (Thousand Units)
Table 263 Vapor Shippers: Other Gases Cryogenic Products Market Size, By Region, 2014�2021 (USD Million)
Table 264 Vapor Shippers: Other Gases Cryogenic Products Market Size, By Region, 2014�2021 (Thousand Units)
Table 265 Cryogenic Storage: Atmospheric Cryogenic Products Market Size, By Region, 2014�2021 (USD Million)
Table 266 Cryogenic Storage: Atmospheric Cryogenic Products Market Size, By Region, 2014�2021 (Thousand Units)
Table 267 Cryogenic Storage: Acetylene Cryogenic Products Market Size, By Region, 2014�2021 (USD Million)
Table 268 Cryogenic Storage: Acetylene Cryogenic Products Market Size, By Region, 2014�2021 (Thousand Units)
Table 269 Cryogenic Storage: Hydrogen Cryogenic Products Market Size, By Region, 2014�2021 (USD Million)
Table 270 Cryogenic Storage: Hydrogen Cryogenic Products Market Size, By Region, 2014�2021 (Thousand Units)
Table 271 Cryogenic Storage: Helium Cryogenic Products Market Size, By Region, 2014�2021 (USD Million)
Table 272 Cryogenic Storage: Helium Cryogenic Products Market Size, By Region, 2014�2021 (Thousand Units)
Table 273 Cryogenic Storage: Other Gases Cryogenic Products Market Size, By Region, 2014�2021 (USD Million)
Table 274 Cryogenic Storage: Other Gases Cryogenic Products Market Size, By Region, 2014�2021 (Thousand Units)
Table 275 Pressure Vessels: Atmospheric Cryogenic Products Market Size, By Region, 2014�2021 (USD Million)
Table 276 Pressure Vessels: Atmospheric Cryogenic Products Market Size, By Region, 2014�2021 (Thousand Units)
Table 277 Pressure Vessels: Acetylene Cryogenic Products Market Size, By Region, 2014�2021 (USD Million)
Table 278 Pressure Vessels: Acetylene Cryogenic Products Market Size, By Region, 2014�2021 (Thousand Units)
Table 279 Pressure Vessels: Hydrogen Cryogenic Products Market Size, By Region, 2014�2021 (USD Million)
Table 280 Pressure Vessels: Hydrogen Cryogenic Products Market Size, By Region, 2014�2021 (Thousand Units)
Table 281 Pressure Vessels: Helium Cryogenic Products Market Size, By Region, 2014�2021 (USD Million)
Table 282 Pressure Vessels: Helium Cryogenic Products Market Size, By Region, 2014�2021 (Thousand Units)
Table 283 Pressure Vessels: Other Gases Cryogenic Products Market Size, By Region, 2014�2021 (USD Million)
Table 284 Pressure Vessels: Other Gases Cryogenic Products Market Size, By Region, 2014�2021 (Thousand Units)
Table 285 Cold Traps: Atmospheric Cryogenic Products Market Size, By Region, 2014�2021 (USD Million)
Table 286 Cold Traps: Atmospheric Cryogenic Products Market Size, By Region, 2014�2021 (Thousand Units)
Table 287 Cold Traps: Acetylene Cryogenic Products Market Size, By Region, 2014�2021 (USD Million)
Table 288 Cold Traps: Acetylene Cryogenic Products Market Size, By Region, 2014�2021 (Thousand Units)
Table 289 Cold Traps: Hydrogen Cryogenic Products Market Size, By Region, 2014�2021 (USD Million)
Table 290 Cold Traps: Hydrogen Cryogenic Products Market Size, By Region, 2014�2021 (Thousand Units)
Table 291 Cold Traps: Helium Cryogenic Products Market Size, By Region, 2014�2021 (USD Million)
Table 292 Cold Traps: Helium Cryogenic Products Market Size, By Region, 2014�2021 (Thousand Units)
Table 293 Cold Traps: Other Gases Cryogenic Products Market Size, By Region, 2014�2021 (USD Million)
Table 294 Cold Traps: Other Gases Cryogenic Products Market Size, By Region, 2014�2021 (Thousand Units)
Table 295 Atmospheric Accessories Market Size, By Region, 2014�2021 (USD Million)
Table 296 Atmospheric Accessories Market Size, By Region, 2014�2021 (Thousand Units)
Table 297 Atmospheric Accessories Market Size, By Subcategory, 2014�2021 (USD Million)
Table 298 Atmospheric Accessories Market Size, By Subcategory, 2014�2021 (Thousand Units)
Table 299 Acetylene Accessories Market Size, By Region, 2014�2021 (USD Million)
Table 300 Acetylene Accessories Market Size, By Region, 2014�2021 (Thousand Units)
Table 301 Acetylene Accessories Market Size, By Subcategory, 2014�2021 (USD Million)
Table 302 Acetylene Accessories Market Size, By Subcategory, 2014�2021 (Thousand Units)
Table 303 Hydrogen Accessories Market Size, By Region, 2014�2021 (USD Million)
Table 304 Hydrogen Accessories Market Size, By Region, 2014�2021 (Thousand Units)
Table 305 Hydrogen Accessories Market Size, By Subcategory, 2014�2021 (USD Million)
Table 306 Hydrogen Accessories Market Size, By Subcategory, 2014�2021 (Thousand Units)
Table 307 Helium Accessories Market Size, By Region, 2014�2021 (USD Million)
Table 308 Helium Accessories Market Size, By Region, 2014�2021 (Thousand Units)
Table 309 Helium Accessories Market Size, By Subcategory, 2014�2021 (USD Million)
Table 310 Helium Accessories Market Size, By Subcategory, 2014�2021 (Thousand Units)
Table 311 Other Gases Accessories Market Size, By Region, 2014�2021 (USD Million)
Table 312 Other Gases Accessories Market Size, By Region, 2014�2021 (Thousand Units)
Table 313 Other Gases Accessories Market Size, By Subcategory, 2014�2021 (USD Million)
Table 314 Other Gases Accessories Market Size, By Subcategory, 2014�2021 (Thousand Units)
Table 315 Standalone Alarms: Atmospheric Accessories Market Size, By Region, 2014�2021 (USD Million)
Table 316 Standalone Alarms: Atmospheric Accessories Market Size, By Region, 2014�2021 (Thousand Units)
Table 317 Standalone Alarms: Acetylene Accessories Market Size, By Region, 2014�2021 (USD Million)
Table 318 Standalone Alarms: Acetylene Accessories Market Size, By Region, 2014�2021 (Thousand Units)
Table 319 Standalone Alarms: Hydrogen Accessories Market Size, By Region, 2014�2021 (USD Million)
Table 320 Standalone Alarms: Hydrogen Accessories Market Size, By Region, 2014�2021 (Thousand Units)
Table 321 Standalone Alarms: Helium Accessories Market Size, By Region, 2014�2021 (USD Million)
Table 322 Standalone Alarms: Helium Accessories Market Size, By Region, 2014�2021 (Thousand Units)
Table 323 Standalone Alarms: Other Gases Accessories Market Size, By Region, 2014�2021 (USD Million)
Table 324 Standalone Alarms: Other Gases Accessories Market Size, By Region, 2014�2021 (Thousand Units)
Table 325 Emergency Shutdown Systems: Atmospheric Accessories Market Size, By Region, 2014�2021 (USD Million)
Table 326 Emergency Shutdown Systems: Atmospheric Accessories Market Size, By Region, 2014�2021 (Thousand Units)
Table 327 Emergency Shutdown Systems: Acetylene Accessories Market Size, By Region, 2014�2021 (USD Million)
Table 328 Emergency Shutdown Systems: Acetylene Accessories Market Size, By Region, 2014�2021 (Thousand Units)
Table 329 Emergency Shutdown Systems: Hydrogen Accessories Market Size, By Region, 2014�2021 (USD Million)
Table 330 Emergency Shutdown Systems: Hydrogen Accessories Market Size, By Region, 2014�2021 (Thousand Units)
Table 331 Emergency Shutdown Systems: Helium Accessories Market Size, By Region, 2014�2021 (USD Million)
Table 332 Emergency Shutdown Systems: Helium Accessories Market Size, By Region, 2014�2021 (Thousand Units)
Table 333 Emergency Shutdown Systems: Other Gases Accessories Market Size, By Region, 2014�2021 (USD Million)
Table 334 Emergency Shutdown Systems: Other Gases Accessories Market Size, By Region, 2014�2021 (Thousand Units)
Table 335 Diaphragm & Miniature Needle Valves: Atmospheric Gas Accessories Market Size, By Region, 2014�2021 (USD Million)
Table 336 Diaphragm & Miniature Needle Valves: Atmospheric Gas Accessories Market Size, By Region, 2014�2021 (Thousand Units)
Table 337 Diaphragm & Miniature Needle Valves: Acetylene Accessories Market Size, By Region, 2014�2021 (USD Million)
Table 338 Diaphragm & Miniature Needle Valves: Acetylene Accessories Market Size, By Region, 2014�2021 (Thousand Units)
Table 339 Diaphragm & Miniature Needle Valves: Hydrogen Accessories Market Size, By Region, 2014�2021 (USD Million)
Table 340 Diaphragm & Miniature Needle Valves: Hydrogen Accessories Market Size, By Region, 2014�2021 (Thousand Units)
Table 341 Diaphragm & Miniature Needle Valves: Helium Accessories Market Size, By Region, 2014�2021 (USD Million)
Table 342 Diaphragm & Miniature Needle Valves: Helium Accessories Market Size, By Region, 2014�2021 (Thousand Units)
Table 343 Diaphragm & Miniature Needle Valves: Other Gas Accessories Market Size, By Region, 2014�2021 (USD Million)
Table 344 Diaphragm & Miniature Needle Valves: Other Gas Accessories Market Size, By Region, 2014�2021 (Thousand Units)
Table 345 Excess Flow Shut-Off Valves: Atmospheric Gas Accessories Market Size, By Region, 2014�2021 (USD Million)
Table 346 Excess Flow Shut-Off Valves: Atmospheric Gas Accessories Market Size, By Region, 2014�2021 (Thousand Units)
Table 347 Excess Flow Shut-Off Valves: Acetylene Accessories Market Size, By Region, 2014�2021 (USD Million)
Table 348 Excess Flow Shut-Off Valves: Acetylene Accessories Market Size, By Region, 2014�2021 (Thousand Units)
Table 349 Excess Flow Shut-Off Valves: Hydrogen Accessories Market Size, By Region, 2014�2021 (USD Million)
Table 350 Excess Flow Shut-Off Valves: Hydrogen Accessories Market Size, By Region, 2014�2021 (Thousand Units)
Table 351 Excess Flow Shut-Off Valves: Helium Accessories Market Size, By Region, 2014�2021 (USD Million)
Table 352 Excess Flow Shut-Off Valves: Helium Accessories Market Size, By Region, 2014�2021 (Thousand Units)
Table 353 Excess Flow Shut-Off Valves: Other Gas Accessories Market Size, By Region, 2014�2021 (USD Million)
Table 354 Excess Flow Shut-Off Valves: Other Gas Accessories Market Size, By Region, 2014�2021 (Thousand Units)
Table 355 Check Valves & Relief Valves: Atmospheric Gas Accessories Market Size, By Region, 2014�2021 (USD Million)
Table 356 Check Valves & Relief Valves: Atmospheric Gas Accessories Market Size, By Region, 2014�2021 (Thousand Units)
Table 357 Check Valves & Relief Valves: Acetylene Accessories Market Size, By Region, 2014�2021 (USD Million)
Table 358 Check Valves & Relief Valves: Acetylene Accessories Market Size, By Region, 2014�2021 (Thousand Units)
Table 359 Check Valves & Relief Valves: Hydrogen Accessories Market Size, By Region, 2014�2021 (USD Million)
Table 360 Check Valves & Relief Valves: Hydrogen Accessories Market Size, By Region, 2014�2021 (Thousand Units)
Table 361 Check Valves & Relief Valves: Helium Accessories Market Size, By Region, 2014�2021 (USD Million)
Table 362 Check Valves & Relief Valves: Helium Accessories Market Size, By Region, 2014�2021 (Thousand Units)
Table 363 Check Valves & Relief Valves: Other Gases Accessories Market Size, By Region, 2014�2021 (USD Million)
Table 364 Check Valves & Relief Valves: Other Gas Accessories Market Size, By Region, 2014�2021 (Thousand Units)
Table 365 Other Accessories: Atmospheric Gas Accessories Market Size, By Region, 2014�2021 (USD Million)
Table 366 Other Accessories: Atmospheric Gas Accessories Market Size, By Region, 2014�2021 (Thousand Units)
Table 367 Other Accessories: Acetylene Accessories Market Size, By Region, 2014�2021 (USD Million)
Table 368 Other Accessories: Acetylene Accessories Market Size, By Region, 2014�2021 (Thousand Units)
Table 369 Other Accessories: Hydrogen Accessories Market Size, By Region, 2014�2021 (USD Million)
Table 370 Other Accessories: Hydrogen Accessories Market Size, By Region, 2014�2021 (Thousand Units)
Table 371 Other Accessories: Helium Accessories Market Size, By Region, 2014�2021 (USD Million)
Table 372 Other Accessories: Helium Accessories Market Size, By Region, 2014�2021 (Thousand Units)
Table 373 Other Accessories: Other Gas Accessories Market Size, By Region, 2014�2021 (USD Million)
Table 374 Other Accessories: Other Gas Accessories Market Size, By Region, 2014�2021 (Thousand Units)
Table 375 Atmospheric Gas Detection Systems Market Size, By Region, 2014�2021 (USD Million)
Table 376 Atmospheric Gas Detection Systems Market Size, By Region, 2014�2021 (Thousand Units)
Table 377 Atmospheric Gas Detection Systems Market Size, By Subcategory, 2014�2021 (USD Million)
Table 378 Atmospheric Gas Detection Systems Market Size, By Sub-Category, 2014�2021 (Thousand Units)
Table 379 Acetylene Gas Detection Systems Market Size, By Region, 2014�2021 (USD Million)
Table 380 Acetylene Gas Detection Systems Market Size, By Region, 2014�2021 (Thousand Units)
Table 381 Acetylene Gas Detection Systems Market Size, By Subcategory, 2014�2021 (USD Million)
Table 382 Acetylene Gas Detection Systems Market Size, By Sub-Category, 2014�2021 (Thousand Units)
Table 383 Hydrogen Gas Detection Systems Market Size, By Region, 2014�2021 (USD Million)
Table 384 Hydrogen Gas Detection Systems Market Size, By Region, 2014�2021 (Thousand Units)
Table 385 Hydrogen Gas Detection Systems Market Size, By Subcategory, 2014�2021 (USD Million)
Table 386 Hydrogen Gas Detection Systems Market Size, By Sub-Category, 2014�2021 (Thousand Units)
Table 387 Helium Gas Detection Systems Market Size, By Region, 2014�2021 (USD Million)
Table 388 Helium Gas Detection Systems Market Size, By Region, 2014�2021 (Thousand Units)
Table 389 Helium Gas Detection Systems Market Size, By Sub-Category, 2014�2021 (USD Million)
Table 390 Helium Gas Detection Systems Market Size, By Sub-Category, 2014�2021 (Thousand Units)
Table 391 Other Gases: Gas Detection Systems Market Size, By Region, 2014�2021 (USD Million)
Table 392 Other Gases Gas Detection Systems Market Size, By Region, 2014�2021 (Thousand Units)
Table 393 Other Gases Gas Detection Systems Market Size, By Sub-Category, 2014�2021 (USD Million)
Table 394 Other Gases Gas Detection Systems Market Size, By Sub-Category, 2014�2021 (Thousand Units)
Table 395 Gas Detectors: Atmospheric Gas Detection Systems Market Size, By Region, 2014�2021 (USD Million)
Table 396 Gas Detectors: Atmospheric Gas Detection Systems Market Size, By Region, 2014�2021 (Thousand Units)
Table 397 Gas Detectors: Acetylene Gas Detection Systems Market Size, By Region, 2014�2021 (USD Million)
Table 398 Gas Detectors: Acetylene Gas Detection Systems Market Size, By Region, 2014�2021 (Thousand Units)
Table 399 Gas Detectors: Hydrogen Gas Detection Systems Market Size, By Region, 2014�2021 (USD Million)
Table 400 Gas Detectors: Hydrogen Gas Detection Systems Market Size, By Region, 2014�2021 (Thousand Units)
Table 401 Gas Detectors: Helium Gas Detection Systems Market Size, By Region, 2014�2021 (USD Million)
Table 402 Gas Detectors: Helium Gas Detection Systems Market Size, By Region, 2014�2021 (Thousand Units)
Table 403 Gas Detectors: Other Gases Detection Systems Market Size, By Region, 2014�2021 (USD Million)
Table 404 Gas Detectors: Other Gases Detection Systems Market Size, By Region, 2014�2021 (Thousand Units)
Table 405 Gas Analyzers: Atmospheric Gas Detection Systems Market Size, By Region, 2014�2021 (USD Million)
Table 406 Gas Analyzers: Atmospheric Gas Detection Systems Market Size, By Region, 2014�2021 (Thousand Units)
Table 407 Gas Analyzers: Acetylene Gas Detection Systems Market Size, By Region, 2014�2021 (USD Million)
Table 408 Gas Analyzers: Acetylene Gas Detection Systems Market Size, By Region, 2014�2021 (Thousand Units)
Table 409 Gas Analyzers: Hydrogen Gas Detection Systems Market Size, By Region, 2014�2021 (USD Million)
Table 410 Gas Analyzers: Hydrogen Gas Detection Systems Market Size, By Region, 2014�2021 (Thousand Units)
Table 411 Gas Analyzers: Helium Gas Detection Systems Market Size, By Region, 2014�2021 (USD Million)
Table 412 Gas Analyzers: Helium Gas Detection Systems Market Size, By Region, 2014�2021 (Thousand Units)
Table 413 Gas Analyzers: Other Gases Detection Systems Market Size, By Region, 2014�2021 (USD Million)
Table 414 Gas Analyzers: Other Gases Gas Detection Systems Market Size, By Region, 2014�2021 (Thousand Units)
Table 415 Gas Equipment Market Size, By Gas, 2014�2021 (USD Million)
Table 416 Gas Equipment Market Size, By Gas, 2014�2021 (Thousand Units)
Table 417 Atmospheric Gas Handling Equipment Market Size, By Equipment Category, 2014�2021 (USD Million)
Table 418 Atmospheric Gas Handling Equipment Market Size, By Equipment Category, 2014�2021 (Thousand Units)
Table 419 Hydrogen Gas Handling Equipment Market Size, By Equipment Category, 2014�2021 (USD Million)
Table 420 Hydrogen Gas Handling Equipment Market Size, By Equipment Category, 2014�2021 (Thousand Units)
Table 421 Acetylene Gas Handling Equipment Market Size, By Equipment Category, 2014�2021 (USD Million)
Table 422 Acetylene Gas Handling Equipment Market Size, By Equipment Category, 2014�2021 (Thousand Units)
Table 423 Helium Gas Handling Equipment Market Size, By Equipment Category, 2014�2021 (USD Million)
Table 424 Helium Gas Handling Equipment Market Size, By Equipment Category, 2014�2021 (Thousand Units)
Table 425 Other Gases Gas Handling Equipment Market Size, By Equipment Category, 2014�2021 (USD Million)
Table 426 Other Gases Gas Handling Equipment Market Size, By Equipment Category, 2014�2021 (Thousand Units)
Table 427 Gas Equipment Market Size, By Process, 2014�2021 (USD Million)
Table 428 Industrial Gas Generation Market Size, By Region, 2014�2021 (USD Million)
Table 429 Industrial Gas Storage Market Size, By Region, 2014�2021 (USD Million)
Table 430 Gas Detection Market Size, By Region, 2014�2021 (USD Million)
Table 431 Transportation Market Size, By Region, 2014�2021 (USD Million)
Table 432 Gas Equipment Market Size, By End-Use Sector, 2014�2021 (USD Million)
Table 433 Chemical Market Size, By Region, 2014�2021 (USD Million)
Table 434 Metal Fabrication Market Size, By Region, 2014�2021 (USD Million)
Table 435 Healthcare & Medical Market Size, By Region, 2014�2021 (USD Million)
Table 436 Oil & Gas Market Size, By Region, 2014�2021 (USD Million)
Table 437 Others Market Size, By Region, 2014�2021 (USD Million)
Table 438 Gas Equipment Market Size, By Region, 2014�2021 (USD Million)
Table 439 Gas Equipment Market Size, By Region, 2014�2021 (Thousand Units)
Table 440 North America: By Market Size, By Country, 2014�2021 (USD Million)
Table 441 North America: By Market Size, By Country, 2014�2021 (Thousand Units)
Table 442 North America: By Market Size, By Equipment Category, 2014�2021 (USD Million)
Table 443 North America: By Market Size, By Equipment Category, 2014�2021 (Thousand Units)
Table 444 North America: By Market Size, By Gas Delivery System, 2014�2021 (USD Million)
Table 445 North America: By Market Size, By Gas Delivery Systems, 2014�2021 (Thousand Units)
Table 446 North America: By Market Size, By Flow Device, 2014�2021 (USD Million)
Table 447 North America: By Market Size, By Flow Device, 2014�2021 (Thousand Units)
Table 448 North America: By Market Size, By Gas Generating System, 2014�2021 (USD Million)
Table 449 North America: By Market Size, By Gas Generating System, 2014�2021 (Thousand Units)
Table 450 North America: By Market Size, By Gas Detection System, 2014�2021 (USD Million)
Table 451 North America: By Market Size, By Gas Detection System, 2014�2021 (Thousand Units)
Table 452 North America: By Market Size, By Cryogenic Product, 2014�2021 (USD Million)
Table 453 North America: By Market Size, By Cryogenic Product, 2014�2021 (Thousand Units)
Table 454 North America: By Market Size, By Accessory, 2014�2021 (USD Million)
Table 455 North America: By Market Size, By Accessory, 2014�2021 (Thousand Units)
Table 456 North America: By Market Size, By Gas, 2014�2021 (USD Million)
Table 457 North America: By Market Size, By Gas, 2014�2021 (Thousand Units)
Table 458 U.S.: By Market Size, By Equipment Category, 2014�2021 (USD Million)
Table 459 U.S.: By Market Size, By Equipment Category, 2014�2021 (Thousand Units)
Table 460 U.S.: By Market Size, By Gas Delivery System, 2014�2021 (USD Million)
Table 461 U.S.: By Market Size, By Gas Delivery System, 2014�2021 (Thousand Units)
Table 462 U.S.: By Market Size, By Flow Device, 2014�2021 (USD Million)
Table 463 U.S.: By Market Size, By Flow Device, 2014�2021 (Thousand Units)
Table 464 U.S.: By Market Size, By Gas Generating System, 2014�2021 (USD Million)
Table 465 U.S.: By Market Size, By Gas Generating System, 2014�2021 (Thousand Units)
Table 466 U.S.: By Market Size, By Gas Detection System, 2014�2021 (USD Million)
Table 467 U.S.: By Market Size, By Gas Detection System, 2014�2021 (Thousand Units)
Table 468 U.S.: By Market Size, By Cryogenic Product, 2014�2021 (USD Million)
Table 469 U.S.: By Market Size, By Cryogenic Product, 2014�2021 (Thousand Units)
Table 470 U.S.: By Market Size, By Accessory, 2014�2021 (USD Million)
Table 471 U.S.: By Market Size, By Accessory, 2014�2021 (Thousand Units)
Table 472 Canada: Gas Equipment Market Size, By Equipment Category, 2014�2021 (USD Million)
Table 473 Canada: Gas Equipment Market Size, By Equipment Category, 2014�2021 (Thousand Units)
Table 474 Canada: Gas Equipment Market Size, By Gas Delivery System, 2014�2021 (USD Million)
Table 475 Canada: Gas Equipment Market Size, By Gas Delivery System, 2014�2021 (Thousand Units)
Table 476 Canada: Gas Equipment Market Size, By Flow Device, 2014�2021 (USD Million)
Table 477 Canada: Gas Equipment Market Size, By Flow Device, 2014�2021 (Thousand Units)
Table 478 Canada: Gas Equipment Market Size, By Gas Generating System, 2014�2021 (USD Million)
Table 479 Canada: Gas Equipment Market Size, By Gas Generating System, 2014�2021 (Thousand Units)
Table 480 Canada: Gas Equipment Market Size, By Gas Detection System, 2014�2021 (USD Million)
Table 481 Canada: Gas Equipment Market Size, By Gas Detection System, 2014�2021 (Thousand Units)
Table 482 Canada: Gas Equipment Market Size, By Cryogenic Product, 2014�2021 (USD Million)
Table 483 Canada: Gas Equipment Market Size, By Cryogenic Product, 2014�2021 (Thousand Units)
Table 484 Canada: Gas Equipment Market Size, By Accessory, 2014�2021 (USD Million)
Table 485 Canada: Gas Equipment Market Size, By Accessory, 2014�2021 (Thousand Units)
Table 486 Mexico: Gas Equipment Market Size, By Equipment Category, 2014�2021 (USD Million)
Table 487 Mexico: Gas Equipment Market Size, By Equipment Category, 2014�2021 (Thousand Units)
Table 488 Mexico: Gas Equipment Market Size, By Gas Delivery System, 2014�2021 (USD Million)
Table 489 Mexico: Gas Equipment Market Size, By Gas Delivery System, 2014�2021 (Thousand Units)
Table 490 Mexico: Gas Equipment Market Size, By Flow Device, 2014�2021 (USD Million)
Table 491 Mexico: Gas Equipment Market Size, By Flow Device, 2014�2021 (Thousand Units)
Table 492 Mexico: Gas Equipment Market Size, By Gas Generating System, 2014�2021 (USD Million)
Table 493 Mexico: Gas Equipment Market Size, By Gas Generating System, 2014�2021 (Thousand Units)
Table 494 Mexico: Gas Equipment Market Size, By Gas Detection System, 2014�2021 (USD Million)
Table 495 Mexico: Gas Equipment Market Size, By Gas Detection System, 2014�2021 (Thousand Units)
Table 496 Mexico: Gas Equipment Market Size, By Cryogenic Product, 2014�2021 (USD Million)
Table 497 Mexico: Gas Equipment Market Size, By Cryogenic Product, 2014�2021 (Thousand Units)
Table 498 Mexico: Gas Equipment Market Size, By Accessory, 2014�2021 (USD Million)
Table 499 Mexico: Gas Equipment Market Size, By Accessory, 2014�2021 (Thousand Units)
Table 500 Europe: Gas Equipment Market Size, By Country, 2014�2021 (USD Million)
Table 501 Europe: Gas Equipment Market Size, By Country, 2014�2021 (Thousand Units)
Table 502 Europe: Gas Equipment Market Size, By Equipment Category, 2014�2021 (USD Million)
Table 503 Europe: Gas Equipment Market Size, By Equipment Category, 2014�2021 (Thousand Units)
Table 504 Europe: Gas Equipment Market Size, By Gas Delivery System, 2014�2021 (USD Million)
Table 505 Europe: Gas Equipment Market Size, By Gas Delivery System, 2014�2021 (Thousand Units)
Table 506 Europe: Gas Equipment Market Size, By Flow Device, 2014�2021 (USD Million)
Table 507 Europe: Gas Equipment Market Size, By Flow Device, 2014�2021 (Thousand Units)
Table 508 Europe: Gas Equipment Market Size, By Gas Generating System, 2014�2021 (USD Million)
Table 509 Europe: Gas Equipment Market Size, By Gas Generating System, 2014�2021 (Thousand Units)
Table 510 Europe: Gas Equipment Market Size, By Gas Detection System, 2014�2021 (USD Million)
Table 511 Europe: Gas Equipment Market Size, By Gas Detection System, 2014�2021 (Thousand Units)
Table 512 Europe: Gas Equipment Market Size, By Cryogenic Product, 2014�2021 (USD Million)
Table 513 Europe: Gas Equipment Market Size, By Cryogenic Product, 2014�2021 (Thousand Units)
Table 514 Europe: Gas Equipment Market Size, By Accessory, 2014�2021 (USD Million)
Table 515 Europe: Gas Equipment Market Size, By Accessory, 2014�2021 (Thousand Units)
Table 516 Europe: Gas Equipment Market Size, By Gas, 2014�2021 (USD Million)
Table 517 Europe: Gas Equipment Market Size, By Gas, 2014�2021 (Thousand Units)
Table 518 Germany: By Market Size, By Equipment Category, 2014�2021 (USD Million)
Table 519 Germany: By Market Size, By Equipment Category, 2014�2021 (Thousand Units)
Table 520 Germany: By Market Size, By Gas Delivery System, 2014�2021 (USD Million)
Table 521 Germany: By Market Size, By Gas Delivery System, 2014�2021 (Thousand Units)
Table 522 Germany: By Market Size, By Flow Device, 2014�2021 (USD Million)
Table 523 Germany: By Market Size, By Flow Device, 2014�2021 (Thousand Units)
Table 524 Germany: By Market Size, By Gas Generating System, 2014�2021 (USD Million)
Table 525 Germany: By Market Size, By Gas Generating System, 2014�2021 (Thousand Units)
Table 526 Germany: By Market Size, By Gas Detection System, 2014�2021 (USD Million)
Table 527 Germany: By Market Size, By Gas Detection System, 2014�2021 (Thousand Units)
Table 528 Germany: By Market Size, By Cryogenic Product, 2014�2021 (USD Million)
Table 529 Germany: By Market Size, By Cryogenic Product, 2014�2021 (Thousand Units)
Table 530 Germany: By Market Size, By Accessory, 2014�2021 (USD Million)
Table 531 Germany: By Market Size, By Accessory, 2014�2021 (Thousand Units)
Table 532 France: Gas Equipment Market Size, By Equipment Category, 2014�2021 (USD Million)
Table 533 France: Gas Equipment Market Size, By Equipment Category, 2014�2021 (Thousand Units)
Table 534 France: Gas Equipment Market Size, By Gas Delivery System, 2014�2021 (USD Million)
Table 535 France: Gas Equipment Market Size, By Gas Delivery System, 2014�2021 (Thousand Units)
Table 536 France: Gas Equipment Market Size, By Flow Device, 2014�2021 (USD Million)
Table 537 France: Gas Equipment Market Size, By Flow Device, 2014�2021 (Thousand Units)
Table 538 France: Gas Equipment Market Size, By Gas Generating System, 2014�2021 (USD Million)
Table 539 France: Gas Equipment Market Size, By Gas Generating System, 2014�2021 (Thousand Units)
Table 540 France: Gas Equipment Market Size, By Gas Detection System, 2014�2021 (USD Million)
Table 541 France: Gas Equipment Market Size, By Gas Detection System, 2014�2021 (Thousand Units)
Table 542 France: Gas Equipment Market Size, By Cryogenic Product, 2014�2021 (USD Million)
Table 543 France: Gas Equipment Market Size, By Cryogenic Product, 2014�2021 (Thousand Units)
Table 544 France: Gas Equipment Market Size, By Accessory, 2014�2021 (USD Million)
Table 545 France: Gas Equipment Market Size, By Accessory, 2014�2021 (Thousand Units)
Table 546 U.K.: By Market Size, By Equipment Category, 2014�2021 (USD Million)
Table 547 U.K.: By Market Size, By Equipment Category, 2014�2021 (Thousand Units)
Table 548 U.K.: By Market Size, By Gas Delivery System, 2014�2021 (USD Million)
Table 549 U.K.: By Market Size, By Gas Delivery System, 2014�2021 (Thousand Units)
Table 550 U.K.: By Market Size, By Flow Device, 2014�2021 (USD Million)
Table 551 U.K.: By Market Size, By Flow Device, 2014�2021 (Thousand Units)
Table 552 U.K.: By Market Size, By Gas Generating System, 2014�2021 (USD Million)
Table 553 U.K.: By Market Size, By Gas Generating System, 2014�2021 (Thousand Units)
Table 554 U.K.: By Market Size, By Gas Detection System, 2014�2021 (USD Million)
Table 555 U.K.: By Market Size, By Gas Detection System, 2014�2021 (Thousand Units)
Table 556 U.K.: By Market Size, By Cryogenic Product, 2014�2021 (USD Million)
Table 557 U.K.: By Market Size, By Cryogenic Product, 2014�2021 (Thousand Units)
Table 558 U.K.: By Market Size, By Accessory, 2014�2021 (USD Million)
Table 559 U.K.: By Market Size, By Accessory, 2014�2021 (Thousand Units)
Table 560 Italy: By Market Size, By Equipment Category, 2014�2021 (USD Million)
Table 561 Italy: By Market Size, By Equipment Category, 2014�2021 (Thousand Units)
Table 562 Italy: By Market Size, By Gas Delivery System, 2014�2021 (USD Million)
Table 563 Italy: By Market Size, By Gas Delivery System, 2014�2021 (Thousand Units)
Table 564 Italy: By Market Size, By Flow Device, 2014�2021 (USD Million)
Table 565 Italy: By Market Size, By Flow Device, 2014�2021 (Thousand Units)
Table 566 Italy: By Market Size, By Gas Generating System, 2014�2021 (USD Million)
Table 567 Italy: By Market Size, By Gas Generating System, 2014�2021 (Thousand Units)
Table 568 Italy: By Market Size, By Gas Detection System, 2014�2021 (USD Million)
Table 569 Italy: By Market Size, By Gas Detection System, 2014�2021 (Thousand Units)
Table 570 Italy: By Market Size, By Cryogenic Product, 2014�2021 (USD Million)
Table 571 Italy: By Market Size, By Cryogenic Product, 2014�2021 (Thousand Units)
Table 572 Italy: By Market Size, By Accessory, 2014�2021 (USD Million)
Table 573 Italy: By Market Size, By Accessory, 2014�2021 (Thousand Units)
Table 574 Spain: Gas Equipment Market Size, By Equipment Category, 2014�2021 (USD Million)
Table 575 Spain: Gas Equipment Market Size, By Gas Delivery System, 2014�2021 (USD Million)
Table 576 Spain: Gas Equipment Market Size, By Gas Delivery System, 2014�2021 (Thousand Units)
Table 577 Spain: Gas Equipment Market Size, By Flow Device, 2014�2021 (USD Million)
Table 578 Spain: Gas Equipment Market Size, By Flow Device, 2014�2021 (Thousand Units)
Table 579 Spain: Gas Equipment Market Size, By Gas Generating System, 2014�2021 (USD Million)
Table 580 Spain: Gas Equipment Market Size, By Gas Generating System, 2014�2021 (Thousand Units)
Table 581 Spain: Gas Equipment Market Size, By Gas Detection System, 2014�2021 (USD Million)
Table 582 Spain: Gas Equipment Market Size, By Gas Detection System, 2014�2021 (Thousand Units)
Table 583 Spain: Gas Equipment Market Size, By Cryogenic Product, 2014�2021 (USD Million)
Table 584 Spain: Gas Equipment Market Size, By Cryogenic Product, 2014�2021 (Thousand Units)
Table 585 Spain: Gas Equipment Market Size, By Accessory, 2014�2021 (USD Million)
Table 586 Spain: Gas Equipment Market Size, By Accessory, 2014�2021 (Thousand Units)
Table 587 Rest of Europe: By Market Size, By Equipment Category, 2014�2021 (USD Million)
Table 588 Rest of Europe: By Market Size, By Equipment Category, 2014�2021 (Thousand Units)
Table 589 Rest of Europe: By Market Size, By Gas Delivery System, 2014�2021 (USD Million)
Table 590 Rest of Europe: By Market Size, By Gas Delivery System, 2014�2021 (Thousand Units)
Table 591 Rest of Europe: By Market Size, By Flow Device, 2014�2021 (USD Million)
Table 592 Rest of Europe: By Market Size, By Flow Device, 2014�2021 (Thousand Units)
Table 593 Rest of Europe: By Market Size, By Gas Generating System, 2014�2021 (USD Million)
Table 594 Rest of Europe: By Market Size, By Gas Generating System, 2014�2021 (Thousand Units)
Table 595 Rest of Europe: By Market Size, By Gas Detection System, 2014�2021 (USD Million)
Table 596 Rest of Europe: By Market Size, By Gas Detection System, 2014�2021 (Thousand Units)
Table 597 Rest of Europe: By Market Size, By Cryogenic Product, 2014�2021 (USD Million)
Table 598 Rest of Europe: By Market Size, By Cryogenic Product, 2014�2021 (Thousand Units)
Table 599 Rest of Europe: By Market Size, By Accessory, 2014�2021 (USD Million)
Table 600 Rest of Europe: By Market Size, By Accessory, 2014�2021 (Thousand Units)
Table 601 Asia-Pacific: By Market Size, By Country, 2014�2021 (USD Million)
Table 602 Asia-Pacific: By Market Size, By Country, 2014�2021 (Thousand Units)
Table 603 Asia-Pacific: By Market Size, By Equipment Category, 2014�2021 (USD Million)
Table 604 Asia-Pacific: By Market Size, By Equipment Category, 2014�2021 (Thousand Units)
Table 605 Asia-Pacific: By Market Size, By Gas Delivery System, 2014�2021 (USD Million)
Table 606 Asia-Pacific: By Market Size, By Gas Delivery System, 2014�2021 (Thousand Units)
Table 607 Asia-Pacific: By Market Size, By Flow Device, 2014�2021 (USD Million)
Table 608 Asia-Pacific: By Market Size, By Flow Device, 2014�2021 (Thousand Units)
Table 609 Asia-Pacific: By Market Size, By Gas Generating System, 2014�2021 (USD Million)
Table 610 Asia-Pacific: By Market Size, By Gas Generating System, 2014�2021 (Thousand Units)
Table 611 Asia-Pacific: By Market Size, By Gas Detection Systems, 2014�2021 (USD Million)
Table 612 Asia-Pacific: By Market Size, By Gas Detection System, 2014�2021 (Thousand Units)
Table 613 Asia-Pacific: By Market Size, By Cryogenic Product, 2014�2021 (USD Million)
Table 614 Asia-Pacific: By Market Size, By Cryogenic Product, 2014�2021 (Thousand Units)
Table 615 Asia-Pacific: By Market Size, By Accessory, 2014�2021 (USD Million)
Table 616 Asia-Pacific: By Market Size, By Accessory, 2014�2021 (Thousand Units)
Table 617 Asia-Pacific: By Market Size, By Gas, 2014�2021 (USD Million)
Table 618 Asia-Pacific: By Market Size, By Gas, 2014�2021 (Thousand Units)
Table 619 Japan: By Market Size, By Equipment Category, 2014�2021 (USD Million)
Table 620 Japan: By Market Size, By Equipment Category, 2014�2021 (Thousand Units)
Table 621 Japan: By Market Size, By Gas Delivery System, 2014�2021 (USD Million)
Table 622 Japan: By Market Size, By Gas Delivery System, 2014�2021 (Thousand Units)
Table 623 Japan: By Market Size, By Flow Device, 2014�2021 (USD Million)
Table 624 Japan: By Market Size, By Flow Device, 2014�2021 (Thousand Units)
Table 625 Japan: By Market Size, By Gas Generating System, 2014�2021 (USD Million)
Table 626 Japan: By Market Size, By Gas Generating System, 2014�2021 (Thousand Units)
Table 627 Japan: By Market Size, By Gas Detection System, 2014�2021 (USD Million)
Table 628 Japan: By Market Size, By Gas Detection System, 2014�2021 (Thousand Units)
Table 629 Japan: By Market Size, By Cryogenic Product, 2014�2021 (USD Million)
Table 630 Japan: By Market Size, By Cryogenic Product, 2014�2021 (Thousand Units)
Table 631 Japan: By Market Size, By Accessory, 2014�2021 (USD Million)
Table 632 Japan: By Market Size, By Accessory, 2014�2021 (Thousand Units)
Table 633 China: By Market Size, By Equipment Category, 2014�2021 (USD Million)
Table 634 China: By Market Size, By Equipment Category, 2014�2021 (Thousand Units)
Table 635 China: By Market Size, By Gas Delivery System, 2014�2021 (USD Million)
Table 636 China: By Market Size, By Gas Delivery System, 2014�2021 (Thousand Units)
Table 637 China: By Market Size, By Flow Device, 2014�2021 (USD Million)
Table 638 China: By Market Size, By Flow Device, 2014�2021 (Thousand Units)
Table 639 China: By Market Size, By Gas Generating System, 2014�2021 (USD Million)
Table 640 China: By Market Size, By Gas Generating System, 2014�2021 (Thousand Units)
Table 641 China: By Market Size, By Gas Detection Systems, 2014�2021 (USD Million)
Table 642 China: By Market Size, By Gas Detection System, 2014�2021 (Thousand Units)
Table 643 China: By Market Size, By Cryogenic Product, 2014�2021 (USD Million)
Table 644 China: By Market Size, By Cryogenic Product, 2014�2021 (Thousand Units)
Table 645 China: By Market Size, By Accessory, 2014�2021 (USD Million)
Table 646 China: By Market Size, By Accessory, 2014�2021 (Thousand Units)
Table 647 India: By Market Size, By Equipment Category, 2014�2021 (USD Million)
Table 648 India: By Market Size, By Equipment Category, 2014�2021 (Thousand Units)
Table 649 India: By Market Size, By Gas Delivery System, 2014�2021 (USD Million)
Table 650 India: By Market Size, By Gas Delivery System, 2014�2021 (Thousand Units)
Table 651 India: By Market Size, By Flow Device, 2014�2021 (USD Million)
Table 652 India: By Market Size, By Flow Device, 2014�2021 (Thousand Units)
Table 653 India: By Market Size, By Gas Generating System, 2014�2021 (USD Million)
Table 654 India: By Market Size, By Gas Generating System, 2014�2021 (Thousand Units)
Table 655 India: By Market Size, By Gas Detection System, 2014�2021 (USD Million)
Table 656 India: By Market Size, By Gas Detection System, 2014�2021 (Thousand Units)
Table 657 India: By Market Size, By Cryogenic Product, 2014�2021 (USD Million)
Table 658 India: By Market Size, By Cryogenic Product, 2014�2021 (Thousand Units)
Table 659 India: By Market Size, By Accessory, 2014�2021 (USD Million)
Table 660 India: By Market Size, By Accessory, 2014�2021 (Thousand Units)
Table 661 Rest of Asia-Pacific: By Market Size, By Equipment Category, 2014�2021 (USD Million)
Table 662 Rest of Asia-Pacific: By Market Size, By Equipment Category, 2014�2021 (Thousand Units)
Table 663 Rest of Asia-Pacific: By Market Size, By Gas Delivery System, 2014�2021 (USD Million)
Table 664 Rest of Asia-Pacific: By Market Size, By Gas Delivery System, 2014�2021 (Thousand Units)
Table 665 Rest of Asia-Pacific: By Market Size, By Flow Device, 2014�2021 (USD Million)
Table 666 Rest of Asia-Pacific: By Market Size, By Flow Devices, 2014�2021 (Thousand Units)
Table 667 Rest of Asia-Pacific: By Market Size, By Gas Generating System, 2014�2021 (USD Million)
Table 668 Rest of Asia-Pacific: By Market Size, By Gas Generating System, 2014�2021 (Thousand Units)
Table 669 Rest of Asia-Pacific: By Market Size, By Gas Detection System, 2014�2021 (USD Million)
Table 670 Rest of Asia-Pacific: By Market Size, By Gas Detection System, 2014�2021 (Thousand Units)
Table 671 Rest of Asia-Pacific: By Market Size, By Cryogenic Product, 2014�2021 (USD Million)
Table 672 Rest of Asia-Pacific: By Market Size, By Cryogenic Product, 2014�2021 (Thousand Units)
Table 673 Rest of Asia-Pacific: By Market Size, By Accessory, 2014�2021 (USD Million)
Table 674 Rest of Asia-Pacific: By Market Size, By Accessory, 2014�2021 (Thousand Units)
Table 675 RoW: By Market Size, By Country, 2014�2021 (USD Million)
Table 676 RoW: By Market Size, By Country, 2014�2021 (Thousand Units)
Table 677 RoW: By Market Size, By Equipment Category, 2014�2021 (USD Million)
Table 678 RoW: By Market Size, By Equipment Category, 2014�2021 (Thousand Units)
Table 679 RoW: By Market Size, By Gas Delivery System, 2014�2021 (USD Million)
Table 680 RoW: By Market Size, By Gas Delivery System, 2014�2021 (Thousand Units)
Table 681 RoW: By Market Size, By Flow Device, 2014�2021 (USD Million)
Table 682 RoW: By Market Size, By Flow Device, 2014�2021 (Thousand Units)
Table 683 RoW: By Market Size, By Gas Generating System, 2014�2021 (USD Million)
Table 684 RoW: By Market Size, By Gas Generating System, 2014�2021 (Thousand Units)
Table 685 RoW: By Market Size, By Gas Detection System, 2014�2021 (USD Million)
Table 686 RoW: By Market Size, By Gas Detection System, 2014�2021 (Thousand Units)
Table 687 RoW: By Market Size, By Cryogenic Product, 2014�2021 (USD Million)
Table 688 RoW: By Market Size, By Cryogenic Product, 2014�2021 (Thousand Units)
Table 689 RoW: By Market Size, By Accessory, 2014�2021 (USD Million)
Table 690 RoW: By Market Size, By Accessory, 2014�2021 (Thousand Units)
Table 691 Brazil: By Market Size, By Equipment Category, 2014�2021 (USD Million)
Table 692 Brazil: By Market Size, By Equipment Category, 2014�2021 (Thousand Units)
Table 693 Brazil: By Market Size, By Gas Delivery System, 2014�2021 (USD Million)
Table 694 Brazil: By Market Size, By Gas Delivery System, 2014�2021 (Thousand Units)
Table 695 Brazil: By Market Size, By Flow Device, 2014�2021 (USD Million)
Table 696 Brazil: By Market Size, By Flow Device, 2014�2021 (Thousand Units)
Table 697 Brazil: By Market Size, By Gas Generating System, 2014�2021 (USD Million)
Table 698 Brazil: By Market Size, By Gas Generating System, 2014�2021 (Thousand Units)
Table 699 Brazil: By Market Size, By Gas Detection System, 2014�2021 (USD Million)
Table 700 Brazil: By Market Size, By Gas Detection System, 2014�2021 (Thousand Units)
Table 701 Brazil: By Market Size, By Cryogenic Product, 2014�2021 (USD Million)
Table 702 Brazil: By Market Size, By Cryogenic Product, 2014�2021 (Thousand Units)
Table 703 Brazil: By Market Size, By Accessory, 2014�2021 (USD Million)
Table 704 Brazil: By Market Size, By Accessory, 2014�2021 (Thousand Units)
Table 705 Others in RoW: By Market Size, By Equipment Category, 2014�2021 (USD Million)
Table 706 Others in RoW: By Market Size, By Equipment Category, 2014�2021 (Thousand Units)
Table 707 Others in RoW: By Market Size, By Gas Delivery System, 2014�2021 (USD Million)
Table 708 Others in RoW: By Market Size, By Gas Delivery System, 2014�2021 (Thousand Units)
Table 709 Others in RoW: By Market Size, By Flow Device, 2014�2021 (USD Million)
Table 710 Others in RoW: By Market Size, By Flow Device, 2014�2021 (Thousand Units)
Table 711 Others in RoW: By Market Size, By Gas Generating System, 2014�2021 (USD Million)
Table 712 Others in RoW: By Market Size, By Gas Generating System, 2014�2021 (Thousand Units)
Table 713 Others in RoW: By Market Size, By Gas Detection System, 2014�2021 (USD Million)
Table 714 Others in RoW: By Market Size, By Gas Detection System, 2014�2021 (Thousand Units)
Table 715 Others in RoW: By Market Size, By Cryogenic Product, 2014�2021 (USD Million)
Table 716 Others in RoW: By Market Size, By Cryogenic Product, 2014�2021 (Thousand Units)
Table 717 Others in RoW: By Market Size, By Accessory, 2014�2021 (USD Million)
Table 718 Others in RoW: By Market Size, By Accessory, 2014�2021 (Thousand Units)
Table 719 New Product Development, 2013�2015
Table 720 Mergers & Acquisitions, 2012�2015
Table 721 Contracts and Agreements, 2011�2015
Table 722 Expansions, 2011�2015
List of Figures (44 Figures)
Figure 1 Gas Equipment Market
Figure 2 Gas Equipment Market: Research Design
Figure 3 Market Size Estimation Methodology: Bottom-Up Approach
Figure 4 Market Size Estimation Methodology: Top-Down Approach
Figure 5 Data Triangulation Methodology
Figure 6 Limitations
Figure 7 Gas Equipment Market Snapshot, 2016 vs 2021
Figure 8 The Largest Demand for Gas Equipment Systems is Projected From the Chemical Sector By 2021
Figure 9 Asia-Pacific is Projected to Be the Fastest-Growing Segment in the Gas Equipment Systems Market During the Forecast Period
Figure 10 The U.S. is Projected to Be the Fastest-Growing Country-Level Market for Gas Equipment, Between 2016 & 2021
Figure 11 Leading Market Players Adopted New Product Launch as the Key Strategy Between 2011 & 2015
Figure 12 Emerging Economies Offer Attractive Opportunities in the Gas Equipment Market
Figure 13 Metal Fabrication Sector Accounted for the Largest Market Share in 2015
Figure 14 The Cryogenic Products Segment is Projected to Be the Fastest-Growing During the Forecast Period
Figure 15 The Largest Share Was Captured By Japan in the Emerging Asia-Pacific Market in 2015
Figure 16 Asia-Pacific is Projected to Be the Fastest-Growing Market for Gas Equipment, Between 2016 & 2021
Figure 17 Gas Equipment Market Segmentation
Figure 18 Growing Demand for Industrial Gases in Various End-Use Sectors and Safety & Environmental Regulations Result in Increased Demand for Gas Equipment
Figure 19 Cryogenic Products Segment is Projected to Grow at the Highest Rate From 2016 to 2021
Figure 20 Gas Equipment Market, By Gas, 2016 vs 2021 (USD Million)
Figure 21 Chemical Sector is Projected to Grow at the Highest Rate During the Forecast Period in Terms of Value
Figure 22 Geographic Snapshot (2016�2021): the Market in the U.S. is Projected to Grow at the Highest Rate
Figure 23 North American Gas Equipment Market Snapshot: the U.S. is Projected to Be the Fastest-Growing Market During the Forecast Period (2016�2021)
Figure 24 U.S. Gas Equipment Market, By Equipment Category, 2016 vs 2021
Figure 25 European Gas Equipment Market Snapshot: Germany is Projected to Be the Fastest-Growing Market During the Forecast Period (2016�2021)
Figure 26 Asia-Pacific Gas Equipment Market Snapshot: Japan is Projected to Be the Fastest-Growing Country During the Forecast Period (2016�2021)
Figure 27 Companies Adopted Mergers & Acquisitions as the Key Growth Strategies During the Studied Period (2011�2015)
Figure 28 The Linde Group Grew at the Highest Rate From 2010 to 2014
Figure 29 2012 Was Observed to Be the Most Active Year in Terms of Number of Developments in the Gas Equipment Market
Figure 30 Annual Developments in the Gas Equipment Market, 2011�2015
Figure 31 Geographic Revenue Mix of Top Five Players
Figure 32 Linde AG: Company Snapshot
Figure 33 SWOT Analysis: Linde AG
Figure 34 Air Liquide S.A.: Company Snapshot
Figure 35 SWOT Analysis: Air Liquide S.A.
Figure 36 Praxair, Inc.:Company Snapshot
Figure 37 SWOT Analysis: Praxair, Inc.
Figure 38 Air Products and Chemicals, Inc.: Company Snapshot
Figure 39 SWOT Analysis: Air Products and Chemicals, Inc.
Figure 40 Iwatani Corporation: Company Snapshot
Figure 41 SWOT Analysis: Air Products and Chemicals Inc.
Figure 42 Colfax Corporation: Company Snapshot
Figure 43 Itron, Inc.: Company Snapshot
Figure 44 Messer Group GmbH: Company Snapshot


Growth opportunities and latent adjacency in Gas Equipment Market