Shale Gas Processing Equipment Market by Component (Compressors & Pumps, Electrical Machinery, Heat Exchangers, Internal Combustion Engines, and Measuring & Controlling Devices) & by Geography (North America & ROW) - Global Trends and forecasts to 2019


[235 Pages Report] This report estimates the shale gas processing equipment market, in terms of value. The value of this market is estimated in terms of $million and this has been broken down into geographical regions, and further split into processing components.
Shale gas processing equipment are required for processing shale gas before it can be transported by large diameter inter-state or intra-state pipelines for end-use. The increasing shale gas exploration and production activities across the globe are the key drivers for the growth of this market. However, concerns associated with the shale gas exploration such as the ground water contamination by fracking operations will slightly affect growth in this market. However, with growing energy demand and proven domestic shale gas reserves, many countries are now trying to explore shale gas.These developments will result in the market witnessing a higher growth rate in the demand for shale gas processing equipment.
We have used various secondary sources such as encyclopedia, directories, and databases to identify and collect information useful for this extensive commercial study. The primary sources�experts from industry and suppliers- have been interviewed for critical information as well as to assess the future prospects of the market.
The North American market held the largest share in the global shale gas processing equipment demand in 2013. In North America, the U.S. is the largest market that is expected to continue its influence in the industry. Within RoW,Chinais the leading player, given the exploration and production activities in its abundant shale reserves.
The shale gas processing equipment market is segmented into two regions, namely North America, and RoW. The market is further segmented on the basis of major countries in each region.
The report also touches on various other important aspects of the market. It includes an analysis of the value-chain, Porter�s Five Forces Analysis, the competitive landscape, and premium insights of the market.
We have also profiled the leading players of this industry with their recent developments and other strategic industry activities. These include Cameron (U.S.),Exterran (U.S.),GasTech Engineering Corporation (U.S.), Honeywell UOP (U.S.),Johnson Controls (U.S.), Linde Engineering (Germany), Membrane Technology & Research (U.S.), Newpoint Gas, LP (U.S.), Pall Corporation (U.S.), and Van Gas System (U.S.).
Shale gas processing equipment market has been witnessing high growth, due to increase in shale gas exploration and development activities. The report categorizes the market, by geography and by component, including Compressors & Pumps, Internal combustion engines, Heat exchangers, Electrical Machinery, Measuring and controlling devices; .
The shale gas processing equipment market is estimated to reach about $5,769.9 Million by 2019, signifying a firm growth rate of over 16.3% from 2014-2019.
Global Shale Gas Processing Market Share (Value), 2013
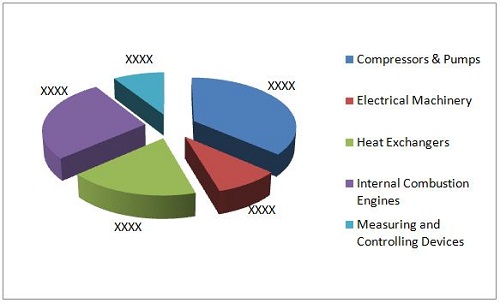
Source: MarketsandMarkets Analysis
Geographically, the market has been studied for different regions such as North America (U.S. and Canada), and RoW(China and Australia). The U.S. region has been further analyzed in terms of shale and components. The market in terms of value has been evaluated in detail, with respect to major components. The study covers different strategies such as contract agreements, mergers & acquisition, and new product launch, among others. Linde Engineering (Germany),Jhonson Controls (U.S.) and Cameron (U.S.), Exterran (U.S.), Honeywell UOP (U.S.), Pall Corporation (U.S.) are some of the market leaders in terms of growth strategies and shale gas processing equipment supply.
 Exclusive indicates content/data unique to MarketsandMarkets and not available with any competitors.
Table of Contents
1 Introduction (Page No. - 21)
1.1 Objectives
1.2 Analyst Insights
1.3 Report Description
1.4 Market Definition
1.5 Stakeholders
1.6 Research Methodology
1.6.1 Approach
1.6.2 Shale Gas Processing Equipment : By Market Size Estimation
1.6.3 Market Crackdown & Data Triangulation
1.6.4 Key Data Taken From Secondary Sources
1.6.5 Key Secondary Sources Used
1.6.6 Key Data Taken From Primary Sources
1.6.7 Assumptions Made for Shale Gas Processing Equipment Market Report
2 Executive Summary (Page No. - 33)
3 Premium Insights (Page No. - 37)
3.1 U.S. Shale Gas Processing Equipment Market Scenario
3.2 Compressors & Pumps Leads the Market
3.3 Emergence of China in the Market
3.4 Marcellus Is Expected to Hold the Largest Market Share
3.5 Key Strategy in Market
4 Market Overview (Page No. - 46)
4.1 Market Segmentation
4.1.1 By Component
4.1.2 By Geography
4.2 Value Chain Analysis
4.2.1 Equipment Manufacturers
4.2.2 Shale Gas Processing Operators
4.3 Shale Gas Processing Equipment Market Dynamics
4.3.1 Drivers
4.3.1.1 Rising Natural Gas Price
4.3.1.2 Advances in Drilling Technology Make Shale Gas Production Viable
4.3.1.3 Upcoming Natural Gas Pipeline Projects
4.3.1.4 Energy Strategy Shift Through Gas-A �Transitional Fuel�
4.3.1.5 Energy Security offered By the Domestic Supply of Natural Gas
4.3.2 Restraints
4.3.2.1 Water Availability & Contamination Concerns for Shale Fracturing
4.3.2.2 Public Opposition to Shale Fracturing
4.3.2.3 Adverse Effects of Strict Government Regulations on the Shale Gas Processing Equipment Industry
4.3.3 Opportunity
4.3.3.1 Expanding Shale Gas Infrastructure
4.3.4 Burning Issues
4.3.4.1 Health and Environmental Impacts of Fracking Chemicals
4.3.5 Winning Imperatives
4.4 Impact of Market Dynamics
4.4.1 Porter�s Five forces Model
4.1.2 Threat of Substitutes
4.1.3 Threat of New Entrants
4.1.4 Bargaining Power of Buyers
4.1.5 Bargaining Power of Suppliers
4.1.6 Industry Competition
5 An Overview of Shale Gas Processing (Page No. - 67)
5.1 Introduction
5.2 Technology Overview
5.2.1 Steps in Shale Gas Processing
5.2.2 Stages in Shale Gas Processing
5.2.2.1 Oil & Condensate Removal
5.2.2.2 Dehydration
5.2.2.3 Mercury Removal
5.2.2.4 Sweetening
5.2.2.5 Nitrogen Rejection
5.2.2.6 Ngls Extraction
5.2.2.7 Ngls Fractionation
6 Shale Gas Industry Analysis (Page No. - 73)
6.1 Related Market
6.1.1 Global Pressure Pumping Market
6.2 Global Shale Gas Reserves Scenario
6.2.1 Shale Gas Reserves, By Geography
6.2.1.1 North America
6.2.1.1.1 U.S.
6.2.1.1.2 Canada
6.2.1.1.3 Mexico
6.2.1.2 South America
6.2.1.2.1 Argentina
6.2.1.2.2 Brazil
6.2.1.2.3 Chile
6.2.1.2.4 Colombia & Venezuela
6.2.1.2.5 Paraguay & Bolivia
6.2.1.2.6 Uruguay
6.2.1.3 Europe
6.2.1.3.1 Denmark
6.2.1.3.2 France
6.2.1.3.3 Germany
6.2.1.3.4 Lithuania & Kaliningrad
6.2.1.3.5 the Netherlands
6.2.1.3.6 Poland
6.2.1.3.7 Romania, Bulgaria & Ukraine
6.2.1.3.8 Russia
6.2.1.3.9 Spain
6.2.1.3.10 Sweden
6.2.1.3.11 U.K.
6.2.1.4 Africa
6.2.1.4.1 Algeria
6.2.1.4.2 Egypt
6.2.1.4.3 Libya
6.2.1.4.4 Morocco
6.2.1.4.5 South Africa
6.2.1.4.6 Tunisia
6.2.1.5 Asia-Pacific
6.2.1.5.1 Australia
6.2.1.5.2 China
6.2.1.5.3 India
6.2.1.5.4 Indonesia
6.2.1.5.5 Jordan
6.2.1.5.6 Mongolia
6.2.1.5.7 Pakistan
6.2.1.5.8 Thailand
6.2.1.5.9 Turkey
7 Global Shale Gas Processing Equipment Market, By Component (Page No. - 120)
7.1 Industry Overview
7.2 Shale Gas Processing Equipment Market Analysis, By Component
7.2.1 Global Shale Gas Processing Equipment Market, By Component
7.2.1.1 Compressors & Pumps Market
7.2.1.1.1 Market Size & forecast
7.2.1.2 Electrical Machinery Market
7.2.1.2.1 Market Size & forecast
7.2.1.3 Heat Exchangers Market
7.2.1.3.1 Market Size & forecast
7.2.1.4 Internal Combustion Engines Market
7.2.1.4.1 Market Size & forecast
7.2.1.5 Measuring & Controlling Devices Market
7.2.1.5.1 Market Size & forecast
8 Market By Geography (Page No. - 129)
8.1 Industry Overview
8.2 Market Analysis, By Geography
8.2.1 Market forecast, By Geography
8.2.1.1 North America
8.2.1.1.1 Industry Trend
8.2.1.1.2 Market Size & forecasts
8.2.1.2 ROW
8.2.1.2.1 Industry Trend
8.2.1.2.2 Market Size & forecasts
9 U.S. Shale Gas Processing Equipment Market, By Shale (Page No. - 136)
9.1 Industry Overview
9.2 Market Analysis, By Shale
9.2.1 U.S. Market, By Shale
9.2.1.1 Antrim Shale
9.2.1.1.1 Production Scenario
9.2.1.1.2 Processing Components Market
9.2.1.2 Bakken Shale
9.2.1.2.1 Production Scenario
9.2.1.2.2 Processing Components Market
9.2.1.3 Barnett Shale
9.2.1.3.1 Production Scenario
9.2.1.3.2 Processing Components Market
9.2.1.4 Eagle ford Shale
9.2.1.4.1 Production Scenario
9.2.1.4.2 Processing Components Market
9.2.1.5 Fayetteville Shale
9.2.1.5.1 Production Scenario
9.2.1.5.2 Processing Components Market
9.2.1.6 Haynesville Shale
9.2.1.6.1 Production Scenario
9.2.1.6.2 Processing Components Market
9.2.1.7 Marcellus Shale
9.2.1.7.1 Production Scenario
9.2.1.7.2 Processing Components Market
9.2.1.8 Woodford Shale
9.2.1.8.1 Production Scenario
9.2.1.8.2 Processing Components Market
9.2.1.9 Rest of U.S. Shale
9.2.1.9.1 Production Scenario
9.2.1.9.2 Processing Components Market
10 U.S. Shale Gas Processing Equipment Market By Component (Page No. - 164)
10.1 Introduction
10.1.1 U.S. Shale Gas Processing Equipment Market, By Component
10.1.1.1 U.S. Shale Gas Processing Compressors & Pump Market, By Shale
10.1.1.2 U.S. Shale Gas Processing Electrical Machinery Market, By Shale
10.1.1.3 U.S. Shale Gas Processing Heat Exchangers Market, By Shale
10.1.1.4 U.S. Shale Gas Processing Internal Combustion Engines Market, By Shale
10.1.1.5 U.S. Shale Gas Processing Measuring & Controlling Devices Market, By Shale
11 Competitive Landscape (Page No. - 173)
11.1 Key Findings
11.2 Introduction
11.3 Growth Strategies in the Market
11.4 Key Players of the Shale Gas Processing Equipment Market
11.4.1 List of Key Players
11.4.2 Market Share Scenario
11.5 Competitive Situations & Trends
11.5.1 Contract Agreements
11.5.2 Mergers & Acquisitions
11.5.3 New Product Launches
11.5.4 Other Developments
11.6 Cameron
11.6.1 Introduction
11.6.2 Products & Services
11.6.3 Developments
11.6.4 Strategy & Insights
11.6.5 Cameron: SWOT Analysis
11.6.6 MNM View
11.7 Exterran
11.7.1 Introduction
11.7.2 Products & Services
11.7.3 Developments
11.7.4 Strategy & Insights
11.8 Gastech Engineering Corporation
11.8.1 Introduction
11.8.2 Products & Services
11.8.3 Strategy & Insights
11.9 Honeywell UOP (Universal Oil Products)
11.9.1 Introduction
11.9.2 Products & Services
11.9.3 Developments
11.9.4 Strategy & Insights
11.9.5 UOP: SWOT Anaysis
11.9.6 MNM View
11.10 Johnson Controls
11.10.1 Introduction
11.10.2 Products & Services
11.10.3 Products & Services
11.10.4 Developments
11.10.5 Strategy & Insights
11.10.6 Johnson Controls: SWOT Analysis
11.10.7 MNM View
11.11 Linde Engineering
11.11.1 Introduction
11.11.2 Products & Services
11.11.3 Developments
11.11.4 Strategy& Insights
11.11.5 Linde: SWOT Analysis
11.11.6 MNM View
11.12 Membrane Technology & Research
11.12.1 Introduction
11.12.2 Products & Services
11.12.3 Strategy & Insights
11.13 Newpoint Gas, LP
11.13.1 Introduction
11.13.2 Products & Services
11.13.3 Strategy & Insights
11.14 Pall Corporation
11.14.1 Introduction
11.14.2 Products & Services
11.14.3 Developments
11.14.4 Strategy & Insights
11.14.5 Pall Corporation: SWOT Analysis
11.14.6 MNM View
11.15 Van Gas System
11.15.1 Introduction
11.15.2 Products & Services
11.15.3 Developments
11.15.4 Strategy & Insights
List of Tables (84 Figures)
Table 1 Shale Gas Processing Equipment Market Size,By Component, 2012 � 2019 ($Million)
Table 2 Key Natural Gas Pipeline Projects, 2009 � 2013
Table 3 2020 Emission Reduction Targets of Selected Countries
Table 4 Fossil Fuel Emission Levels-Pounds Per Billion Btu of Energy Input
Table 5 Water Use In U.S. Shale Plays, By Company, 2009
Table 6 Impact of Market Dynamics, 2013�2018
Table 7 North America: Shale Gas Reserves, By Country, 2013
Table 8 U.S.: Technical Recoverable Reserves, 2013
Table 9 Canada: Technical Recoverable Reserves, 2013
Table 10 Mexico: Technical Recoverable Reserves, 2013
Table 11 South America: Shale Gas Reserves, By Country, 2013
Table 12 Argentina: Technical Recoverable Reserves, 2013
Table 13 Brazil: Technical Recoverable Reserves, 2013
Table 14 Chile: Technical Recoverable Reserves, 2013
Table 15 Colombia & Venezuela: Technical Recoverable Reserves, 2013
Table 16 Paraguay & Bolivia: Technical Recoverable Reserves, 2013
Table 17 Uruguay: Technical Recoverable Reserves, 2013
Table 18 Europe: Shale Gas Reserves, By Country, 2013
Table 19 Denmark: Technical Recoverable Reserves, 2013
Table 20 France: Technical Recoverable Reserves, 2013
Table 21 Germany: Technical Recoverable Reserves, 2013
Table 22 Lithuania & Kaliningrad: Technical Recoverable Reserves, 2013
Table 23 Netherlands: Technical Recoverable Reserves, 2013
Table 24 Poland: Technical Recoverable Reserves, 2013
Table 25 Number of Test Wells Completed in Poland, 2013
Table 26 Romania, Bulgaria & Ukraine: Technical Recoverable Reserves, 2013
Table 27 Russia: Technical Recoverable Reserves, 2013
Table 28 Spain: Technical Recoverable Reserves, 2013
Table 29 Sweden: Technical Recoverable Reserves, 2013
Table 30 U.K.: Technical Recoverable Reserves, 2013
Table 31 Africa: Shale Gas Reserves, By Country, 2013
Table 32 Algeria: Technical Recoverable Reserves, 2013
Table 33 Egypt: Technical Recoverable Reserves, 2013
Table 34 Libya: Technical Recoverable Reserves, 2013
Table 35 Morocco: Technical Recoverable Reserves, 2013
Table 36 South Africa: Technical Recoverable Reserves, 2013
Table 37 Tunisia: Technical Recoverable Reserves, 2013
Table 38 Asia-Pacific: Shale Gas Reserves, By Country, 2013
Table 39 Australia: Technical Recoverable Reserves, 2013
Table 40 India: Technical Recoverable Reserves, 2013
Table 41 Indonesia: Technical Recoverable Reserves, 2013
Table 42 Jordan: Technical Recoverable Reserves, 2013
Table 43 Mongolia: Technical Recoverable Reserves, 2013
Table 44 Pakistan: Technical Recoverable Reserves, 2013
Table 45 Thailand: Technical Recoverable Reserves, 2013
Table 46 Turkey: Technical Recoverable Reserves, 2013
Table 47 Market Size By Component, 2012 � 2019 ($Million)
Table 48 Compressors & Pumps Market Size,By Geography, 2012 � 2019 ($Million)
Table 49 Electrical Machinery Market Size, By Region, 2012 � 2019 ($Million)
Table 50 Heat Exchangers Market Size, By Geography, 2012 � 2019 ($Million)
Table 51 Internal Combustion Engines Market Size, By Geography, 2012 � 2019 ($Million)
Table 52 Measuring & Controlling Devices Market Size, By Geography, 2012 � 2019 ($Million)
Table 53 Market Size, By Geography, 2012�2019 ($Million)
Table 54 North America: Market Size, By Country, 2012�2019 ($Million)
Table 55 ROW: Market Size, By Country, 2012�2019 ($Million)
Table 56 U.S. Market Size, By Shale, 2012 � 2019 ($Million)
Table 57 Antrim Market Size, By Component, 2012 � 2012 ($Million)
Table 58 Bakken Market Size, By Component, 2012 � 2012 ($Million)
Table 59 Barnett Shale Gas Processing Equipment Market Size, By Component, 2012 � 2012 ($Million)
Table 60 Eagle ford Market Size, By Component, 2012 � 2012 ($Million)
Table 61 Fayetteville Market Size, By Component, 2012 � 2012 ($Million)
Table 62 Haynesville Shale Gas Processing Equipment Market Size, By Component, 2012 � 2012 ($Million)
Table 63 Marcellus Market Size, By Component, 2012 � 2012 ($Million)
Table 64 Woodford Market Size, By Component, 2012 � 2012 ($Million)
Table 65 Rest of U.S. Shale Gas Processing Equipment Market Size, By Component, 2012 � 2012 ($Million)
Table 66 U.S. Shale Gas Processing Market Size By Component 2012 � 2019 ($Million)
Table 67 U.S. Shale Gas Processing Compressors & Pump Market Size, By Shale, 2012 � 2019 ($Million)
Table 68 U.S. Shale Gas Processing Electrical Machinery Market Size, By Shale, 2012 � 2019 ($Million)
Table 69 U.S. Shale Gas Processing Heat Exchangers Market Size, By Shale, 2012 � 2019 ($Million)
Table 70 U.S. Shale Gas Processing Internal Combustion Engines Market Size, By Shale, 2012 � 2019 ($Million)
Table 71 U.S. Shale Gas Processing Measuring & Controlling Devices Market Size, By Shale, 2012 � 2019 ($Million)
Table 72 Contract Agreements, 2012-2014
Table 73 Mergers & Acquisitions, 2011-2014
Table 74 New Product Launches 2013-2014
Table 75 Other Developments, 2012-2014
Table 76 Cameron: Products/Services & Description
Table 77 Exterran: Products & Description
Table 78 Gastech: Products & Services
Table 79 Honeywell UOP: Products/Services & Description
Table 80 Johnson Control: Products/Services & Description
Table 81 Linde Engineering: Products/Services & Description
Table 82 Newpoint Gas LP: Products/Services & Description
Table 83 Pall Corporation: Products/Services & Description
Table 84 Van Gas System: Products/Services & Description
List of Figures (34 Figures)
Figure 1 Research Methodology
Figure 2 Data Triangulation Methodology
Figure 3 Market Share (Value), By Component, 2013
Figure 4 U.S. Market Share (Value) Comparison,2013 � 2019
Figure 5 Global Market Size, By Component, 2014 � 2019 ($Million)
Figure 6 Global Market Share (Value), 2013 � 2019
Figure 7 U.S. Market Size, By Shale, 2014 -2019 ($Million)
Figure 8 Key Market Strategy: 2011 � 2014
Figure 9 Shale Gas Processing Equipment By Market Share (Value), By Components, 2013
Figure 10 Shale Gas Processing Equipment By Market Share (Value), By Geography, 2014
Figure 11 Value Chain Analysis of the Shale Gas Processing Equipment Market
Figure 12 Natural Gas Price Trends, (2009 � 2014)
Figure 13 Shale Gas Production Trends, 2007 � 2012
Figure 14 Porter�s Five forces Analysis
Figure 15 Stages in Shale Gas Processing
Figure 16 Pressure Pumping Market Size, 2013 � 2018 ($Million)
Figure 17 China: Technical Recoverable Reserves, 2013
Figure 18 Global Shale Gas Processing Equipment Market Share (Value), 2014
Figure 19 Shale Gas Processing Equipment By Market Share, By Geography, 2014
Figure 20 Antrim Shale Production Trends, 2009 - 2013
Figure 21 Bakken Shale Production Trends, 2009 � 2013
Figure 22 Barnett Shale Production Trends, 2009 � 2013
Figure 23 Eagle ford Production Trends, 2009 � 2013
Figure 24 Fayetteville Production Trends, 2009 � 2013
Figure 25 Haynesville Production Trends, 2009 � 2013
Figure 26 Marcellus Production Trends, 2009 � 2013
Figure 27 Woodford Shale Production Trends, 2009 � 2013
Figure 28 Rest of U.S. Shale Production Trends, 2009 � 2013
Figure 29 Shale Gas Processing Equipment Market : Number of Developments, 2011-2014
Figure 30 Market Developments, By Growth Strategy, 2011-2014
Figure 31 Contract Agreements Analysis , 2012-2014
Figure 32 Mergers & Acqusitions Analysis, 2011-2014
Figure 33 New Product Launches Analysis of Shale Gas Processing Equipment Market, 2013-2014
Figure 34 Other Developments Analysis, 2012-2014


Growth opportunities and latent adjacency in Shale Gas Processing Equipment Market