Encapsulants Market by Chemistry (Epoxy, Silicone, Urethane), Curing Type (Room Temperature, Heat Temperature, UV), End-Use Industry (Consumer Electronics, Transportation, Medical, Energy & Power), and Region - Global Forecast to 2022


[162 Pages Report] Encapsulants Market size was valued at USD 1.20 Billion in 2016 and is projected to reach USD 1.64 Billion by 2022, at a CAGR of 5.5% from 2017 to 2022. The base year considered for this study on the encapsulants market is 2016, while the forecast period is between 2017 and 2022.
Objectives of the report are as follows:
- To define and segment the encapsulants market on the basis of chemistry, curing type, end-use industry, and region.
- To provide detailed information regarding the major factors, such drivers, restraints, opportunities, and challenges influencing the growth of the encapsulants market
- To analyze and forecast the size of the encapsulants market, in terms of value and volume
- To analyze the segmentation and project the size of the encapsulants market, in terms of value, for five key regions, namely, North America, Europe, Asia Pacific, South America, and the Middle East & Africa
- To strategically profile the key players operating in the encapsulants market
- To analyze competitive developments, such as new product launches, expansions, mergers & acquisitions, and partnerships & agreements taking place in the encapsulants market
Both, top-down and bottom-up approaches have been used to estimate and validate the size of the encapsulants market, and to determine the sizes of various other dependent submarkets. The research study involved the extensive use of secondary sources, directories, and databases, such as Hoovers, Bloomberg, Chemical Weekly, Factiva, and other government and private websites to identify and collect information useful for the technical, market-oriented, and commercial study of the encapsulants market.
To know about the assumptions considered for the study, download the pdf brochure
Dow Corning Corporation (US), Henkel AG & CO., KGaA (Germany), Lord Corporation (US), Shin-Etsu Chemicals (Japan), and H.B. Fuller (US) are some of the key players operating in the encapsulants market.
Key Target Audience:
- Suppliers of Raw Materials
- Manufacturers of Encapsulants
- Traders, Distributors, and Suppliers of Encapsulants
- Government & Regional Agencies
- Research Organizations
- Investment Research Firms of Composites
Scope of the Report:
This research report categorizes the encapsulants market on the basis of chemistry, curing type, end-use industry, and region.
Encapsulants Market, by Chemistry:
- Epoxy
- Silicone
- Urethane
Encapsulants Market, by Curing Type:
- Room Temperature Cure
- Heat Temperature Cure
- UV Cure
Encapsulants Market, by End-Use Industry:
- Consumer Electronics
- Transportation
- Medical
- Power & Energy
- Others
Encapsulants Market, by Region:
- North America
- Europe
- Asia Pacific
- South America
- Middle East & Africa
The market has been further analyzed for the key countries in each of these regions.
Available Customizations:
With the given market data, MarketsandMarkets offers customizations according to the specific needs of the companies. The following customization options are available for the report:
Regional Analysis:
Further breakdown of the regional encapsulants market into the key countries
Company Information:
Detailed analysis and profiles of additional market players
Product Analysis
Product matrix, which gives a detailed comparison of the product portfolio of each company
The encapsulants market is estimated to be USD 1.26 Billion in 2017 and is projected to reach USD 1.64 Billion by 2022, at a CAGR of 5.5% from 2017 to 2022 The increasing complexity & functionality of electronics devices and the trend of miniaturization in devices are among the major reasons for the growing importance of encapsulants in the semiconductor & electronics industry. Electronics devices are usually made of small components and structures, which have to be arranged properly and accurately. Any flaw in the connection can result in the faulty functioning of the devices. Encapsulants play a vital role in maintaining the accuracy of the arrangement by creating a layer on the structure of the device and ensuring that all components are in place.
Based on chemistry, the silicone segment of the encapsulants market is projected to grow at the highest CAGR during the forecast period. The growth of this segment can be attributed to the increasing demand for electric vehicles and consumer electronic devices.
Based on curing type, the room temperature curing segment of the encapsulants market is projected to grow at the highest CAGR during the forecast period. Room temperature curing systems offer easy processing and high reliability.
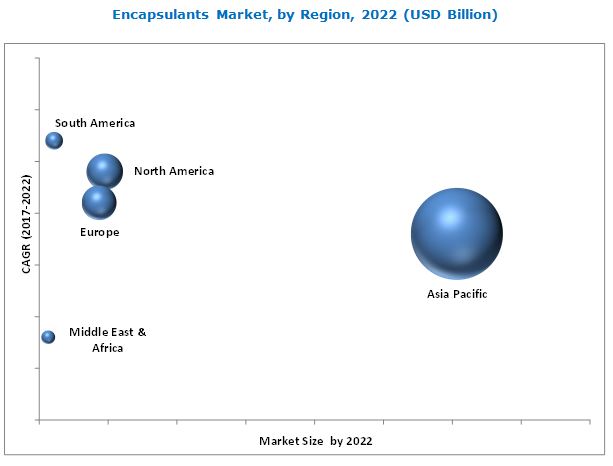
Asia Pacific accounted for the largest share of the encapsulants market in 2016, followed by the North American region. Increased demand for encapsulants from the Asia Pacific region can be attributed to the rapidly growing end-use industries, such as consumer electronics and transportation. The availability of skilled labor at lower wages in this region also attracts manufacturers.
Volatility in raw material prices could restrain the global encapsulants market. Raw materials required for the manufacturing of encapsulants are derived from petroleum-based resins. Therefore, fluctuation in crude oil prices could act as a major restraint for the encapsulants market.
Companies operating in the encapsulants market have adopted strategies such as new product launches, expansions, and mergers & acquisitions to enhance their market shares and expand their distribution networks across the globe. These companies engage in R&D activities to innovate and develop products that can open avenues for new end-use industries. For instance, in February 2017, Dow Corning added five new optical encapsulants to its fast-growing portfolio of advanced LED Solutions. These new products will help the company increase its competitiveness in addressing different industry problems. In June 2016, Henkel also developed a thermally conductive techno melt solution. This development helped enhance the company�s product portfolio.
To speak to our analyst for a discussion on the above findings, click Speak to Analyst
 Exclusive indicates content/data unique to MarketsandMarkets and not available with any competitors.
Table of Contents
1 Introduction (Page No. - 16)
1.1 Objectives of the Study
1.2 Market Definition
1.3 Market Scope
1.3.1 Years Considered for the Study
1.4 Currency
1.5 Units Considered
1.6 Limitations
1.7 Stakeholders
2 Research Methodology (Page No. - 20)
2.1 Research Data
2.1.1 Secondary Data
2.1.1.1 Key Data From Secondary Sources
2.1.2 Primary Data
2.1.2.1 Key Data From Primary Sources
2.1.2.2 Key Industry Insights
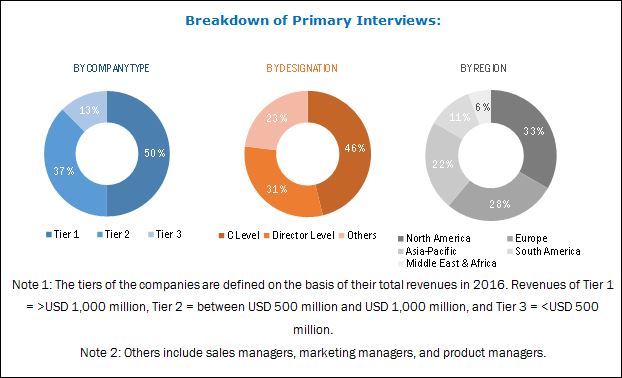
2.1.2.3 Breakdown of Primary Interviews
2.2 Market Size Estimation
2.2.1 Bottom-Up Approach
2.2.2 Top-Down Approach
2.3 Data Triangulation
2.4 Assumptions
3 Executive Summary (Page No. - 28)
4 Premium Insights (Page No. - 31)
4.1 Attractive Opportunities in Encapsulants Market
4.2 Asia-Pacific Encapsulants Market, By Country and End-Use Industry
4.3 Encapsulants Market, By End-Use Industry
4.4 Encapsulants Market, By Chemistry
4.5 Encapsulants Market, By Curing Type
5 Market Overview (Page No. - 34)
5.1 Introduction
5.1.1 Drivers
5.1.1.1 Growing Demand for Advanced Electronic Packaging Techniques
5.1.1.2 Increasing Demand for Miniaturization of Electronic Devices
5.1.2 Restraints
5.1.2.1 Volatility in Encapsulants Raw Material Prices
5.1.3 Opportunities
5.1.3.1 High Growth Opportunities in Emerging Economies of Asia-Pacific
5.1.4 Challenges
5.1.4.1 Stringent Government Regulations on Reduction of VOC Emission
5.2 Porter�s Five Forces Analysis
5.2.1 Threat of New Entrants
5.2.2 Threat of Substitutes
5.2.3 Bargaining Power of Suppliers
5.2.4 Bargaining Power of Buyers
5.2.5 Intensity of Competitive Rivalry
5.3 Macroeconomic Overview
5.3.1 GDP Growth Rate Forecast of Major Economies
5.3.2 Automotive Industry Trends
5.3.3 Semiconductor Industry Trends
6 Encapsulants Market, By Chemistry (Page No. - 44)
6.1 Introduction
6.2 Epoxy Encapsulant
6.3 Silicone Encapsulant
6.4 Urethane Encapsulant
7 Encapsulants Market, By Curing Type (Page No. - 50)
7.1 Introduction
7.2 Room Temperature Cure
7.3 Heat Cure
7.4 UV Cure
8 Encapsulants Market, By End-Use Industry (Page No. - 56)
8.1 Introduction
8.2 Consumer Electronics
8.3 Transportation
8.4 Medical
8.5 Energy & Power
8.6 Others
9 Encapsulants Market, By Region (Page No. - 66)
9.1 Introduction
9.2 North America
9.2.1 U.S.
9.2.2 Canada
9.2.3 Mexico
9.3 Europe
9.3.1 Germany
9.3.2 France
9.3.3 U.K.
9.3.4 Italy
9.3.5 Rest of Europe
9.4 Asia-Pacific
9.4.1 China
9.4.2 Japan
9.4.3 South Korea
9.4.4 Taiwan
9.4.5 India
9.4.6 Rest of Asia-Pacific
9.5 Middle East & Africa
9.5.1 UAE
9.5.2 Saudi Arabia
9.5.3 South Africa
9.5.4 Rest of Middle East & Africa
9.6 South America
9.6.1 Brazil
9.6.2 Argentina
9.6.3 Rest of South America
10 Competitive Landscape (Page No. - 119)
10.1 Market Ranking of Key Players
11 Company Profiles (Page No. - 121)
*Details on Business Overview, Products Offered, Strength of Product Portfolio, Business Strategy Excellence, Recent Developments
11.1 Lord Corporation
11.2 DOW Corning Corporation
11.3 H.B. Fuller
11.4 Shin-Etsu Chemical Co., Ltd.
11.5 Sumitomo Bakelite Co., Ltd.
11.6 Henkel AG & Co. KGaA
11.7 Kyocera Corporation
11.8 Hitachi Chemical Co., Ltd.
11.9 Panasonic Corporation
11.10 Epic Resins
(Business Overview, Products Offered, Strength of Product Portfolio, Business Strategy Excellence, Recent Developments)
11.11 Other Market Players
11.11.1 Electrolube
11.11.2 Engineered Material Systems, Inc.
11.11.3 The 3M Company
11.11.4 BASF SE
11.11.5 Resin Technical Systems
11.11.6 Sanyu Rec Co., Ltd.
11.11.7 John C. Dolph
11.11.8 Master Bond Inc.
11.11.9 ACC Silicones
11.11.10 Dymax Corporation
11.11.11 Gs Polymers
11.11.12 Nagase & Co., Ltd.
11.11.13 Epoxies, Etc.
11.11.14 Creative Materials Incorporated
11.11.15 Aptek Laboratories, Inc.
12 Appendix (Page No. - 155)
12.1 Insights From Industry Experts
12.2 Discussion Guide
12.3 Knowledge Store: Marketsandmarkets� Subscription Portal
12.4 Introducing RT: Real-Time Market Intelligence
12.5 Available Customizations
12.6 Related Reports
12.7 Author Details
List of Tables (157 Tables)
Table 1 Forecast of GDP Growth Rates, By Country, 2016�2022
Table 2 Vehicle Sales, By Country, 2013�2016 (Thousand Units)
Table 3 Encapsulants Market Size, By Chemistry, 2015�2022 (USD Million)
Table 4 Encapsulants Market Size, By Chemistry, 2015�2022 (Kiloton)
Table 5 Epoxy Encapsulant Market Size, By Region, 2015�2022 (USD Million)
Table 6 Epoxy Encapsulant Market Size, By Region, 2015�2022 (Ton)
Table 7 Silicone Encapsulant Market Size, By Region, 2015�2022 (USD Million)
Table 8 Silicone Encapsulant Market Size, By Region, 2015�2022 (Ton)
Table 9 Urethane Encapsulant Market Size, By Region, 2015�2022 (USD Million)
Table 10 Urethane Encapsulant Market Size, By Region, 2015�2022 (Ton)
Table 11 Encapsulants Market Size, By Curing Type, 2015�2022 (USD Million)
Table 12 Encapsulants Market Size, By Curing Type, 2015�2022 (Kiloton)
Table 13 Room Temperature Curing Type Market Size, By Region, 2015�2022 (USD Million)
Table 14 Room Temperature Curing Type Market Size, By Region, 2015�2022 (Ton)
Table 15 Heat Curing Type Market Size, By Region, 2015�2022 (USD Million)
Table 16 Heat Curing Type Market Size, By Region, 2015�2022 (Ton)
Table 17 UV Curing Type Market Size, By Region, 2015�2022 (USD Million)
Table 18 UV Curing Type Market Size, By Region, 2015�2022 (Ton)
Table 19 Encapsulants Market Size, By End-Use Industry, 2015�2022 (USD Million)
Table 20 By Market Size, By End-Use Industry, 2015�2022 (Kiloton)
Table 21 Encapsulants Market Size in Consumer Electronics, By Region, 2015�2022 (USD Million)
Table 22 By Market Size in Consumer Electronics, By Region, 2015�2022 (Ton)
Table 23 Encapsulants Market Size in Transportation, By Region, 2015�2022 (USD Million)
Table 24 By Market Size in Transportation, By Region, 2015�2022 (Ton)
Table 25 Encapsulants Market Size in Medical, By Region, 2015�2022 (USD Million)
Table 26 By Market Size in Medical, By Region, 2015�2022 (Ton)
Table 27 Encapsulants Market Size in Energy & Power, By Region, 2015�2022 (USD Million)
Table 28 By Market Size in Energy & Power, By Region, 2015�2022 (Ton)
Table 29 Encapsulants Market Size in Other End-Use Industries, By Region, 2015�2022 (USD Million)
Table 30 By Market Size in Other End-Use Industries, By Region, 2015�2022 (Ton)
Table 31 Encapsulants Market Size, By Region, 2015�2022 (USD Million)
Table 32 By Market Size, By Region, 2015�2022 (Kiloton)
Table 33 North America: Encapsulants Market Size, By Country, 2015�2022 (USD Million)
Table 34 North America: By Market Size, By Country, 2015�2022 (Ton)
Table 35 North America: Encapsulants Market Size, By Chemistry, 2015�2022 (USD Million)
Table 36 North America: By Market Size, By Chemistry, 2015�2022 (Ton)
Table 37 North America: Encapsulants Market Size, By Curing Type, 2015�2022 (USD Million)
Table 38 North America: By Market Size, By Curing Type, 2015�2022 (Ton)
Table 39 North America: Encapsulants Market Size, By End-Use Industry, 2015�2022 (USD Million)
Table 40 North America: By Market Size, By End-Use Industry, 2015�2022 (Ton)
Table 41 U.S.: Encapsulants Market Size, By Chemistry, 2015�2022 (USD Million)
Table 42 U.S.: By Market Size, By Chemistry, 2015�2022 (Ton)
Table 43 U.S.: Encapsulants Market Size, By End-Use Industry, 2015�2022 (USD Million)
Table 44 U.S.: By Market Size, By End-Use Industry, 2015�2022 (Ton)
Table 45 Canada: Encapsulants Market Size, By Chemistry, 2015�2022 (USD Million)
Table 46 Canada: By Market Size, By Chemistry, 2015�2022 (Ton)
Table 47 Canada: Encapsulants Market Size, By End-Use Industry, 2015�2022 (USD Million)
Table 48 Canada: By Market Size, By End-Use Industry, 2015�2022 (Ton)
Table 49 Mexico: Encapsulants Market Size, By Chemistry, 2015�2022 (USD Million)
Table 50 Mexico: By Market Size, By Chemistry, 2015�2022 (Ton)
Table 51 Mexico: Encapsulants Market Size, By End-Use Industry, 2015�2022 (USD Million)
Table 52 Mexico: By Market Size, By End-Use Industry, 2015�2022 (Ton)
Table 53 Europe: Encapsulants Market Size, By Country, 2015�2022 (USD Million)
Table 54 Europe: By Market Size, By Country, 2015�2022 (Ton)
Table 55 Europe: Encapsulants Market Size, By Chemistry, 2015�2022 (USD Million)
Table 56 Europe: By Market Size, By Chemistry, 2015�2022 (Ton)
Table 57 Europe: Encapsulants Market Size, By Curing Type, 2015�2022 (USD Million)
Table 58 Europe: By Market Size, By Curing Type, 2015�2022 (Ton)
Table 59 Europe: Encapsulants Market Size, By End-Use Industry, 2015�2022 (USD Million)
Table 60 Europe: By Market Size, By End-Use Industry, 2015�2022 (Ton)
Table 61 Germany: Encapsulants Market Size, By Chemistry, 2015�2022 (USD Million)
Table 62 Germany: By Market Size, By Chemistry, 2015�2022 (Ton)
Table 63 Germany: Encapsulants Market Size, By End-Use Industry, 2015�2022 (USD Million)
Table 64 Germany: By Market Size, By End-Use Industry, 2015�2022 (Ton)
Table 65 France: Encapsulants Market Size, By Chemistry, 2015�2022 (USD Million)
Table 66 France: By Market Size, By Chemistry, 2015�2022 (Ton)
Table 67 France: Encapsulants Market Size, By End-Use Industry, 2015�2022 (USD Million)
Table 68 France: By Market Size, By End-Use Industry, 2015�2022 (Ton)
Table 69 U.K.: Encapsulants Market Size, By Chemistry, 2015�2022 (USD Million)
Table 70 U.K.: By Market Size, By Chemistry, 2015�2022 (Ton)
Table 71 U.K.: Encapsulants Market Size, By End-Use Industry, 2015�2022 (USD Million)
Table 72 U.K.: By Market Size, By End-Use Industry, 2015�2022 (Ton)
Table 73 Italy: Encapsulants Market Size, By Chemistry, 2015�2022 (USD Million)
Table 74 Italy: By Market Size, By Chemistry, 2015�2022 (Ton)
Table 75 Italy: Encapsulants Market Size, By End-Use Industry, 2015�2022 (USD Million)
Table 76 Italy: By Market Size, By End-Use Industry, 2015�2022 (Ton)
Table 77 Rest of Europe: Encapsulants Market Size, By Chemistry, 2015�2022 (USD Million)
Table 78 Rest of Europe: By Market Size, By Chemistry, 2015�2022 (Ton)
Table 79 Rest of Europe: Encapsulants Market Size, By End-Use Industry, 2015�2022 (USD Million)
Table 80 Rest of Europe: By Market Size, By End-Use Industry, 2015�2022 (Ton)
Table 81 Asia-Pacific: Encapsulants Market Size, By Country, 2015�2022 (USD Million)
Table 82 Asia-Pacific: By Market Size, By Country, 2015�2022 (Ton)
Table 83 Asia-Pacific: Encapsulants Market Size, By Chemistry, 2015�2022 (USD Million)
Table 84 Asia-Pacific: By Market Size, By Chemistry, 2015�2022 (Ton)
Table 85 Asia-Pacific: Encapsulants Market Size, By Curing Type, 2015�2022 (USD Million)
Table 86 Asia-Pacific: By Market Size, By Curing Type, 2015�2022 (Ton)
Table 87 Asia-Pacific: Encapsulants Market Size, By End-Use Industry, 2015�2022 (USD Million)
Table 88 Asia-Pacific: By Market Size, By End-Use Industry, 2015�2022 (Ton)
Table 89 China: Encapsulants Market Size, By Chemistry, 2015�2022 (USD Million)
Table 90 China: By Market Size, By Chemistry, 2015�2022 (Ton)
Table 91 China: Encapsulants Market Size, By End-Use Industry, 2015�2022 (USD Million)
Table 92 China: By Market Size, By End-Use Industry, 2015�2022 (Ton)
Table 93 Japan: Encapsulants Market Size, By Chemistry, 2015�2022 (USD Million)
Table 94 Japan: Encapsulants Market Size, By Chemistry, 2015�2022 (Ton)
Table 95 Japan: Encapsulants Market Size, By End-Use Industry, 2015�2022 (USD Million)
Table 96 Japan: Encapsulants Market Size, By End-Use Industry, 2015�2022 (Ton)
Table 97 South Korea: Encapsulants Market Size, By Chemistry, 2015�2022 (USD Million)
Table 98 South Korea: Encapsulants Market Size, By Chemistry, 2015�2022 (Ton)
Table 99 South Korea: Encapsulants Market Size, By End-Use Industry, 2015�2022 (USD Million)
Table 100 South Korea: Encapsulants Market Size, By End-Use Industry, 2015�2022 (Ton)
Table 101 Taiwan: Encapsulants Market Size, By Chemistry, 2015�2022 (USD Million)
Table 102 Taiwan: Encapsulants Market Size, By Chemistry, 2015�2022 (Ton)
Table 103 Taiwan: Encapsulants Market Size, By End-Use Industry, 2015�2022 (USD Million)
Table 104 Taiwan: Encapsulants Market Size, By End-Use Industry, 2015�2022 (Ton)
Table 105 India: Encapsulants Market Size, By Chemistry, 2015�2022 (USD Million)
Table 106 India: Encapsulants Market Size, By Chemistry, 2015�2022 (Ton)
Table 107 India: Encapsulants Market Size, By End-Use Industry, 2015�2022 (USD Million)
Table 108 India: Encapsulants Market Size, By End-Use Industry, 2015�2022 (Ton)
Table 109 Rest of Asia-Pacific: Encapsulants Market Size, By Chemistry, 2015�2022 (USD Million)
Table 110 Rest of Asia-Pacific: Encapsulants Market Size, By Chemistry, 2015�2022 (Ton)
Table 111 Rest of Asia-Pacific: Encapsulants Market Size, By End-Use Industry, 2015�2022 (USD Million)
Table 112 Rest of Asia-Pacific: Encapsulants Market Size, By End-Use Industry, 2015�2022 (Ton)
Table 113 Middle East & Africa: Encapsulants Market Size, By Country, 2015�2022 (USD Million)
Table 114 Middle East & Africa: Encapsulants Market Size, By Country, 2015�2022 (Ton)
Table 115 Middle East & Africa: Encapsulants Market Size, By Chemistry, 2015�2022 (USD Million)
Table 116 Middle East & Africa: Encapsulants Market Size, By Chemistry, 2015�2022 (Ton)
Table 117 Middle East & Africa: Encapsulants Market Size, By Curing Type, 2015�2022 (USD Million)
Table 118 Middle East & Africa: Encapsulants Market Size, By Curing Type, 2015�2022 (Ton)
Table 119 Middle East & Africa: Encapsulants Market Size, By End-Use Industry, 2015�2022 (USD Million)
Table 120 Middle East & Africa: Encapsulants Market Size, By End-Use Industry, 2015�2022 (Ton)
Table 121 UAE: Encapsulants Market Size, By Chemistry, 2015�2022 (USD Million)
Table 122 UAE: Encapsulants Market Size, By Chemistry, 2015�2022 (Ton
Table 123 UAE: Encapsulants Market Size, By End-Use Industry, 2015�2022 (USD Million)
Table 124 UAE: Encapsulants Market Size, By End-Use Industry, 2015�2022 (Ton)
Table 125 Saudi Arabia: Encapsulants Market Size, By Chemistry, 2015�2022 (USD Million)
Table 126 Saudi Arabia: Encapsulants Market Size, By Chemistry, 2015�2022 (Ton)
Table 127 Saudi Arabia: Encapsulants Market Size, By End-Use Industry, 2015�2022 (USD Million)
Table 128 Saudi Arabia: Encapsulants Market Size, By End-Use Industry, 2015�2022 (Ton)
Table 129 South Africa: Encapsulants Market Size, By Chemistry, 2015�2022 (USD Million)
Table 130 South Africa: Encapsulants Market Size, By Chemistry, 2015�2022 (Ton)
Table 131 South Africa: Encapsulants Market Size, By End-Use Industry, 2015�2022 (USD Million)
Table 132 South Africa: Encapsulants Market Size, By End-Use Industry, 2015�2022 (Ton)
Table 133 Rest of Middle East & Africa: Encapsulants Market Size, By Chemistry, 2015�2022 (USD Million)
Table 134 Rest of Middle East & Africa: Encapsulants Market Size, By Chemistry, 2015�2022 (Ton)
Table 135 Rest of Middle East & Africa: Encapsulants Market Size, By End-Use Industry, 2015�2022 (USD Million)
Table 136 Rest of Middle East & Africa: Encapsulants Market Size, By End-Use Industry, 2015�2022 (Ton)
Table 137 South America: Encapsulants Market Size, By Country, 2015�2022 (USD Million)
Table 138 South America: Encapsulants Market Size, By Country, 2015�2022 (Ton)
Table 139 South America: Encapsulants Market Size, By Chemistry, 2015�2022 (USD Million)
Table 140 South America: Encapsulants Market Size, By Chemistry, 2015�2022 (Ton)
Table 141 South America: Encapsulants Market Size, By Curing Type, 2015�2022 (USD Million)
Table 142 South America: Encapsulants Market Size, By Curing Type, 2015�2022 (Ton)
Table 143 South America: Encapsulants Market Size, By End-Use Industry, 2015�2022 (USD Million)
Table 144 South America: Encapsulants Market Size, By End-Use Industry, 2015�2022 (Ton)
Table 145 Brazil: Encapsulants Market Size, By Chemistry, 2015�2022 (USD Million)
Table 146 Brazil: Encapsulants Market Size, By Chemistry, 2015�2022 (Ton)
Table 147 Brazil: Encapsulants Market Size, By End-Use Industry, 2015�2022 (USD Million)
Table 148 Brazil: Encapsulants Market Size, By End-Use Industry, 2015�2022 (Ton)
Table 149 Argentina: Encapsulants Market Size, By Chemistry, 2015�2022 (USD Million)
Table 150 Argentina: Encapsulants Market Size, By Chemistry, 2015�2022 (Ton)
Table 151 Argentina: Encapsulants Market Size, By End-Use Industry, 2015�2022 (USD Million)
Table 152 Argentina: Encapsulants Market Size, By End-Use Industry, 2015�2022 (Ton)
Table 153 Rest of South America: Encapsulants Market Size, By Chemistry, 2015�2022 (USD Million)
Table 154 Rest of South America: Encapsulants Market Size, By Chemistry, 2015�2022 (Ton)
Table 155 Rest of South America: Encapsulants Market Size, By End-Use Industry, 2015�2022 (USD Million)
Table 156 Rest of South America: Encapsulants Market Size, By End-Use Industry, 2015�2022 (Ton)
Table 157 Market Ranking of Key Players, 2016
List of Figures (39 Figures)
Figure 1 Encapsulants: Market Segmentation
Figure 2 Encapsulants Market: Research Design
Figure 3 Market Size Estimation: Bottom-Up Approach
Figure 4 Market Size Estimation: Top-Down Approach
Figure 5 Encapsulants Market: Data Triangulation
Figure 6 Epoxy Encapsulant to Lead Market During the Forecast Period
Figure 7 Room Temperature Curing Type to Dominate Encapsulants Market Between 2017 and 2022
Figure 8 Consumer Electronics to Lead Encapsulants Market Between 2017 and 2022
Figure 9 Asia-Pacific Dominated the Encapsulants Market in 2016
Figure 10 Increasing Demand From Consumer Electronics and Transportation End-Use Industries to Drive Encapsulants Market
Figure 11 China Was the Largest Encapsulants Market in Asia-Pacific in 2016
Figure 12 Consumer Electronics to Account for the Largest Share of Encapsulants Market Between 2017 and 2022
Figure 13 Epoxy Encapsulant to Account for the Largest Market Share Between 2017 and 2022
Figure 14 Room Temperature Cure to Account for the Largest Market Share Between 2017 and 2022
Figure 15 Factors Governing Encapsulants Market
Figure 16 Porter�s Five Forces Analysis: Encapsulants Market
Figure 17 Global Semiconductor Sales, 2014�2017
Figure 18 Asia-Pacific to Be Fastest-Growing Epoxy Encapsulant Market Between 2017 and 2022
Figure 19 Asia-Pacific to Be the Largest Silicone Encapsulant Market Between 2017 and 2022
Figure 20 Asia-Pacific to Lead Urethane Encapsulant Market Between 2017 and 2022
Figure 21 Asia-Pacific to Be Fastest-Growing Market for Room Temperature Curing Type Between 2017 and 2022
Figure 22 Asia-Pacific to Be Largest Market for Heat Curing Type Between 2017 and 2022
Figure 23 Asia-Pacific to Lead the Market for UV Curing Type Between 2017 and 2022
Figure 24 North America to Be Second-Largest Encapsulants Market in Consumer Electronics Between 2017 and 2022
Figure 25 Europe to Remain Second-Largest Encapsulants Market in Transportation During Forecast Period
Figure 26 Asia-Pacific to Dominate Encapsulants Market in Medical Between 2017 and 2022
Figure 27 Asia-Pacific to Lead Encapsulants Market in Energy & Power Between 2017 and 2022
Figure 28 South America to Be Second-Fastest Growing Encapsulants Market in Other End-Use Industries During Forecast Period
Figure 29 Regional Market Snapshot: Asia-Pacific to Be the Fastest-Growing Encapsulants Market During the Forecast Period
Figure 30 North America Market Snapshot: U.S. Dominates the Encapsulants Market
Figure 31 Asia-Pacific Market Snapshot: China Dominates the Encapsulants Market
Figure 32 DOW Corning Corporation: Company Snapshot
Figure 33 H.B. Fuller: Company Snapshot
Figure 34 Shin-Etsu Chemical Co. Ltd.,: Company Snapshot
Figure 35 Sumitomo Bakelite Co., Ltd.: Company Snapshot
Figure 36 Henkel AG & Co. KGaA: Company Snapshot
Figure 37 Kyocera Corporation: Company Snapshot
Figure 38 Hitachi Chemical Co., Ltd.: Company Snapshot
Figure 39 Panasonic Corporation: Company Snapshot


Growth opportunities and latent adjacency in Encapsulants Market