Digital Inks Market by Formulation (Solvent-Based, Water-Based, UV-Cured), Application (Advertising & Promotion, Ceramic Tiles Printing, Clothing & Household Textiles, Packaging, Glass Printing), Substrate, and Region - Global Forecast to 2023


The digital inks market is projected to reach USD 4.17 Billion by 2023, at a CAGR of 9.1%.
Objectives of Digital Inks Market Study are:
- To estimate and forecast the digital inks market, in terms of value
- To provide a detailed segmentation of the digital inks market on the basis of formulation, substrate, application, and region
- To analyze and forecast the segments of the digital inks market and present an overall view of the market
- To identify emerging trends and opportunities in the digital inks market
- To analyze the market with a focus on high growth applications and fast-growing segments
- To analyze factors that drive and restrain the growth of the digital inks market
- To provide a comprehensive competitive landscape of the market and profile key market players with respect to their market shares/ranking
The years considered for the study are:
- Base Year – 2017
- Estimated Year – 2018
- Projected Year – 2023
- Forecast Period – 2018 to 2023
For company profiles in the report, 2017 has been considered as the base year. In cases wherein the information is unavailable for the base year, the years prior to it have been considered.
Digital Inks Market Research Methodology
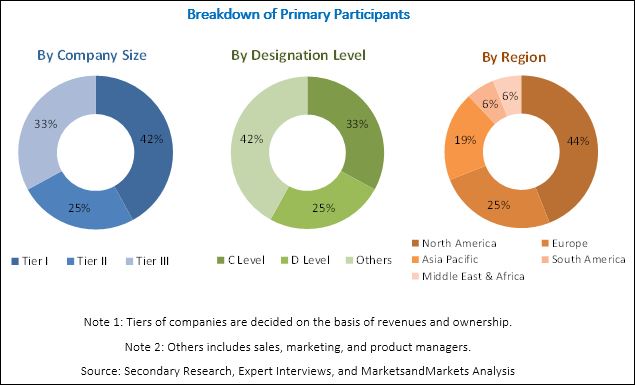
The research methodology used to estimate and forecast the global digital inks market began with capturing data on key vendor revenues through secondary sources, such as Hoovers, Bloomberg, Chemical Weekly, Factiva, and various other government and private websites. Vendor offerings have also been taken into consideration to determine market segmentation. After arriving at the overall market size, the total market was split into several segments and subsegments, which were later verified through primary research by conducting extensive interviews with key personnel, such as CEOs, VPs, directors, and executives. Data triangulation and market breakdown procedures were employed to complete the overall market engineering process and arrive at the exact statistics for all the segments and subsegments of the market. The breakdown of profiles of primaries is depicted in the figure below.
To know about the assumptions considered for the study, download the pdf brochure
The digital inks market has a diversified ecosystem of upstream players, including raw material suppliers, along with downstream stakeholders, vendors, and government organizations. Companies operating in the digital inks market include Sun Chemical (US), INX International Ink (US), Toyo Ink SC Holdings Co. (Japan), JK Group (Italy), and Nazdar Company (US), among others.
This research study involved the extensive use of secondary sources, such as encyclopedias, directories, and databases to identify and collect information useful for the technical, market-oriented, and commercial study of the global digital inks market. Primary sources, such as selected experts from relevant industries and suppliers, have been interviewed to obtain and verify important information as well as to assess prospects of the market.
As a part of the primary research process, various experts from both the supply and demand sides have been interviewed to obtain qualitative and quantitative information. Primary sources from the supply side include industry experts, such as CEOs, vice presidents, marketing directors, technology & innovation directors, and related key executives from various major companies and organizations operating in the digital inks market. Primary sources from the demand side included experts and key personnel from end-use industries.
As part of the market engineering process, both the top-down and bottom-up approaches have been extensively used along with the data triangulation method to estimate and forecast the overall market segments listed in this report. Extensive qualitative and quantitative data have been analyzed on the complete market engineering process to provide key information and insights throughout the report.
Key Questions of Digital Inks Market
- What is the reason behind the high growth rate of the digital inks market?
- New players are venturing into the digital inks market. How will this affect the digital inks industry?
- The digital inks market is witnessing rapid changes. How far is digital textile printing likely to drive the innovation?
- How is digital printing replacing solvent-based printing?
Target Audience in Digital Inks Market
- Manufacturers, Dealers, and Suppliers of Digital Inks
- End Users of Digital Inks
- Government and Research Organizations
- Companies Operational in Material R&D
- Associations and Industrial Bodies
- Investment Banks
- Consulting Companies/Consultants in Chemical and Material Sectors
- “This study answers several questions for stakeholders, primarily the market segments, which they need to focus on during the next 2 to 5 years so that they may prioritize their efforts and investments accordingly.”
Digital Inks Market Report Scope
This research report categorizes the digital inks market based on formulation, substrate, application, and region, and forecasts revenues as well as analyzes trends in each of the submarkets.
-
Digital Inks Market On the Basis of Formulation:
- Solvent-based
- Water-based
- UV-cured
- Others
-
Digital Inks Market On the Basis of Substrate:
- Plastics
- Textile
- Ceramics & Glass
- Paper
-
Digital Inks Market On the Basis of Application:
- Advertising & Promotion
- Ceramic Tiles Printing
- Clothing & Household Textiles
- Packaging
- Publication
- Glass Printing
- Others
-
Digital Inks Market On the Basis of Region:
- Asia Pacific
- North America
- Europe
- Middle East & Africa
- South America
The Following Customization Options are Available for the Report:
Along with the given market data, MarketsandMarkets offers customizations as per the company’s specific needs. The following customization options are available for the report:
Product Analysis
- Product matrix, which provides a detailed comparison of the product portfolio of each company
Geographic Analysis
- Further breakdown of the Rest of Asia Pacific, Rest of the Middle East & Africa, Rest of Europe, and Rest of South America digital inks markets
Company Information
- Detailed analysis and profiles of additional market players (up to five companies)
The global digital inks market is projected to grow from an estimated USD 2.71 Billion in 2018 to USD 4.17 Billion by 2023, at a CAGR of 9.1% from 2018 to 2023. Stringent regulations regarding packaging have increased the demand for digital packaging printing inks. The growing demand for UV-cured digital inks due to their fast drying and eco-friendly qualities is also driving the market for digital inks. The growth in the ceramics textiles market is also a growth driver for the digital inks market.
The solvent-based segment is projected to be the largest formulation segment of the digital inks market from 2018 to 2023. Solvent-based digital inks act as carriers delivering the pigment to the substrate. These inks also help in melting the surface of the substrate. Ink colorants then penetrate the softened surface to reach the inner layer of the substrate. After the solvent evaporates, the pigment is etched into the surface of the substrate to create an image that is scratch- and weather-resistant. Solvent-based digital inks can be used with a variety of substrates, including inexpensive uncoated media.
The plastics segment is estimated to be the largest substrate segment of the digital inks market in 2018. Plastics are suitable substrates for printing, as they have strength, resilience, flexibility, durability, and protective properties. UV-curable wide-format ink-jet technologies, such as digital roll-to-roll and digital cut-sheet are used to print on plastics digitally. Various plastic substrates used for digital printing include polyester, polycarbonate, rigid vinyl, cast vinyl, and polystyrene acrylic.
The advertising & promotion segment is estimated to be the largest application segment of the digital inks market in 2018. The restaurant and food services industry uses digitally-printed wide-format graphics to increase sales and create awareness about food products. The financial services industry uses digitally-printed promotional products to drive operations and sales.
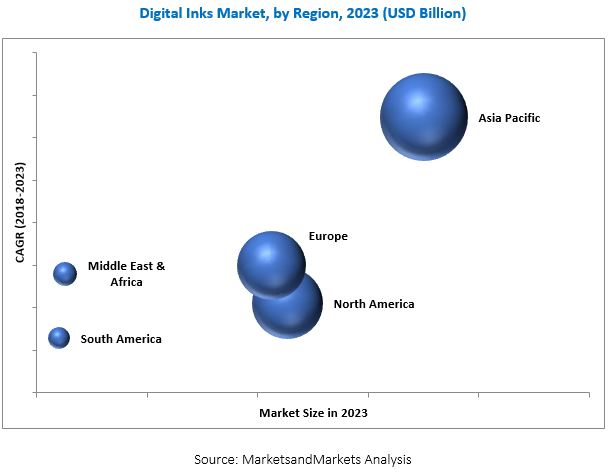
Asia Pacific is expected to be the fastest-growing market for digital inks during the forecast period. The growth of the retail end-use segment is the main factor driving the demand for digital inks for the advertising & promotion application in the region. The increasing construction expenditure is another reason for the growth of this market in the region.
The slowdown of the publishing market is a restraint for the digital inks market. The emergence of the online media has contributed to a rise in digital content, which, in turn, has impacted the print media business. Ink consumption is declining due to the low demand for published books, printed newspapers, and catalogs.
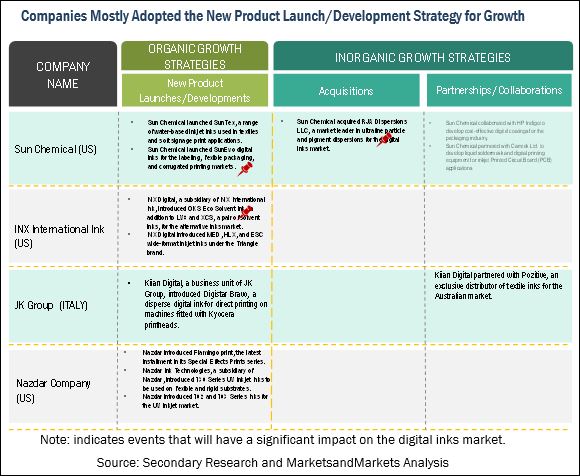
Key players operating in the digital inks market include Sun Chemical (US), INX International Ink (US), Toyo Ink SC Holdings Co. (Japan), JK Group (Italy), and Nazdar Company (US), among others. These companies focus on enhancing their product portfolios to grow in the digital inks market.
Global Growth Driven by Top 3 Markets: China, the US, and Japan
Improvements in digital printing have led to the increased use of digital inks in high-end point-of-purchase retail applications, such as soft signage printing. In soft signage printing, vinyl is being replaced with fabrics as a substrate, owing to the lightweight nature of fabrics.
The digital inks market is projected to reach USD 4.17 billion by 2023, at a CAGR of 9.1% from 2018 to 2023. The development of the digital textile market has majorly contributed to the growth of the digital inks market.
China is the largest market for digital inks in the world. Growth in the Chinese retail sector has driven the demand for digital inks in the country, especially in the advertising & promotion application. Growth has also been witnessed in the Chinese retail sub-sectors, such as cosmetics, jewelry, sports & leisure articles, furniture, communication devices, household appliances, and consumer electronics. The US and Japan, the next two largest markets after China, will also offer significant growth opportunities for the players involved in the digital inks market.
Key Findings in the Global Digital Inks Study:
India will be the fastest growing market for digital inks till 2023
India is the third-largest economy in the Asia Pacific region, in terms of purchasing power parity. According to the World Bank, the GDP of India was USD 2.264 trillion in 2016. The retail sector is one of the fastest-growing sectors in India. This sector is driven by the expanding economy, increasing consumption rates, urbanization, and a growing middle-class population. The growth of organized retail, unorganized retail, and e-commerce is thus expected to fuel the demand for digital inks in advertising & promotion and packaging applications.
OEMs are looking for new and innovative ways to promote their brands using banners, vehicle wraps, and point-of-purchase displays, which can be easily produced in large quantities using digital printers. According to India Brand Equity Foundation (IBEF), India is a lucrative destination for foreign investments in the manufacturing industry.
The construction industry in India is expected to witness significant growth, owing to favorable initiatives undertaken by the Indian government to promote construction activities. Additionally, increased investments in infrastructural projects are expected to expand the construction industry in India, subsequently driving the growth of the digital inks market in this country.
The digital inks market is witnessing a steady growth rate in North America
The North America digital inks market is driven by technological advancements in the packaging and textile industries. Increasing sales of consumer durables, high disposable income, and increasing demand for packaged foods are factors driving the demand for digital inks in packaging. Advertising & promotion is the largest application of the digital inks market in North America. Increasing expenditure on advertising in the US is driving the advertising & promotion segment of the North America digital inks market.
Factors such as the shift from traditional printing to color printing, shorter print runs, tighter deadlines, and the need for a faster turnaround in the graphics business are driving the North America digital inks market. The digital inks market in the US is matured, with a steady growth rate.
Frequently Asked Questions (FAQ):
How big is the Digital Inks Market industry?
The global digital inks market is projected to grow from USD 2.71 Billion in 2018 to USD 4.17 Billion by 2023, at a CAGR of 9.1% from 2018 to 2023.
Who leading market players in Digital Inks industry?
Key players in the digital inks market include Sun Chemical (US), INX International Ink (US), Toyo Ink SC Holdings Co. (Japan), JK Group (Italy), and Nazdar Company (US), among others.
To speak to our analyst for a discussion on the above findings, click Speak to Analyst
 Exclusive indicates content/data unique to MarketsandMarkets and not available with any competitors.
Table of Contents
1 Introduction (Page No. - 15)
1.1 Objectives of the Study
1.2 Market Definition
1.3 Scope of the Study
1.3.1 Regional Scope
1.3.2 Years Considered for the Study
1.4 Currency
1.5 Stakeholders
2 Research Methodology (Page No. - 18)
2.1 Research Data
2.1.1 Secondary Data
2.1.1.1 Key Data From Secondary Sources
2.1.2 Primary Data
2.1.2.1 Key Data From Primary Sources
2.1.2.2 Key Industry Insights
2.1.2.3 Breakdown of Primary Interviews
2.2 Market Size Estimation
2.2.1 Bottom-Up Approach
2.2.2 Top-Down Approach
2.3 Data Triangulation
2.4 Assumptions
2.5 Limitations
3 Executive Summary (Page No. - 26)
4 Premium Insights (Page No. - 29)
4.1 Attractive Opportunities in the Digital Inks Market
4.2 Digital Inks Market, By Region
4.3 Asia Pacific Digital Inks Market, By Country and Application
4.4 Digital Inks Market, By Formulation and Region
4.5 Top Countries in the Digital Inks Market
5 Market Overview (Page No. - 32)
5.1 Introduction
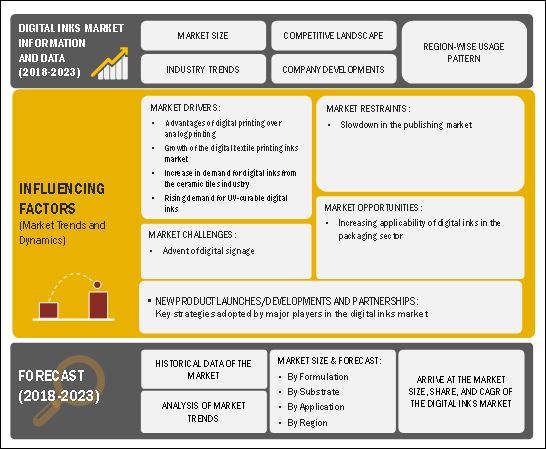
5.2 Market Dynamics
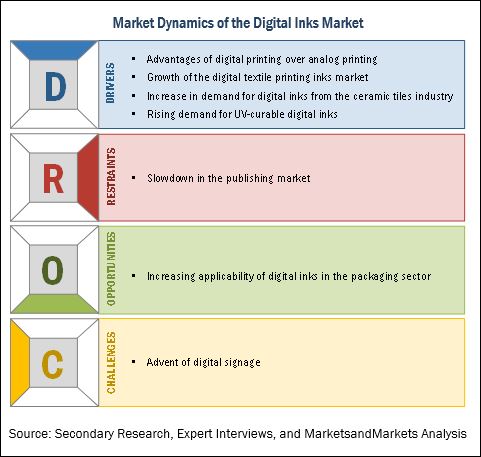
5.2.1 Drivers
5.2.1.1 Advantages of Digital Printing Over Analog Printing
5.2.1.2 Growth of the Digital Textile Printing Inks Market
5.2.1.3 Increase in Demand for Digital Inks From the Ceramic Tiles Industry
5.2.1.4 Rising Demand for UV-Curable Digital Inks
5.2.2 Restraints
5.2.2.1 Slowdown in the Publishing Market
5.2.3 Opportunities
5.2.3.1 Increasing Applicability of Digital Inks in the Packaging Sector
5.2.4 Challenges
5.2.4.1 Advent of Digital Signage
5.3 Porter’s Five Forces Analysis
5.3.1 Bargaining Power of Suppliers
5.3.2 Threat of New Entrants
5.3.3 Threat of Substitutes
5.3.4 Bargaining Power of Buyers
5.3.5 Intensity of Competitive Rivalry
5.4 Macroeconomic Indicators
5.4.1 Annual GDP Growth Rate of Major Economies
5.4.2 Advertising Industry
5.4.3 Ceramic Tiles Industry
6 Digital Inks Market, By Formulation (Page No. - 41)
6.1 Introduction
6.2 Solvent-Based
6.3 Water-Based
6.4 UV-Cured
6.5 Others
7 Digital Inks Market, By Application (Page No. - 47)
7.1 Introduction
7.2 Advertising & Promotion
7.3 Ceramic Tiles Printing
7.4 Packaging
7.5 Clothing & Household Textiles
7.6 Glass Printing
7.7 Publication
7.8 Others
8 Digital Inks Market, By Substrate (Page No. - 57)
8.1 Introduction
8.2 Plastics
8.3 Ceramics & Glass
8.4 Textiles
8.5 Paper
9 Regional Analysis (Page No. - 63)
9.1 Introduction
9.2 Asia Pacific
9.2.1 China
9.2.2 Japan
9.2.3 India
9.2.4 South Korea
9.2.5 Australia
9.2.6 Indonesia
9.2.7 Malaysia
9.2.8 Rest of Asia Pacific
9.3 North America
9.3.1 US
9.3.2 Canada
9.3.3 Mexico
9.4 Europe
9.4.1 Germany
9.4.2 UK
9.4.3 France
9.4.4 Italy
9.4.5 Spain
9.4.6 Russia
9.4.7 Turkey
9.4.8 Rest of Europe
9.5 Middle East & Africa
9.5.1 South Africa
9.5.2 Saudi Arabia
9.5.3 Rest of the Middle East & Africa
9.6 South America
9.6.1 Brazil
9.6.2 Argentina
9.6.3 Rest of South America
10 Lcompetitive Landscape (Page No. - 126)
10.1 Overview
10.2 Market Ranking Analysis
10.3 Competitive Situation & Trends
10.3.1 New Product Launches/Developments
10.3.2 Partnerships
10.3.3 Collaborations
10.3.4 Acquisitions
11 Company Profiles (Page No. - 132)
(Business Overview, Products Offered, Recent Developments, SWOT Analysis, MnM View)*
11.1 Sun Chemical
11.2 Inx International Ink
11.3 Toyo Ink SC Holdings Co.
11.4 JK Group
11.5 Nazdar Company
11.6 Fujifilm Holdings Corporation
11.7 Marabu
11.8 Sensient Imaging Technologies
11.9 Nutec Digital Ink
11.10 Bordeaux Digital Printink Ltd.
*Details on Business Overview, Products Offered, Recent Developments, SWOT Analysis, MnM View Might Not Be Captured in Case of Unlisted Companies.
11.11 Other Leading Players
11.11.1 Dupont
11.11.2 Torrecid
11.11.3 Siegwerk
11.11.4 Spgprints
11.11.5 Huntsman Corporation
11.11.6 Dip-Tech
11.11.7 Kornit Digital
11.11.8 Avery Dennison
11.11.9 Wikoff Color Corporation
11.11.10 Independent Ink
11.11.11 Cabot Corporation
11.11.12 Blue Jade Texink Pvt. Ltd.
11.11.13 Megasign
11.11.14 Esmalglass - Itaca Group
11.11.15 Braden Sutphin Ink Company
12 Appendix (Page No. - 157)
12.1 Discussion Guide
12.2 Knowledge Store: Marketsandmarkets’ Subscription Portal
12.3 Introducing RT: Real-Time Market Intelligence
12.4 Available Customizations
12.5 Related Reports
12.6 Author Details
List of Tables (192 Tables)
Table 1 Annual GDP Growth Rate of Major Economies From 2012 to 2016
Table 2 Revenue Spent on Advertising By Key Countries, 2017
Table 3 Ceramic Tiles Production, By Country, 2011-2015
Table 4 Ceramic Tiles Consumption, By Country, 2011-2015
Table 5 Digital Inks Market, By Formulation, 2016–2023 (USD Million)
Table 6 Digital Inks Market, By Formulation, 2016–2023 (Kilotons)
Table 7 Solvent-Based Segment, By Region, 2016–2023 (USD Million)
Table 8 Solvent-Based Segment, By Region, 2016–2023 (Kilotons)
Table 9 Water-Based Segment, By Region, 2016–2023 (USD Million)
Table 10 Water-Based Segment, By Region, 2016–2023 (Kilotons)
Table 11 UV-Cured Segment, By Region, 2016–2023 (USD Million)
Table 12 UV-Cured Segment, By Region, 2016–2023 (Kilotons)
Table 13 Other Formulations Segment, By Region, 2016–2023 (USD Million)
Table 14 Other Formulations Segment, By Region, 2016–2023 (Kilotons)
Table 15 Digital Inks Market, By Application, 2016–2023 (USD Million)
Table 16 Digital Inks Market, By Application, 2016–2023 (Kilotons)
Table 17 Advertising & Promotion Segment, By Region, 2016–2023 (USD Million)
Table 18 Advertising & Promotion Segment, By Region, 2016–2023 (Kilotons)
Table 19 Ceramic Tiles Printing Segment, By Region, 2016–2023 (USD Million)
Table 20 Ceramic Tiles Printing Segment, By Region, 2016–2023 (Kilotons)
Table 21 Packaging Segment, By Region, 2016–2023 (USD Million)
Table 22 Packaging Segment, By Region, 2016–2023 (Kilotons)
Table 23 Clothing & Household Textiles Segment, By Region, 2016–2023 (USD Million)
Table 24 Clothing & Household Textiles Segment, By Region, 2016–2023 (Kilotons)
Table 25 Glass Printing Segment, By Region, 2016–2023 (USD Million)
Table 26 Glass Printing Segment, By Region, 2016–2023 (Kilotons)
Table 27 Publication Segment, By Region, 2016–2023 (USD Million)
Table 28 Publication Segment, By Region, 2016–2023 (Kilotons)
Table 29 Other Applications Segment, By Region, 2016–2023 (USD Million)
Table 30 Other Applications Segment, By Region, 2016–2023 (Kilotons)
Table 31 Digital Inks Market, By Substrate, 2016–2023 (USD Million)
Table 32 Digital Inks Market, By Substrate, 2016–2023 (Kilotons)
Table 33 Plastics Segment, By Region, 2016–2023 (USD Million)
Table 34 Plastics Segment, By Region, 2016–2023 (Kilotons)
Table 35 Ceramics & Glass Segment, By Region, 2016–2023 (USD Million)
Table 36 Ceramics & Glass Segment, By Region, 2016–2023 (Kilotons)
Table 37 Textiles Segment, By Region, 2016–2023 (USD Million)
Table 38 Textiles Segment, By Region, 2016–2023 (Kilotons)
Table 39 Paper Segment, By Region, 2016–2023 (USD Million)
Table 40 Paper Segment, By Region, 2016–2023 (Kilotons)
Table 41 Digital Inks Market, By Region, 2016–2023 (USD Million)
Table 42 Digital Inks Market, By Region, 2016-2023 (Kilotons)
Table 43 Digital Inks Market, By Formulation 2016-2023 (USD Million)
Table 44 Digital Inks Market, By Formulation, 2016-2023 (Kilotons)
Table 45 Digital Inks Market, By Application, 2016-2023 (USD Million)
Table 46 Digital Inks Market, By Application, 2016-2023 (Kilotons)
Table 47 Digital Inks Market, By Substrate 2016-2023 (USD Million)
Table 48 Digital Inks Market, By Substrate, 2016-2023 (Kilotons)
Table 49 Asia Pacific Digital Inks Market, By Country, 2016-2023 (USD Million)
Table 50 Asia Pacific Digital Inks Market, By Country, 2016-2023 (Kilotons)
Table 51 Asia Pacific Digital Inks Market, By Formulation, 2016-2023 (USD Million)
Table 52 Asia Pacific Digital Inks Market, By Formulation, 2016-2023 (Kilotons)
Table 53 Asia Pacific Digital Inks Market, By Application, 2016-2023 (USD Million)
Table 54 Asia Pacific Digital Inks Market, By Application, 2016-2023 (Kilotons)
Table 55 Asia Pacific Digital Inks Market, By Substrate, 2016-2023 (USD Million)
Table 56 Asia Pacific Digital Inks Market, By Substrate, 2016-2023 (Kilotons)
Table 57 China Digital Inks Market, By Application, 2016-2023 (USD Million)
Table 58 China By Market, By Application, 2016-2023 (Kilotons)
Table 59 China By Market, By Formulation, 2016-2023 (USD Million)
Table 60 China By Market, By Formulation, 2016-2023 (Kilotons)
Table 61 Japan Digital Inks Market, By Application, 2016-2023 (USD Million)
Table 62 Japan By Market, By Application, 2016-2023 (Kilotons)
Table 63 Japan By Market, By Formulation, 2016-2023 (USD Million)
Table 64 Japan By Market, By Formulation, 2016-2023 (Kilotons)
Table 65 India Digital Inks Market, By Application, 2016-2023 (USD Million)
Table 66 India Digital Inks Market, By Application, 2016-2023 (Kilotons)
Table 67 India Digital Inks Market, By Formulation, 2016-2023 (USD Million)
Table 68 India Digital Inks Market, By Formulation, 2016-2023 (Kilotons)
Table 69 South Korea Digital Inks Market, By Application, 2016-2023 (USD Million)
Table 70 South Korea By Market, By Application, 2016-2023 (Kilotons)
Table 71 South Korea By Market, By Formulation, 2016-2023 (USD Million)
Table 72 South Korea By Market, By Formulation, 2016-2023 (Kilotons)
Table 73 Australia Digital Inks Market, By Application, 2016-2023 (USD Million)
Table 74 Australia Digital Inks Market, By Application, 2016-2023 (Kilotons)
Table 75 Australia Digital Inks Market, By Formulation, 2016-2023 (USD Million)
Table 76 Australia Digital Inks Market, By Formulation, 2016-2023 (Kilotons)
Table 77 Indonesia Digital Inks Market, By Application, 2016-2023 (USD Million)
Table 78 Indonesia By Market, By Application, 2016-2023 (Kilotons)
Table 79 Indonesia Digital Inks Market, By Formulation, 2016-2023 (USD Million)
Table 80 Indonesia Digital Inks Market, By Formulation, 2016-2023 (Kilotons)
Table 81 Malaysia Digital Inks Market, By Application, 2016-2023 (USD Million)
Table 82 Malaysia By Market, By Application, 2016-2023 (Kilotons)
Table 83 Malaysia By Market, By Formulation, 2016-2023 (USD Million)
Table 84 Malaysia By Market, By Formulation, 2016-2023 (Kilotons)
Table 85 Rest of Asia Pacific Digital Inks Market, By Application, 2016-2023 (USD Million)
Table 86 Rest of Asia Pacific By Market, By Application, 2016-2023 (Kilotons)
Table 87 Rest of Asia Pacific By Market, By Formulation, 2016-2023 (USD Million)
Table 88 Rest of Asia Pacific By Market, By Formulation, 2016-2023 (Kilotons)
Table 89 North America By Market, By Country, 2016-2023 (USD Million)
Table 90 North America Digital Inks Market, By Country, 2016-2023 (Kilotons)
Table 91 North America Digital Inks Market, By Formulation, 2016-2023 (USD Million)
Table 92 North America Digital Inks Market, By Formulation, 2016-2023 (Kilotons)
Table 93 North America Digital Inks Market, By Application, 2016-2023 (USD Million)
Table 94 North America Digital Inks Market, By Application, 2016-2023 (Kilotons)
Table 95 North America Digital Inks Market, By Substrate, 2016-2023 (USD Million)
Table 96 North America By Market, By Substrate, 2016-2023 (Kilotons)
Table 97 US By Market, By Application, 2016-2023 (USD Million)
Table 98 US By Market, By Application, 2016-2023 (Kilotons)
Table 99 US By Market, By Formulation, 2016-2023 (USD Million)
Table 100 US By Market, By Formulation, 2016-2023 (Kilotons)
Table 101 Canada Digital Inks Market, By Application, 2016-2023 (USD Million)
Table 102 Canada By Market, By Application, 2016-2023 (Kilotons)
Table 103 Canada By Market, By Formulation, 2016-2023 (USD Million)
Table 104 Canada By Market, By Formulation, 2016-2023 (Kilotons)
Table 105 Mexico By Market, By Application, 2016-2023 (USD Million)
Table 106 Mexico By Market, By Application, 2016-2023 (Kilotons)
Table 107 Mexico By Market, By Formulation, 2016-2023 (USD Million)
Table 108 Mexico By Market, By Formulation, 2016-2023 (Kilotons)
Table 109 Europe By Market, By Country, 2016-2023 (USD Million)
Table 110 Europe By Market, By Country, 2016-2023 (Kilotons)
Table 111 Europe By Market, By Formulation, 2016-2023 (USD Million)
Table 112 Europe By Market, By Formulation, 2016-2023 (Kilotons)
Table 113 Europe By Market, By Application, 2016-2023 (USD Million)
Table 114 Europe By Market, By Application, 2016-2023 (Kilotons)
Table 115 Europe By Market, By Substrate, 2016-2023 (USD Million)
Table 116 Europe By Market, By Substrate, 2016-2023 (Kilotons)
Table 117 Germany Digital Inks Market, By Application, 2016-2023 (USD Million)
Table 118 Germany By Market, By Application, 2016-2023 (Kilotons)
Table 119 Germany By Market, By Formulation, 2016-2023 (USD Million)
Table 120 Germany By Market, By Formulation, 2016-2023 (Kilotons)
Table 121 UK Digital Inks Market, By Application, 2016-2023 (USD Million)
Table 122 UK By Market, By Application, 2016-2023 (Kilotons)
Table 123 UK By Market, By Formulation, 2016-2023 (USD Million)
Table 124 UK By Market, By Formulation, 2016-2023 (Kilotons)
Table 125 France Digital Inks Market, By Application, 2016-2023 (USD Million)
Table 126 France By Market, By Application, 2016-2023 (Kilotons)
Table 127 France By Market, By Formulation, 2016-2023 (USD Million)
Table 128 France By Market, By Formulation, 2016-2023 (Kilotons)
Table 129 Italy By Market, By Application, 2016-2023 (USD Million)
Table 130 Italy By Market, By Application, 2016-2023 (Kilotons)
Table 131 Italy By Market, By Formulation, 2016-2023 (USD Million)
Table 132 Italy By Market, By Formulation, 2016-2023 (Kilotons)
Table 133 Spain By Market, By Application, 2016-2023 (USD Million)
Table 134 Spain By Market, By Application, 2016-2023 (Kilotons)
Table 135 Spain By Market, By Formulation, 2016-2023 (USD Million)
Table 136 Spain By Market, By Formulation, 2016-2023 (Kilo Tons)
Table 137 Russia By Market, By Application, 2016-2023 (USD Million)
Table 138 Russia By Market, By Application, 2016-2023 (Kilotons)
Table 139 Russia By Market, By Formulation, 2016-2023 (USD Million)
Table 140 Russia By Market, By Formulation, 2016-2023 (Kilotons)
Table 141 Turkey By Market, By Application, 2016-2023 (USD Million)
Table 142 Turkey By Market, By Application, 2016-2023 (Kilotons)
Table 143 Turkey By Market, By Formulation, 2016-2023 (USD Million)
Table 144 Turkey By Market, By Formulation, 2016-2023 (Kilotons)
Table 145 Rest of Europe Digital Inks Market, By Application, 2016-2023 (USD Million)
Table 146 Rest of Europe By Market, By Application, 2016-2023 (Kilotons)
Table 147 Rest of Europe By Market, By Formulation, 2016-2023 (USD Million)
Table 148 Rest of Europe By Market, By Formulation, 2016-2023 (Kilotons)
Table 149 Middle East & Africa Digital Inks Market, By Country, 2016-2023 (USD Million)
Table 150 Middle East & Africa By Market, By Country, 2016-2023 (Kilotons)
Table 151 Middle East & Africa By Market, By Formulation, 2016-2023 (USD Million)
Table 152 Middle East & Africa By Market, By Formulation, 2016-2023 (Kilotons)
Table 153 Middle East & Africa By Market, By Application, 2016-2023 (USD Million)
Table 154 Middle East & Africa By Market, By Application, 2016-2023 (Kilotons)
Table 155 Middle East & Africa By Market, By Substrate, 2016-2023 (USD Million)
Table 156 Middle East & Africa By Market, By Substrate, 2016-2023 (Kilotons)
Table 157 South Africa Digital Inks Market, By Application, 2016-2023 (USD Million)
Table 158 South Africa By Market, By Application, 2016-2023 (Kilotons)
Table 159 South Africa By Market, By Formulation, 2016-2023 (USD Million)
Table 160 South Africa By Market, By Formulation, 2016-2023 (Kilotons)
Table 161 Saudi Arabia By Market, By Application, 2016-2023 (USD Million)
Table 162 Saudi Arabia By Market, By Application, 2016-2023 (Kilotons)
Table 163 Saudi Arabia By Market, By Formulation, 2016-2023 (USD Million)
Table 164 Saudi Arabia By Market, By Formulation, 2016-2023 (Kilotons)
Table 165 Rest of the Middle East & Africa Digital Inks Market, By Application, 2016-2023 (USD Million)
Table 166 Rest of the Middle East & Africa By Market, By Application, 2016-2023 (Kilotons)
Table 167 Rest of Middle East & Africa By Market, By Formulation, 2016-2023 (USD Million)
Table 168 Rest of Middle East & Africa By Market, By Formulation, 2016-2023 (Kilotons)
Table 169 South America Digital Inks Market, By Country, 2016-2023 (USD Million)
Table 170 South America By Market, By Country, 2016-2023 (Kilotons)
Table 171 South America By Market, By Formulation, 2016-2023 (USD Million)
Table 172 South America By Market, By Formulation, 2016-2023 (Kilotons)
Table 173 South America By Market, By Application, 2016-2023 (USD Million)
Table 174 South America By Market, By Application, 2016-2023 (Kilotons)
Table 175 South America By Market, By Substrate, 2016-2023 (USD Million)
Table 176 South America By Market, By Substrate, 2016-2023 (Kilotons)
Table 177 Brazil By Market, By Application, 2016-2023 (USD Million)
Table 178 Brazil By Market, By Application, 2016-2023 (Kilotons)
Table 179 Brazil By Market, By Formulation, 2016-2023 (USD Million)
Table 180 Brazil By Market, By Formulation, 2016-2023 (Kilotons)
Table 181 Argentina By Market, By Application, 2016-2023 (USD Million)
Table 182 Argentina By Market, By Application, 2016-2023 (Kilotons)
Table 183 Argentina By Market, By Formulation, 2016-2023 (USD Million)
Table 184 Argentina By Market, By Formulation, 2016-2023 (Kilotons)
Table 185 Rest of South America By Market, By Application, 2016-2023 (USD Million)
Table 186 Rest of South America By Market, By Application, 2016-2023 (Kilotons)
Table 187 Rest of South America By Market, By Formulation, 2016-2023 (USD Million)
Table 188 Rest of South America By Market, By Formulation, 2016-2023 (Kilotons)
Table 189 New Product Launches/Developments, 2013-2018
Table 190 Partnerships, 2017
Table 191 Collaborations, 2016-2017
Table 192 Acquisitions, 2017
List of Figures (29 Figures)
Figure 1 Digital Inks Market Segmentation
Figure 2 Digital Inks Market: Research Design
Figure 3 Market Size Estimation: Bottom-Up Approach
Figure 4 Market Size Estimation: Top-Down Approach
Figure 5 Data Triangulation
Figure 6 Solvent-Based Segment Projected to Lead Digital Inks Market Between 2018 and 2023
Figure 7 Plastics Estimated to Be Largest Substrate Segment of Digital Inks Market During Forecast Period
Figure 8 Advertising & Promotion Segment Expected to Lead Digital Inks Market During Forecast Period
Figure 9 Asia Pacific Estimated to Lead Digital Inks Market in 2018
Figure 10 Increasing Use of Digital Inks in Advertising & Promotion and Ceramic Tiles Printing Applications is Expected to Drive the Growth of the Digital Inks Market Between 2018 and 2023
Figure 11 The Digital Inks Market in Asia Pacific is Projected to Grow at the Highest CAGR During the Forecast Period
Figure 12 The Advertising & Promotion Application Segment is Estimated to Account for the Largest Share of the Asia Pacific Digital Inks Market in 2018
Figure 13 The Solvent-Based Formulation Segment is Estimated to Account for the Largest Share of the Digital Inks Market Across All Regions in 2018
Figure 14 The US is Projected to Lead the Digital Inks Market Between 2018 and 2023
Figure 15 Drivers, Restraints, Opportunities, and Challenges: Digital Inks Market
Figure 16 Digital Inks Market: Porter’s Five Forces Analysis
Figure 17 Solvent-Based Formulation Segment Projected to Lead Digital Inks Market During Forecast Period
Figure 18 Advertising & Promotion Application Segment Projected to Lead Digital Inks Market During Forecast Period
Figure 19 Plastics Substrate Segment Projected to Lead Digital Inks Market During Forecast Period
Figure 20 Regional Snapshot
Figure 21 Asia Pacific Digital Inks Market Snapshot
Figure 22 North America Digital Inks Market Snapshot
Figure 23 Europe Digital Inks Market Snapshot
Figure 24 Middle East & Africa Digital Inks Market Snapshot
Figure 25 South America Digital Inks Market Snapshot
Figure 26 Companies in the Digital Inks Market Have Adopted Organic Growth Strategies Between 2013 and 2018
Figure 27 Digital Inks Market Ranking, By Company, 2018
Figure 28 Toyo Ink SC Holdings Co.: Company Snapshot
Figure 29 Fujifilm Holdings Corporation: Company Snapshot


Growth opportunities and latent adjacency in Digital Inks Market