Cryogenic Valve Market by Gas (LNG, Oxygen, Nitrogen), Type (Globe, Gate, Ball), End-User (Energy & Power, Food, Chemicals), Application (Tanks & Cold Boxes, Transfer Lines, Manifolds & Gas Trains), And Region - Global Forecast to 2023


[126 Pages Report] The global cryogenic valve market was valued at USD 2.89 Billion in 2017 and is projected to reach at USD 3.75 Billion by 2023, at a CAGR of 4.51% during the forecast period. Rising LNG trade and increasing demand for industrial gases are the major factors driving the market of cryogenic valve.
The years considered for the study are as follows:
- Base Year: 2017
- Estimated Year: 2018
- Projected Year: 2023
- Forecast Period: From 2018 to 2023
The base year considered for company profiles is 2017. Whenever information was unavailable for the base year, the prior year has been considered.
Objectives of the Study
- To define, describe, and forecast the global cryogenic valve market on the basis of type, application, gas, end-user, and region
- To provide detailed information on major factors influencing the growth of the cryogenic valves market (drivers, restraints, opportunities, and industry-specific challenges)
- To strategically analyze the cryogenic valves market with respect to individual growth trends, future prospects, and contribution of each segment to the market
- To analyze market opportunities for stakeholders and details of a competitive landscape for market leaders
- To strategically profile key players and comprehensively analyze their market rankings and core competencies
- To track and analyze competitive developments, such as acquisitions, contracts & agreements, and new product developments in the cryogenic valves market
Research Methodology
This research study involved the use of extensive secondary sources, directories, and databases, such as Hoover�s, Bloomberg BusinessWeek, Factiva, and OneSource, to identify and collect information useful for a technical, market-oriented, and commercial study of the global cryogenic Valves market. Primary sources are mainly industry experts from core and related industries, OEMs, vendors, suppliers, technology developers, alliances, and organizations related to all the segments of this industry�s value chain. The points given below explain the research methodology.
- Study of the annual revenue and market developments of the major players providing cryogenic valves
- Analysis of demand for cryogenic valves by end-users
- Assessment of future trends and growth of end-users in the cryogenic valve market
- Assessment of the cryogenic valves market with respect to various types
- Study of market trends in various regions and countries, by end-users in the cryogenic valve market
- Study of contracts and developments by key players across different regions in the cryogenic valve market
- Finalization of overall market sizes by triangulating the supply-side data, which includes product developments and annual revenues of companies supplying cryogenic valves across the globe
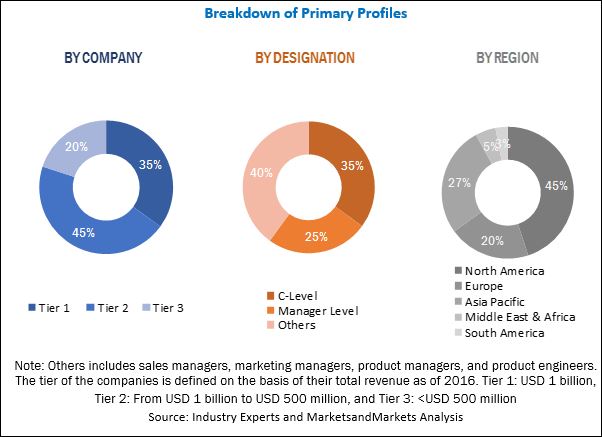
After arriving at the overall market size, the total market has been split into several segments and subsegments. The figure given below illustrates the breakdown of primaries conducted during the research study on the basis of company type, designation, and region.
To know about the assumptions considered for the study, download the pdf brochure
Market Ecosystem:
The cryogenic valves ecosystem comprises equipment manufacturers, such as, Flowserve (US), Herose (Germany), Emerson (US), L&T (India), Schlumberger (US), Samson (Germany), Cryocomp (US), Habonim (Israel), Parker (US), Bray (US), Velan (Canada), Weir Group (Scotland), Powell Valves (US), and BAC (Spain).
Target Audience:
The target audience of this report includes:
- Cryogenic equipment manufacturers, dealers, and suppliers
- LNG plant developers and service providers
- LNG dealers
- Cryogenic equipment Manufacturers� associations
- Oil & gas companies
- Power and energy associations
Scope of the Report:
- By Application
- Tanks & Cold Boxes
- Liquefiers
- Transfer lines
- Manifolds & Gas Trains
- By Type
- Globe Valve
- Gate Valve
- Check Valve
- Ball Valve
- Others
- By Gas
- LNG
- Oxygen
- Nitrogen
- Others
- By End-User
- Energy & Power
- Chemicals
- Food & Beverage
- Healthcare
- Others
- By Region
- North America
- Europe
- Asia Pacific
- Middle East & Africa
- South America
Available Customizations:
With the given market data, MarketsandMarkets offers customizations as per the client�s specific needs. The following customization options are available for this report:
Regional Analysis
Further breakdown of region or country-specific analysis
Company Information
Detailed analysis and profiling of additional market players (up to five)
The global cryogenic valve market is projected to grow at a CAGR of 4.51%, to reach a market size of USD 3.75 Billion by 2023 from USD 3.00 Billion in 2018. Rising trade of LNG and high demand for industrial gases are the major factors driving the cryogenic valve market. The rising LNG trade has led to the growing demand for storage and transportation of cryogenic gases, which in turn has boosted the demand for cryogenic valves.
The report segments the cryogenic valve market, by gas, into LNG, nitrogen, oxygen, and others. The others segment includes argon, hydrogen, helium, and carbon dioxide. The LNG subsegment held the largest market in 2017 and is expected to grow at the fastest CAGR from 2018 to 2023.
Based on the type, the cryogenic valve market is segmented into ball valve, globe valve, gate valve, check valve, and others. The others segment includes control valves, safety valves, butterfly valves, and angle valves. The ball valve subsegment led the cryogenic valve market in 2017. The features of ball valves, such as high flow rate and easy operation compared to other valve types, have resulted in the largest share of the ball valve segment in the cryogenic valve market., Moreover, these valves are designed accordingly and are used in transportation, liquefied gas production, and storage applications.
Based on application, the cryogenic valve market is segmented into transfer lines, tanks & cold boxes, manifolds & gas trains, and liquefiers. The transfer lines subsegment held the largest market share in 2017 and is projected to dominate the market during the forecast period. The growing production and demand for liquefied gases is likely to drive the market for cryogenic valves, globally.
Based on the end-user segment, the cryogenic valve market is segmented into energy & power, chemicals, food & beverage, healthcare, and others. The energy & power subsegment led the cryogenic valve market in 2017 and is projected to dominate the market during the forecast period. The increasing LNG demand for power generation applications has led to the largest share of the energy & power segment in 2018.
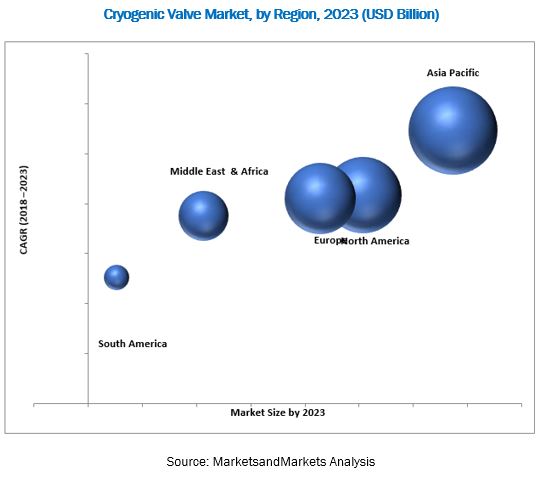
In this report, the cryogenic valve market has been analyzed with respect to five regions, namely, Asia Pacific, Europe, North America, the Middle East & Africa, and South America. The market in Asia Pacific is expected to lead the global cryogenic valve market during the forecast period due to the substantial growth in end-user industries, such as chemicals, electronics, metallurgy, and food & beverage in the region.
High demand from the chemical industry and increase in the energy demand can lead to opportunities in the cryogenic valve market. Volatile metal price can act as a restraint for the cryogenic valve market, leading to declining profits.
Some of the leading players in the cryogenic valve market include Schlumberger (US), Emerson (US), Parker (US), Flowserve (US), and Weir Group (Scotland). Contracts & agreements and acquisitions were the most adopted strategies by players to ensure their dominance in the cryogenic valve market.
To speak to our analyst for a discussion on the above findings, click Speak to Analyst
 Exclusive indicates content/data unique to MarketsandMarkets and not available with any competitors.
Table of Contents
1 Introduction (Page No. - 15)
1.1 Objectives of the Study
1.2 Definition
1.3 Market Scope
1.3.1 Market Segmentation
1.3.2 Regional Scope
1.4 Years Considered for the Study
1.5 Currency
1.6 Stakeholders
2 Research Methodology (Page No. - 19)
2.1 Research Data
2.1.1 Secondary Data
2.1.1.1 Secondary Sources
2.1.2 Primary Data
2.1.2.1 Key Data From Primary Sources
2.1.2.2 Breakdown of Primaries
2.2 Market Size Estimation
2.2.1 Bottom-Up Approach
2.2.2 Top-Down Approach
2.3 Market Breakdown & Data Triangulation
2.4 Research Assumptions
2.5 Limitations
3 Executive Summary (Page No. - 27)
4 Premium Insights (Page No. - 31)
4.1 Attractive Opportunities in the Cryogenic Valve Market During the Forecast Period
4.2 Cryogenic Valve Market, By Application
4.3 Market, By Type
4.4 Market, By End-User
4.5 Market, By Gas
5 Market Overview (Page No. - 34)
5.1 Introduction
5.2 Market Dynamics
5.2.1 Drivers
5.2.1.1 Rising Trade for LNG
5.2.1.2 High Demand for Industrial Gases
5.2.1.3 Increasing Demand for More Fpso and Fsru
5.2.2 Restraints
5.2.2.1 Volatile Metal Prices Increase the Production Cost
5.2.3 Opportunities
5.2.3.1 High Demand From the Chemical Industry
5.2.3.2 Increase in the Energy Demand
5.2.4 Challenges
5.2.4.1 Operational Safety Associated With Liquid Gases
5.2.4.2 High Operation and Maintenance Cost
6 Cryogenic Valve Market, By End-User (Page No. - 39)
6.1 Introduction
6.2 Energy & Power
6.3 Chemicals
6.4 Food & Beverage
6.5 Healthcare
6.6 Others
7 Cryogenic Valve Market, By Gas (Page No. - 45)
7.1 Introduction
7.2 Liquefied Natural Gas (LNG)
7.3 Nitrogen
7.4 Oxygen
7.5 Others
8 Cryogenic Valve Market, By Type (Page No. - 51)
8.1 Introduction
8.2 Ball Valve
8.3 Globe Valve
8.4 Gate Valve
8.5 Check Valve
8.6 Others
9 Cryogenic Valve Market, By Application (Page No. - 57)
9.1 Introduction
9.2 Transfer Lines
9.3 Tanks & Cold Boxes
9.4 Manifolds & Gas Trains
9.5 Liquefiers
10 Cryogenic Valve Market, By Region (Page No. - 63)
10.1 Introduction
10.2 North America
10.2.1 By Gas
10.2.2 By End-User
10.2.3 By Type
10.2.4 By Application
10.2.5 By Country
10.2.5.1 Us
10.2.5.2 Canada
10.2.5.3 Mexico
10.3 Asia Pacific
10.3.1 By Gas
10.3.2 By End-User
10.3.3 By Type
10.3.4 By Application
10.3.5 By Country
10.3.5.1 China
10.3.5.2 India
10.3.5.3 Australia
10.3.5.4 South Korea
10.3.5.5 Japan
10.3.5.6 Rest of Asia Pacific
10.4 Europe
10.4.1 By Gas
10.4.2 By End-User
10.4.3 By Type
10.4.4 By Application
10.4.5 By Country
10.4.5.1 Russia
10.4.5.2 Germany
10.4.5.3 UK
10.4.5.4 France
10.4.5.5 Italy
10.4.5.6 Rest of Europe
10.5 Middle East & Africa
10.5.1 By Gas
10.5.2 By End-User
10.5.3 By Type
10.5.4 By Application
10.5.5 By Country
10.5.5.1 Qatar
10.5.5.2 Saudi Arabia
10.5.5.3 UAE
10.5.5.4 South Africa
10.5.5.5 Rest of Middle East & Africa
10.6 South America
10.6.1 By Gas
10.6.2 By End-User
10.6.3 By Type
10.6.4 By Application
10.6.5 By Country
10.6.5.1 Brazil
10.6.5.2 Argentina
10.6.5.3 Rest of South America
11 Competitive Landscape (Page No. - 94)
11.1 Overview
11.2 Ranking of Players & Industry Concentration, 2016
11.3 Competitive Scenario
11.3.1 Acquisitions
11.3.2 Contracts & Agreements
11.3.3 New Product Launches
12 Company Profiles (Page No. - 98)
(Business Overview, Products Offered, Recent Developments and MnM View)
12.1 Benchmarking
12.2 BAC
12.3 Bray
12.4 Cryocomp
12.5 Emerson
12.6 Flowserve
12.7 Habonim
12.8 Herose
12.9 L&T
12.10 Parker
12.11 Powell Valves
12.12 Samson
12.13 Schlumberger
12.14 Velan
12.15 Weir Group
*Details on Business Overview, Products Offered, Recent Developments and MnM View Might Not Be Captured in Case of Unlisted Companies.
13 Appendix (Page No. - 119)
13.1 Insights of Industry Experts
13.2 Discussion Guide
13.3 Knowledge Store: Marketsandmarkets� Subscription Portal
13.4 Introducing RT: Real Time Market Intelligence
13.5 Available Customizations
13.6 Related Reports
13.7 Author Details
List of Tables (73 Tables)
Table 1 Cryogenic Valve Market Snapshot
Table 2 Cryogenic Valve Market Size, By End-User, 2016�2023 (USD Million)
Table 3 Energy & Power: Cryogenic Valve Market Size, By Region, 2016�2023 (USD Million)
Table 4 Chemicals: Cryogenic Valve Market Size, By Region, 2016�2023 (USD Million)
Table 5 Food & Beverage: Market Size, By Region, 2016�2023 (USD Million)
Table 6 Healthcare: Market Size, By Region, 2016�2023 (USD Million)
Table 7 Others: Cryogenic Valve Market Size, By Region, 2016�2023 (USD Million)
Table 8 Cryogenic Valve Market Size, By Gas, 2016�2023 (USD Million)
Table 9 LNG: Cryogenic Valve Market Size, By Region, 2016�2023 (USD Million)
Table 10 Nitrogen: Market Size, By Region, 2016�2023 (USD Million)
Table 11 Oxygen: Market Size, By Region, 2016�2023 (USD Million)
Table 12 Others: Market Size, By Region, 2016�2023 (USD Million)
Table 13 Cryogenic Valve Market Size, By Type, 2016�2023 (USD Million)
Table 14 Ball Valve: Cryogenic Valves Market Size, By Region, 2016�2023 (USD Million)
Table 15 Globe Valve: Cryogenic Valves Market Size, By Region, 2016�2023 (USD Million)
Table 16 Gate Valve: Cryogenic Valve Market Size, By Region, 2016�2023 (USD Million)
Table 17 Check Valve: Cryogenic Valves Market Size, By Region, 2016�2023 (USD Million)
Table 18 Others: Cryogenic Valves Market Size, By Region, 2016�2023 (USD Million)
Table 19 Market Size, By Application, 2016�2023 (USD Million)
Table 20 Transfer Lines: Market Size, By Region, 2016�2023 (USD Million)
Table 21 Tanks & Cold Boxes: Market Size, By Region, 2016�2023 (USD Million)
Table 22 Manifolds & Gas Trains: Market Size, By Region, 2016�2023 (USD Million)
Table 23 Liquefiers: Market Size, By Region, 2016�2023 (USD Million)
Table 24 Market, By Region, 2016�2023 (USD Million)
Table 25 North America: Market Size, By Gas, 2016�2023 (USD Million)
Table 26 North America: Market Size, By End-User, 2016�2023 (USD Million)
Table 27 North America: Market Size, By Type, 2016�2023 (USD Million)
Table 28 North America: Market Size, By Application, 2016�2023 (USD Million)
Table 29 North America: Market Size, By Country, 2016�2023 (USD Million)
Table 30 US: Market Size, By Gas, 2016�2023 (USD Million)
Table 31 Canada: Market Size, By Gas, 2016�2023 (USD Million)
Table 32 Mexico: Market Size, By Gas, 2016�2023 (USD Million)
Table 33 Asia Pacific: Market Size, By Gas, 2016�2023 (USD Million)
Table 34 Asia Pacific: Market Size, By End-User, 2016�2023 (USD Million)
Table 35 Asia Pacific: Market Size, By Type, 2016�2023 (USD Million)
Table 36 Asia Pacific: Market Size, By Application, 2016�2023 (USD Million)
Table 37 Asia Pacific: Market Size, By Country, 2016�2023 (USD Million)
Table 38 China: Market Size, By Gas, 2016�2023 (USD Million)
Table 39 India: Market Size, By Gas, 2016�2023 (USD Million)
Table 40 Australia: Market Size, By Gas, 2016�2023 (USD Million)
Table 41 South Korea: Market Size, By Gas, 2016�2023 (USD Million)
Table 42 Japan: Market Size, By Gas, 2016�2023 (USD Million)
Table 43 Rest of Asia Pacific: Market Size, By Gas, 2016�2023 (USD Million)
Table 44 Europe: Market Size, By Gas, 2016�2023 (USD Million)
Table 45 Europe: Market Size, By End-User, 2016�2023 (USD Million)
Table 46 Europe: Market Size, By Type, 2016�2023 (USD Million)
Table 47 Europe: Market Size, By Application, 2016�2023 (USD Million)
Table 48 Europe: Market Size, By Country, 2016�2023 (USD Million)
Table 49 Russia: Market Size, By Gas, 2016�2023 (USD Million)
Table 50 Germany: Market Size, By Gas, 2016�2023 (USD Million)
Table 51 UK: Market Size, By Gas, 2016�2023 (USD Million)
Table 52 France: Market Size, By Gas, 2016�2023 (USD Million)
Table 53 Italy: Market Size, By Gas, 2016�2023 (USD Million)
Table 54 Rest of Europe: Market Size, By Gas, 2016�2023 (USD Million)
Table 55 Middle East & Africa: Market Size, By Gas, 2016�2023 (USD Million)
Table 56 Middle East & Africa: Market Size, By End-User, 2016�2023 (USD Million)
Table 57 Middle East & Africa: Market Size, By Type, 2016�2023 (USD Million)
Table 58 Middle East & Africa: Market Size, By Application, 2016�2023 (USD Million)
Table 59 Middle East & Africa: Market Size, By Country, 2016�2023 (USD Million)
Table 60 Qatar: Market Size, By Gas, 2016�2023 (USD Million)
Table 61 Saudi Arabia: Market Size, By Gas, 2016�2023 (USD Million)
Table 62 UAE: Market Size, By Gas, 2016�2023 (USD Million)
Table 63 South Africa: Market Size, By Gas, 2016�2023 (USD Million)
Table 64 Rest of Middle East & Africa: Market Size, By Gas, 2016�2023 (USD Million)
Table 65 South America: Market Size, By Gas, 2016�2023 (USD Million)
Table 66 South America: Market Size, By End-User, 2016�2023 (USD Million)
Table 67 South America: Market Size, By Type, 2016�2023 (USD Million)
Table 68 South America: Market Size, By Application, 2016�2023 (USD Million)
Table 69 South America: Market Size, By Country, 2016�2023 (USD Million)
Table 70 Brazil: Market Size, By Gas, 2016�2023 (USD Million)
Table 71 Argentina: Market Size, By Gas, 2016�2023 (USD Million)
Table 72 Rest of South America: Market Size, By Gas, 2016�2023 (USD Million)
Table 73 Parker, the Most Active Player in the Market, 2015�2018
List of Figures (35 Figures)
Figure 1 Research Design
Figure 2 Breakdown of Primaries: By Company Type, Designation, & Region
Figure 3 Bottom-Up Approach
Figure 4 Top-Down Approach
Figure 5 Data Triangulation Methodology
Figure 6 Assumptions of the Research Study
Figure 7 LNG Segment is Expected to Lead the Market, By Gas, During the Forecast Period
Figure 8 Energy & Power Segment is Expected to Lead the Market, By End-User, During the Forecast Period
Figure 9 Transfer Lines Segment is Expected to Lead the Market, By Application During the Forecast Period
Figure 10 Asia Pacific is Expected to Dominate the Cryogenic Valves Market During the Forecasted Period
Figure 11 Increasing LNG Production is Expected to Drive the Market, 2018�2023
Figure 12 Transfer Lines Segment is Estimated to Lead the Cryogenic Valve Market, 2018�2023
Figure 13 Ball Valve Segment Led the Market in 2017
Figure 14 Energy & Power Segment Led the Cryogenic Valve Market in 2017
Figure 15 LNG Segment is Expected to Lead the Market During Forecast Period
Figure 16 Asia Pacific Led the Cryogenic Valve Market in 2017
Figure 17 Natural Gas: Consumption in Billion Cubic Meters By Region, 2006�2016
Figure 18 Natural Gas: Production in Billion Cubic Feet By Region, 2006�2016
Figure 19 Energy & Power Segment Held the Largest Share in 2017
Figure 20 LNG Segment is Expected to Hold the Largest Market Among Cryogenic Gases By 2023
Figure 21 Ball Valve Segment is Expected to Hold the Largest Market Among Cryogenic Type By 2023
Figure 22 Transfer Lines Segment Held the Largest Share in 2017
Figure 23 Asia Pacific Led the Market in 2017
Figure 24 Asia Pacific is Expected to Grow at the Highest CAGR During the Forecast Period
Figure 25 North America, Market Snapshot
Figure 26 Asia Pacific: Market Snapshot
Figure 27 Key Developments in the Market, 2015�2018
Figure 28 Cameron-Schlumberger Led the Market in 2017
Figure 29 Emerson: Company Snapshot
Figure 30 Flowserve: Company Snapshot
Figure 31 L&T: Company Snapshot
Figure 32 Parker: Company Snapshot
Figure 33 Schlumberger: Company Snapshot
Figure 34 Velan: Company Snapshot
Figure 35 Weir Group: Company Snapshot


Growth opportunities and latent adjacency in Cryogenic Valve Market