Complex Event Processing Market by Application (Fraud detection, Algorithmic Trading, Dynamic pre-trade analytics), Service (Consulting, Installation and Maintenance), Deployment, Vertical, User type, Region - Global Forecast to 2020


[160 Pages Report] The Complex Event Processing market is estimated to grow from USD 1.28 Billion in 2015 to USD 4.95 Billion by 2020 with a compound annual growth rate (CAGR) of 31.1%.
The report on the CEP market considered 2014 as the base year and the forecast period from 2015 to 2020. CEP tools aims at integrating data from diverse sources, apply analytics on the data, and respond in real-time. The CEP tools benefits end-users through improved automation of business processes, and executing them in compliance with business and government policies. The report aims at estimating the market size and future growth opportunities of the CEP market across different segments, such as applications, deployment models, service types, user-types, industries, and regions.
Major players in the CEP were identified across various regions along with their offerings and distribution channel; regional presence is understood through in-depth discussions. Also, average revenue generated by these companies, segmented on the basis of regions, was employed to arrive at the overall Complex Event Processing market size. This overall market size is used in the top-down procedure to estimate the sizes of other individual markets (applications and services) via percentage splits from secondary and primary research. The entire procedure includes the study of the annual and financial reports of the top market players and extensive interviews of industry leaders, such as CEOs, VPs, directors, and marketing executives for key insights.
All percentage shares, splits, and breakdowns were determined using secondary sources and verified through primary sources. All possible parameters that affect the market, covered in this research study, have been accounted for, viewed in extensive detail, verified through primary research, and analyzed to get the final quantitative and qualitative data. This data is consolidated and added with detailed inputs and analysis from MarketsandMarkets and presented in this report.
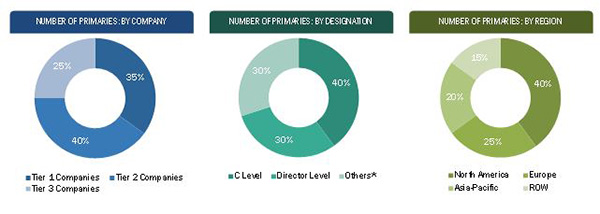
The breakdown of profiles of primary is depicted in the below figure:
The CEP applications are being increasingly adopted by companies and organizations in various industry verticals, such as Banking, Financial Services and Insurance (BFSI); transportation and logistics; healthcare; IT and telecommunication; retail; energy and utilities; manufacturing; government, aerospace, and defense among others. BFSI is expected to dominate the CEP industry market, contributing the largest market share during the forecast period. Manufacturing Industry is expected to have highest growth rate among other industry ecosystem during the forecast period.
CEP comprises CEP application vendors, such as IBM, SAP, Oracle, TIBCO, Informatica, SAS Institute, Informatica, WSO2, Nastel Technologies, Red Hat, Software AG, and EsperTech. The stakeholders of the CEP include Database Administrators, Database Developers, Application Developers, System Design and Development Vendors, High Level Business Decision Makers, Cloud Service Providers, and Training and Education Service Providers.
In the Complex Event Processing market, currently, on-premise CEP is the highest contributor than cloud-based CEP but the latter is expected to surpass in the next five years due to high adoption rate of cloud technologies. Organizations and Institutes in BFSI sector are expected to show increased demand for CEP applications and services.
Scope of the Report:
The Complex Event Processing market is a broad study of the global market and forecasts the market sizes and trends in the following sub-segments.
By Application:
- Algorithmic Trading
- Electronic Transaction Monitoring
- Dynamic Pre-Trae Analytics
- Data Enrichment
- Fraud Detection
- Governance, Risk and Compliance
- Asset Management and Predictive Scheduling
- Geo-fencing and Geospatial analysis
- Others
By Deployment:
- Cloud
- On-Premise
By service Type:
- Consulting
- Installation and Maintenance
- Training and Support
- Managed Services
By Region:
- North America
- Europe
- Asia Pacific (APAC)
- Middle East and Africa (MEA)
- Latin America
As a part of customization MarketsandMarkets can provide the following details:-
Product Analysis
- Product Matrix, which gives a detailed comparison of product portfolio of each company
Geographic Analysis
- Further breakdown of the North America CEP market into Mexico and Canada
- Further breakdown of the Europe CEP market into the U.K, Germany, Spain, and others
- Further breakdown of the APAC CEP market into India, China, Australia, and others
Company Information
- Detailed analysis and profiling of additional market players (Up to 5)
MarketsandMarkets forecast the Complex Event Processing market size to grow from USD 1.28 Billion in 2015 to USD 4.95 Billion by 2020, at a compound annual growth rate (CAGR) of 31.1%. The adoption of device based computing and potential growth in demand for enterprise data worldwide are the main drivers of the CEP market.
Presently, on-premise based deployment of CEP has the larger share than the cloud-based deployment of CEP but the latter deployment model is expected to surpass during the forecast period due to high adoption rate of cloud technologies. The Large enterprises and Small and medium enterprises (SMEs) are showing high interest in the cloud-based CEP applications due to its multiple advantages such as low operational expense, easy deployment, scalability, and easy collaboration. Moreover, due to the rise in mobile workforce and number of smartphone users, major players aim at providing handy and easily accessible applications. The ongoing globalization of companies and the continuous rise in content among organizations have led the organizations to enable the consolidation of business-critical data through a single point provided through CEP applications. Likewise, with the increasing complexity pertaining to maintaining and managing this data, organizations are widely considering cloud-based deployments for implementing the central repository for their master data.
The managed services segment is expected to have the largest market share and highest CAGR during the forecast period.
The CEP applications are being increasingly adopted by companies and organizations in various industry verticals such as Banking, Financial Services and Insurance (BFSI); transportation and logistics; healthcare; IT and telecommunication; retail; energy and utilities; manufacturing; government; and aerospace and defense among others. BFSI is expected to dominate the CEP industry market, contributing the largest market share, during the forecast period.
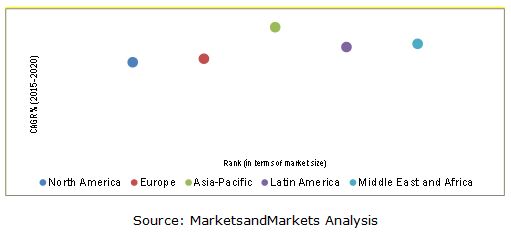
North America is expected to have the largest market share and would dominate the Complex Event Processing market from 2015 to 2020. Asia-pacific (APAC) offers potential growth opportunities, as companies in the APAC region are turning toward CEP application providers to offer a high degree of services in terms of quality, performance, and capacity.
However, the diversified governmental regulations and policies present across domestic and international borders are restraining the growth of the CEP market. The key players in the Complex Event Processing market are IBM Corporation, SAP SE, Oracle Corporation, TIBCO Software Inc., SAS Insitute, Inc., Informatica Corporation, WSO2, Inc., Nastel Technologies, Inc., Red Hat, Inc., Software AG, and EsperTech, Inc. These major players also launched new products and offerings to strengthen their product portfolio and to expand their offerings to new clients. These players adopted various strategies, such as new product developments, mergers, partnerships, collaborations, and business expansion to cater to the needs of the CEP market.
 Exclusive indicates content/data unique to MarketsandMarkets and not available with any competitors.
Table of Contents
1 Introduction (Page No. - 13)
1.1 Objectives of the Study
1.2 Market Definition
1.3 Market Scope
1.3.1 Markets Covered
1.3.2 Years Considered for the Study
1.4 Currency
1.5 Limitations
1.6 Stakeholders
2 Research Methodology (Page No. - 16)
2.1 Research Data
2.1.1 Secondary Data
2.1.2 Primary Data
2.2 Market Size Estimation
2.2.1 Bottom-Up Approach
2.2.2 Top Down Approach
2.3 Market Breakdown and Data Triangulation
2.4 Assumptions
3 Executive Summary (Page No. - 25)
4 Premium Insights (Page No. - 31)
4.1 Attractive Market Opportunities in the Complex Event Processing Market
4.2 CEP Market: Top Three Applications
4.3 CEP Market: Top Three Applications and Regions
4.4 Global CEP Market Vertical, By Region (2020)
4.5 Global CEP Market, By Region(2015)
4.6 Product Growth Matrix
4.7 Life Cycle Analysis, By Region, 2015
5 Market Overview (Page No. - 36)
5.1 Introduction
5.2 Evolution
5.3 Market Segmentation
5.3.1 By Application
5.3.2 By Vertical
5.3.3 By Service
5.3.4 By User Type
5.3.5 By Deployment Type
5.3.6 By Region
5.4 Market Dynamics
5.4.1 Drivers
5.4.2 Restraints
5.4.3 Opportunities
5.4.4 Challenges
6 Complex Event Processing Market: Industry Trends (Page No. - 47)
6.1 Introduction
6.2 CEP Architecture
6.3 Value Chain Analysis
6.4 Porter�s Five Forces Analysis
6.4.1 Threat of New Entrants
6.4.2 Threat of Substitutes
6.4.3 Bargaining Power of Suppliers
6.4.4 Bargaining Power of Buyers
6.4.5 Intensity of Competitive Rivalry
6.5 Industry Standards and Regulations
6.5.1 Introduction
6.5.2 Gramm-Leach-Bliley Act (GLBA)
6.5.3 Health Insurance Portability and Accountability Act (HIPAA)
6.5.4 Payment Card Industry Data Security Standard (PCI DSS)
6.6 Innovation Spotlight
7 Complex Event Processing Market Analysis, By Application (Page No. - 56)
7.1 Introduction
7.2 Algorithmic Trading
7.3 Electronic Transaction Monitoring
7.4 Dynamic Pre‐Trade Analytics
7.5 Data Enrichment
7.6 Fraud Detection
7.7 Governance, Risk, and Compliance (GRC)
7.8 Asset Management and Predictive Scheduling
7.9 Geo-Fencing and Geospatial Analysis
7.10 Others
8 Complex Event Processing Market Analysis, By Deployment Model (Page No. - 68)
8.1 Introduction
8.2 Cloud
8.3 On-Premise
9 Complex Event Processing Market Analysis, By Service Type (Page No. - 73)
9.1 Introduction
9.2 Consulting
9.3 Installation and Maintenance
9.4 Training and Support
9.5 Managed Services
10 Complex Event Processing Market Analysis, By User Type (Page No. - 79)
10.1 Introduction
10.2 Small and Medium Enterprise (SME)
10.3 Large Enterprise
11 Complex Event Processing Market Analysis, By Vertical (Page No. - 83)
11.1 Introduction
11.2 Banking, Financial Services, and Insurance (BFSI)
11.3 Transportation and Logistics
11.4 Healthcare
11.5 IT and Telecommunication
11.6 Retail
11.7 Energy and Utilities
11.8 Manufacturing
11.9 Government and Aerospace & Defense
11.10 Others
12 Geographic Analysis (Page No. - 93)
12.1 Introduction
12.2 North America
12.3 Europe
12.4 Asia-Pacific (APAC)
12.5 Middle East and Africa (MEA)
12.6 Latin America
13 Competitive Landscape (Page No. - 115)
13.1 Overview
13.2 Competitive Situations and Trends
13.2.1 Agreements, Partnerships, Collaborations, Joint Ventures, and Business Expansions
13.2.2 New Product Launches
13.2.3 Mergers and Acquisitions
13.2.4 Venture Capital Funding
14 Company Profiles (Page No. - 125)
(Overview, Products & Services, Strategies & Insights, Developments and MnM View)*
14.1 Introduction
14.2 International Business Machines Corporation
14.3 SAP SE
14.4 Oracle Corporation
14.5 Tibco Software Inc.
14.6 SAS Institute, Inc.
14.7 Informatica Corporation
14.8 WSO2, Inc.
14.9 Nastel Technologies, Inc.
14.10 Red Hat, Inc.
14.11 Software AG
14.12 Espertech, Inc.
*Details on Overview, Products & Services, Strategies & Insights, Developments and MnM View Might Not Be Captured in Case of Unlisted Companies.
15 Appendix (Page No. - 153)
15.1 Insights From Industry Experts
15.2 Discussion Guide
15.3 Available Customizations
15.4 Related Reports
List of Tables (70 Tables)
Table 1 Global Complex Event Processing Market Size and Growth, 2013�2020 (USD Billion, Y-O-Y %)
Table 2 Global CEP Market Size, By Component, 2013�2020 (USD Million)
Table 3 Global CEP Market Size, By Application, 2013�2020 (USD Million)
Table 4 Applications: CEP Market Size, By Region, 2013�2020 (USD Million)
Table 5 Algorithmic Trading: CEP Market Size, By Region, 2013�2020 (USD Million)
Table 6 Electronic Transaction Monitoring: CEP Market Size, By Region, 2013�2020 (USD Million)
Table 7 Dynamic Pre-Trade Analytics: CEP Market Size, By Region, 2013�2020 (USD Million)
Table 8 Data Enrichment: CEP Market Size, By Region, 2013�2020 (USD Million)
Table 9 Fraud Detection: CEP Market Size, By Region, 2013�2020 (USD Million)
Table 10 Governance, Risk, and Compliance : CEP Market Size, By Region, 2013�2020 (USD Million)
Table 11 Asset Management and Predictive Scheduling: CEP Market Size, By Region, 2013�2020 (USD Million)
Table 12 Geo-Fencing and Geospatial Analysis : CEP Market Size, By Region, 2013�2020 (USD Million)
Table 13 Others: CEP Market Size, By Region, 2013�2020 (USD Million)
Table 14 Global Complex Event Processing Market Size, By Deployment Model, 2013�2020 (USD Million)
Table 15 Cloud-Based Deployment: CEP Market Size, By Region, 2013�2020 (USD Million)
Table 16 On-Premise:CEPmarketsize, By Region, 2013�2020 (USD Million)
Table 17 Global CEP Market Size, By Service Type, 2013�2020 (USD Million)
Table 18 Service Type: CEP Market Size, By Region, 2013�2020 (USD Million)
Table 19 Consulting: CEP Market Size, By Region, 2013�2020 (USD Million)
Table 20 Installation and Maintenance: CEP Market Size, By Region, 2013�2020 (USD Million)
Table 21 Training and Support: CEP Market Size, By Region, 2013�2020 (USD Million)
Table 22 Managed Services: CEP Market Size, By Region, 2013�2020 (USD Million)
Table 23 Global CEP Market Size, By User Type, 2013�2020 (USD Million)
Table 24 SME: CEP Market Size, By Region, 2013�2020 (USD Million)
Table 25 Large Enterprise: CEP Market Size, By Region, 2013�2020 (USD Million)
Table 26 Global Complex Event Processing Market Size, By Vertical, 2013�2020 (USD Million)
Table 27 BFSI: CEP Market Size, By Region, 2013�2020 (USD Million)
Table 28 Transportation and Logistics: CEP Market Size, By Region, 2013�2020 (USD Million)
Table 29 Healthcare: CEP Market Size, By Region, 2013�2020 (USD Million)
Table 30 IT and Telecommunication: CEP Market Size, By Region, 2013�2020 (USD Million)
Table 31 Retail: CEP Market Size, By Region, 2013�2020 (USD Million)
Table 32 Energy and Utilities: CEP Market Size, By Region, 2013�2020 (USD Million)
Table 33 Manufacturing: CEP Market Size, By Region, 2013�2020 (USD Million)
Table 34 Government and Aerospace & Defense: CEP Market Size, By Region, 2013�2020 (USD Million)
Table 35 Others: CEP Market Size, By Region, 2013�2020 (USD Million)
Table 36 Global Complex Event Processing Market Size, By Region, 2013�2020 (USD Million)
Table 37 North America: CEP Market Size, By Component, 2013�2020 (USD Million)
Table 38 North America: CEP Market Size, By Application, 2013�2020 (USD Million)
Table 39 North America: CEP Market Size, By Deployment Model, 2013�2020 (USD Million)
Table 40 North America: CEP Market Size, By Service Type, 2013�2020 (USD Million)
Table 41 North America: CEP Market Size, By User Type, 2013�2020 (USD Million)
Table 42 North America: CEP Market Size, By Vertical, 2013�2020 (USD Million)
Table 43 Europe: CEP Market Size, By Component, 2013�2020 (USD Million)
Table 44 Europe: CEP Application Market Size, By Application, 2013�2020 (USD Million)
Table 45 Europe: CEP Market Size, By Deployment Model, 2013�2020 (USD Million)
Table 46 Europe: CEP Market Size, By Service Type, 2013�2020 (USD Million)
Table 47 Europe: CEP Market Size, By User Type, 2013�2020 (USD Million)
Table 48 Europe: CEP Market Size, By Vertical, 2013�2020 (USD Million)
Table 49 Asia-Pacific: CEP Market Size, By Component, 2013�2020 (USD Million)
Table 50 Asia-Pacific: CEP Market Size, By Application, 2013�2020 (USD Million)
Table 51 Asia-Pacific: CEP Market Size, By Deployment Model, 2013�2020 (USD Million)
Table 52 Asia-Pacific: CEP Market Size, By User Type, 2013�2020 (USD Million)
Table 53 Asia-Pacific: CEP Market Size, By Service Type, 2013�2020 (USD Million)
Table 54 Asia-Pacific: CEP Market Size, By Vertical, 2013�2020 (USD Million)
Table 55 Middle East and Africa: CEP Market Size, By Component, 2013�2020 (USD Million)
Table 56 Middle East and Africa: CEP Market Size, By Application, 2013�2020 (USD Million)
Table 57 Middle East and Africa: CEP Market Size, By Deployment Model, 2013-2020 (USD Million)
Table 58 Middle East and Africa: CEP Market Size, By User Type, 2013�2020 (USD Million)
Table 59 Middle East and Africa: CEP Market Size, By Service Type, 2013�2020 (USD Million)
Table 60 Middle East and Africa: CEP Market Size, By Vertical, 2013�2020 (USD Million)
Table 61 Latin America: CEP Market Size, By Component, 2013�2020 (USD Million)
Table 62 Latin America: CEP Market Size, By Application, 2013�2020 (USD Million)
Table 63 Latin America: CEP Application Market Size, By Deployment Model, 2013�2020 (USD Million)
Table 64 Latin America: CEP Application Market Size, By User Type, 2013�2020 (USD Million)
Table 65 Latin America: CEP Market Size, By Service Type, 2013�2020 (USD Million)
Table 66 Latin America: CEP Market Size, By Vertical, 2013�2020 (USD Million)
Table 67 Agreements, Partnerships, Collaborations, Joint Ventures, and Business Expansions, 2012�2015
Table 68 New Product Launches, 2012�2015
Table 69 Mergers and Acquisitions, 2012�2015
Table 70 VC Funding, 2012�2015
List of Figures (60 Figures)
Figure 1 Global Complex Event Processing Market: Research Design
Figure 2 Market Size Estimation Methodology: Bottom-Up Approach
Figure 3 Market Size Estimation Methodology: Top-Down Approach
Figure 4 Market Breakdown and Data Triangulation
Figure 5 Global CEP Market, By Application (2015 vs 2020)
Figure 6 Global CEP Market, By Service (2015 -2020)
Figure 7 Global CEP Market, By Vertical (2015-2020)
Figure 8 Global CEP Market Share: North America is Expected to Hold the Largest Market Share in 2015
Figure 9 Emerging Economies Would Offer Attractive Market Opportunities in the CEP Market During the Forecast Period (2015-2020)
Figure 10 Algorithmic Trading, Fraud Detection, and Governance, Risk and Compliance are Expected to Be the Major Share Holders in the CEP Market During the Forecast Period (2015-2020)
Figure 11 North America Holds the Largest Market Share Among All the Regions in the CEP Market in 2015
Figure 12 North America is Expected to Have the Largest Market Share Across Most Verticals in 2020
Figure 13 Asia-Pacific is Expected to Grow at the Highest CAGR During the Forecast Period (2015-2020)
Figure 14 Complex Event Processing Market Growth Matrix, By Application During the Forecast Period (2015-2020)
Figure 15 Europe and Asia-Pacific are Expected to Show Exponential Growth During the Forecast Period(2015-2020)
Figure 16 Evolution of the CEP Market
Figure 17 CEP Market Segmentation: By Application
Figure 18 CEP Market Segmentation: By Vertical
Figure 19 CEP Market Segmentation: By Service
Figure 20 CEP Market Segmentation: By User Type
Figure 21 CEP Market Segmentation: By Region
Figure 22 CEP Market: Drivers, Restraints, Opportunities, and Challenges
Figure 23 CEP Architecture
Figure 24 Value Chain Analysis: Complex Event Processing Market
Figure 25 Porter�s Five Forces Analysis (2015): Availability of Substitute Vendors has Increased the Value of CEP Applications
Figure 26 Governance, Risk, and Compliance is Expected to Hold the Largest Market Share During the Forecast Period (2015-2020)
Figure 27 North America is Expected to Dominate the Application Segment During the Forecast Period (2015-2020)
Figure 28 Asia-Pacific is Expected to Grow at the Highest CAGR for Algorithmic Trading During the Forecast Period (2015-2020)
Figure 29 Asia-Pacific is Expected to Be the Fastest-Growing Region for Electronic Transaction Monitoring During the Forecast Period (2015-2020)
Figure 30 Cloud Deployment is Expected to Grow at the Highest CAGR During the Forecast Period(2015-2020)
Figure 31 Asia-Pacific is Expected to Be the Fastest-Growing Region for Cloud Deployment During the Forecast Period (2015-2020)
Figure 32 North America is Expected to Hold the Largest Market Share in On-Premise Deployment During the Forecast Period (2015-2020)
Figure 33 Managed Services Expected to Grow at the Highest CAGR During the Forecast Period (2015-2020)
Figure 34 Asia-Pacific is the Fastest-Growing Region for Managed Services in the CEP Market During the Forecast Period (2015-2020)
Figure 35 Small and Medium Enterprise is the Fastest-Growing User Type in the CEP Market During the Forecast Period (2015-2020)
Figure 36 Large Enterprise is Expected to Dominate the CEP Market During the Forecast Period (2015-2020)
Figure 37 BFSI, IT and Telecommunication, and Retail Will Continue to Dominate the CEP Market During the Forecast Period (2015-2020)
Figure 38 Geographic Snapshot: Asia-Pacific is Expected to Emerge as A New Hotspot for the CEP Market in 2020
Figure 39 Emerging Nations in Asia-Pacific Expected to Boost the Growth of the Complex Event Processing Market During the Forecast Period (2015-2020)
Figure 40 Asia-Pacific Expected to Be the Fastest-Growing Region in the CEP Market During the Forecast Period (2015-2020)
Figure 41 North America Market Snapshot
Figure 42 Governance, Risk, and Compliance Application is Expected to Have the Largest Market Size in Europe During the Forecast Period
Figure 43 Asia-Pacific Market Snapshot
Figure 44 Companies Adopted New Product Launches as the Key Growth Strategies During the Period 2012�2015
Figure 45 Product Mix of Top Companiesfrom 2012 to 2015
Figure 46 Market Evaluation Framework: Significant Number of Partnerships, Agreements, Collaborations, and Business Expansions Have Fueled the Growth From 2012 to 2015
Figure 47 Battle for Market Share: Partnerships, Agreements, Collaborations, and Business Expansions Were the Key Strategies During the Forecast Period
Figure 48 Geographic Revenue Mix of Top 4 Market Players
Figure 49 IBM Corporation: Company Snapshot
Figure 50 IBM Corporation: SWOT Analysis
Figure 51 SAP SE: Company Snapshot
Figure 52 SAP SE: SWOT Analysis
Figure 53 Oracle Corporation: Company Snapshot
Figure 54 Oracle Corporation: SWOT Analysis
Figure 55 Tibco Software Inc.: SWOT Analysis
Figure 56 SAS Institute, Inc.: Company Snapshot
Figure 57 SAS Institute, Inc.: SWOT Analysis
Figure 58 Informatica Corporation: Company Snapshot
Figure 59 Red Hat, Inc.: Company Snapshot
Figure 60 Software AG: Company Snapshot


Growth opportunities and latent adjacency in Complex Event Processing Market