Smart Airports Market

Smart Airports Market by Airport Technology (Airport 2.0, Airport 3.0 and Airport 4.0), Application (Landside, Terminal Side, and Airside), Airport Size ( Small, Medium, and Large), System, End Market, Operation and Region - Global Forecast to 2027

Report Code: AS 2788 Dec, 2022, by marketsandmarkets.com

The Smart Airports Market size is projected to grow from USD 7.0 Billion in 2022 to USD 8.3 Billion by 2027, at a CAGR of 3.5% from 2022 to 2027. The increased usage of self-service technology, as well as the growing need for real-time information, are projected to fuel the expansion of the Smart Airports Industry. Furthermore, the use of the Internet of Things (IoT) at airports and manufacturing procedures is a significant breakthrough in the smart airports business. Companies all around the world are starting to employ cloud-based platforms to increase the operational efficiency. The cloud platform simplifies design by connecting suppliers, systems integrators, software developers, and other design and production ecosystem participants together on a virtual platform.
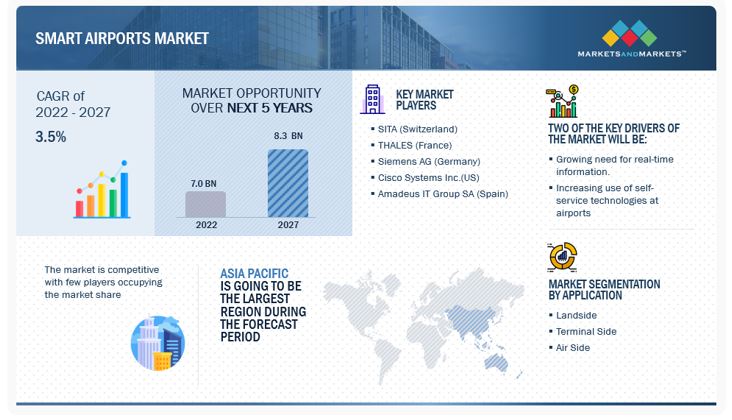
Smart airports Market

Smart airports Market Forecast to 2027

To know about the assumptions considered for the study, Request for Free Sample Report

Smart Airports Market Dynamics

Driver: Growing need for real-time information

There is an increasing need for passengers for real-time information to enable their travel experience convenient and comfortable. Smart airports are expected to be equipped with infrastructure that entails providing real-time information to passengers. They would require the establishment of customer touchpoints so that real-time updates about the progress of the journey of a customer can be easily obtained. These touchpoints can also be used to allow the rapid sharing of information within the entire value chain at an airports, thus allowing every entity of the system to work more effectively and efficiently.

According to SITA Air Transport IT Insights 2022, the use of mobile devices for booking, onboarding the airplane, and for bag collection have increased in Q1 2022 as compared to Q1 2020, while automated gates used for identity control, boarding, border control, and bag collection have all seen increase in technology adoption of 3% to 5% since 2020. Real-time information not only improves passenger experience but also process optimization. For instance, crew and staff can be tracked in real-time through their wearable devices. The tracking of passenger flow in real-time can help in queue management. Real-time data of environmental parameters, such as humidity, temperature, and pressure, can also be used by air traffic control to manage and plan traffic to and from the airport.

Restraint: Lack of standardized regulations for blockchain technology

Aviation is one of the highly regulated industries mainly due to the risks associated with its operations. A multitude of bilateral, national, and international regulations and standards bind the actions of aviation stakeholders, such as system manufacturers, service providers, and airports. For the integration of any new technology in aviation, a regulatory framework is a necessity. Aviation blockchain is yet to receive such frameworks or common standards to guide the integration and commercialization of the technology across various stakeholders. The issue will be to either come up with an entirely new framework that runs in line with the current framework or integrate blockchain into the existing set of regulations. Setting a regulatory framework takes years in the aviation industry. Thus, if a common standard or a regulatory framework is not set, it will directly restrain the commercial integration of blockchain globally. Along with this, the lack of common standards around the use of tokens in aviation for the tokenization of tickets and loyalty points could also lead to uncertainties around the commercial integration of blockchain.

Opportunity: Airport operation optimization through digitization

With digital technologies becoming more prevalent, airports are increasingly looking to external experts to help them with digital transformation. They are partnering with external managed service providers to both upgrade existing processes and install new smart systems. With flight delay causing airlines to incur heavy losses, a more efficient airport operation can result in fewer delays. Staff at airports can be better managed with the help of IoT by using tags and IoT wearables. The movement of ground staff can be tracked, and tasks assigned based on their location. Smart solutions are also used to better manage airport assets, such as luggage trolleys, aircraft, and ground staff. Tags are installed on the assets to track their real-time location, which can be further analyzed to optimize the process to be more efficient. This will reduce delays and cut down operational losses.

Terminal building operations, such as cleaning, heating & ventilating, and energy management, can be done through real-time parameter tracking through smart solutions. Smart solutions incorporated at the landside help ease parking processes and improve the travel experience for passengers. These solutions save time, reduce the manpower load, and provide efficient output resulting in optimized airport operations.

Challenge: Proper comprehension of passenger preferences

The concept of smart airports aims at improving efficiency, reducing operational costs, and providing ease to passengers. With increased competition, passenger satisfaction has become the main focus for airlines and airports. Emphasis is given on delivering personalized services to travelers at airports. To provide an enhanced experience to passengers, having information as to what they buy, why they buy it, and how they can be encouraged to buy more at airports is critical. A smart blend of leisure, dining, and retail offers to encourage passengers to spend more time at the airport before departure is an integral part of the smart airport concept. However, the biggest challenge is understanding the needs and preferences of passengers and offering personalized services in the absence of collaborated data.

In most cases, airlines have scattered data collected from different data points. For instance, the ticketing data is usually owned by travel agencies, agents, or airlines, and the marketing data is usually owned by retail or other information partners. In some cases, to use disparate data, airlines create multiple versions of passenger databases. However, they fail to use insights from various databases in a cohesive manner. In such cases, the challenge for airports and airlines is to provide an end-to-end smooth experience to passengers by collaborating the large databases of passenger preferences in a united format.

Smart Airports Market Ecosystem

Prominent companies in this market include well-established, financially stable manufacturers of aircraft hydraulic systems. These companies have been operating in the market for several years and possess a diversified product portfolio, state-of-the-art technologies, and strong global sales and marketing networks. Prominent companies include SITA (Switzerland), THALES (France), Siemens AG (Germany), Amadeus IT Group SA (Spain), IBM Corporation (US), Cisco Systems Inc. (US), Indra Sistemas S.A. (Spain), Honeywell International Inc. (US), L3Harris Technologies Inc (US). Airports, airlines, chartered operators, and airport management companies are some of the leading consumers of smart airport technologies.
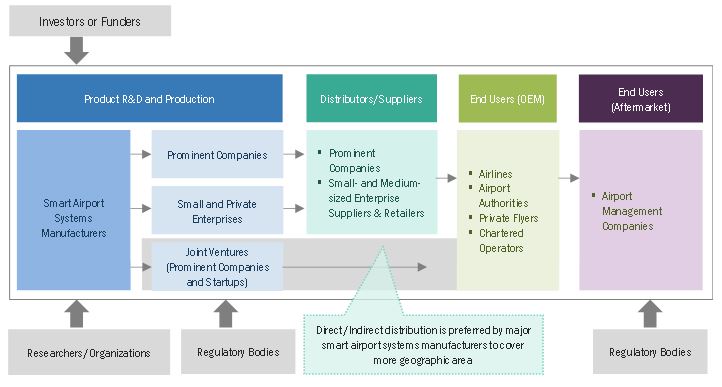
Smart airports Market Size, and Ecosystem

Upgrades & Service segment to dominate market share during the forecast period

Based on end market, the smart airports market has been segmented into implementation and upgrades & services. Airports are adopting digital transformation in order to distinguish their passenger experiences. Existing systems and solutions are being upgraded with sophisticated technology and solutions to improve the passenger experience and operational efficiency. The market is being driven by the demand for better maintenance and services to ensure their continuing operation.

Endpoint Devices to lead the market for Smart Airports during the forecast period

Based on System, the Smart Airports market has been segmented into Communication & connectivity, endpoint devices, data storage, software & solution. Airports employ reliable endpoint devices like as biometrics, RFID, beacons, and so on to speed up the screening process. The use of end point devices has improved airport operations and the customer experience. Furthermore, advancements in endpoint devices have improved security standards and optimized the screening process at airports. Thus, driving the market for the segment.

Airside segment to witness higher demand during the forecast period

Based on Application, the Smart Airports market has been classified into landside, Terminal side, Airside. Rapid growth in worldwide passenger traffic is predicted to boost demand for the smart solution on the airside. Smart operations at the airside are primarily utilized to better manage ground employees and reduce aircraft turnaround time. As a result, the need for smart solutions for airside operations, such as sophisticated aircraft parking solutions, advanced maintenance, and health monitoring systems, has been expanding in recent years, thus driving the market.

Medium to acquire the largest market share during the forecast period

Based on Airport Size, the Smart Airports market has been classified into small, medium, and large. Medium airports mostly cater to the domestic passenger traffic and airlines. The increased in the domestic air passenger footprint has encouraged the demand for the smart solutions at the airports. The solution will enhance the passenger experience and airport operations.

Airport 3.0 to acquire the largest market share during the forecast period

Based on Airport Technology, the Smart Airports market has been classified into airport 2.0, airport 3.0 and airport 4.0. The ongoing modernization of existing airports and various medium size airport are upgrading their airport solutions with smart technologies, to enhance the airport operations.

Non-Aeronautical segment to hold major market share during the forecast period

Based on operation, the Smart Airports market has been classified into aeronautical and non-aeronautical. The increase in the air passenger travel will drive the aviation industry, that will proportionally enhance the market for the aviation industry. Airports are focused on particular digital advertising, among other things (intelligent transport services, inventory management) to respond to consumer demands and fuel the growth of the non-aeronautical segment.

Asia Pacific is projected to witness the highest market share during the forecast period

Asia Pacific leads the Smart Airports market. The key factor driving the increase in passenger traffic in the area include an increase in the region's middle-class population's disposable income, expansion in international tourism, and affordable airfares in rising countries like India. The growing number of passengers will increase the demand for automation of processes like as baggage handling and self-check-in services. This will help to the exceptional development of smart airports in the Asia-Pacific region, which will contribute to the overall growth of the market.
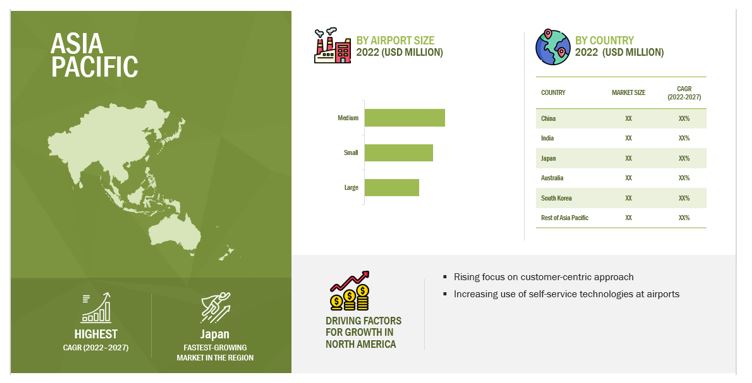
Smart airports Market Size, and Share

Smart airports Market by Region

To know about the assumptions considered for the study, download the pdf brochure

Key Market Players

Major players operating in the Smart Airports Companies include SITA (Switzerland), THALES (France), Siemens AG (Germany), Amadeus IT Group SA (Spain), IBM Corporation (US), Cisco Systems Inc. (US), Indra Sistemas S.A. (Spain), Honeywell International Inc. (US), L3Harris Technologies Inc (US).

Want to explore hidden markets that can drive new revenue in Smart Airports Market?

Scope of the Report

Report Metric

Details

Growth Rate

3.5%

Estimated Market Size in 2022

USD 7.0 Billion

Projected Market Size in 2027

USD 8.3 Billion

Market size available for years

2018-2027

Base year considered

2021

Forecast period

2022-2027

Forecast units

Value (USD Million/Billion)

Segments  Covered

By End Market, By Application,  By System, By Airport Size,By Airport Technology By Size, By Region

Geographies Covered

North America, Asia Pacific, Europe, and Rest of the World

Companies Covered

SITA (Switzerland), THALES (France), Siemens AG (Germany), Amadeus IT Group SA (Spain), IBM Corporation (US), Cisco Systems Inc. (US), Indra Sistemas S.A. (Spain), Honeywell International Inc. (US), L3Harris Technologies Inc (US), Raytheon Technologies Corporation (US) andamong others

Smart airports Market Highlights

This research report categorizes the Smart Airports Market based on Component, Type, End User, Platform, Application and Region.

Aspect

Details

Smart Airports Market, By End Market

  • Implementation
  • Upgrades & Services

Smart Airports Market, By Application

  • Airside
  • Landside
  • Terminal Side

Smart Airports Market, By System

  • Communication & Network Systems
  • Endpoint Devices
  • Data Storage
  • Software & Solutions

Smart Airports Market, By Airport Size

  • Small
  • Medium
  • Large

Smart Airports Market, By Airport Technology

  • Airport 2.0
  • Airport 3.0
  • Airport 4.0

Smart Airports Market, By Region

  • North America
  • Europe
  • Asia Pacific
  • Rest of the World

Recent Developments

  • In June 2022, Raytheon Technologies Corporation-Collins Aerospace announced the invention of AirPlan allows airports to manage all of its resources, including gates, check-in counters, and luggage belts, via a single application on any computer or mobile device connected to their network. AirPlan can give airport operations with tools that allow them to see the status of each resource in one location and with an easy-to-use user interface. Airports can swiftly and easily relocate personnel, deploy ground employees, and check passengers in for flights, improving operations and giving a better customer experience.
  • In June 2022, Thales Group introduces HELIXVIEW, a new innovative, stationary, compact, and lightweight Cabin Baggage Explosive Detection System (EDS CB) that eliminates the need for passengers to remove things from bags. HELIXVIEW is a C3-compliant scanner (next EDS CB standard) that blends electronic scanning based on X-ray nanotechnology with 3D image reconstruction. It also leverages on Thales' expertise in Artificial Intelligence (AI) and Cybersecurity to develop an intelligent and cost-effective airport solution. HELIXVIEW improves airport security while also providing travelers with more convenient travel options.
  • In November 2021, Honeywell International Inc. Honeywell unveiled the next generation of its Honeywell NAVITAS software suite platform today, a System of Systems (SoS) solution that will assist airport operators and aviation navigation service providers in making more informed and accurate choices throughout airside operations, from approach to gate. The most recent modifications allow for the automation and digitalization of air traffic services, which aid in effective ground movement, situational awareness, control and monitoring of airside and Air Traffic Management (ATM) equipment, information management, and integration.
  • In March 2021, Thales Group unveiled a digital secondary surveillance radar with increased performance and reliability for safer air traffic management – up to 2,000 flight tracks and 64 simultaneous data outputs to air traffic centers.

Frequently Asked Questions (FAQs) Addressed by the Report

To speak to our analyst for a discussion on the above findings, click Speak to Analyst

Exclusive indicates content/data unique to MarketsandMarkets and not available with any competitors.

TABLE OF CONTENTS
 
1 INTRODUCTION (Page No. - 27)
    1.1 STUDY OBJECTIVES 
    1.2 MARKET DEFINITION 
    1.3 STUDY SCOPE 
           1.3.1 MARKETS COVERED
           1.3.2 REGIONAL SCOPE
           1.3.3 YEARS CONSIDERED
    1.4 CURRENCY CONSIDERED 
           TABLE 1 USD EXCHANGE RATES
    1.5 INCLUSIONS AND EXCLUSIONS 
           TABLE 2 SMART AIRPORTS MARKET: INCLUSIONS AND EXCLUSIONS
    1.6 LIMITATIONS 
    1.7 STAKEHOLDERS 
    1.8 SUMMARY OF CHANGES 
 
2 RESEARCH METHODOLOGY (Page No. - 32)
    2.1 RESEARCH DATA 
           FIGURE 1 RESEARCH PROCESS FLOW
           FIGURE 2 SMART AIRPORTS MARKET: RESEARCH DESIGN
           2.1.1 SECONDARY DATA
                    2.1.1.1 Secondary sources
           2.1.2 PRIMARY SOURCE
                    2.1.2.1 Primary data
                    2.1.2.2 Key data from primary sources
                    2.1.2.3 Breakdown of primaries
                               FIGURE 3 BREAKDOWN OF PRIMARY INTERVIEWS: BY COMPANY TYPE, DESIGNATION, AND REGION
    2.2 FACTOR ANALYSIS 
           2.2.1 INTRODUCTION
           2.2.2 DEMAND-SIDE INDICATORS
                    2.2.2.1 Increase in airport infrastructure development to facilitate seamless passenger experience
           2.2.3 SUPPLY-SIDE INDICATORS
                    2.2.3.1 Development of advanced smart airport technologies by manufacturers
    2.3 RESEARCH APPROACH & METHODOLOGY 
           TABLE 3 SEGMENTS AND SUBSEGMENTS
    2.4 MARKET SIZE ESTIMATION 
           2.4.1 BOTTOM-UP APPROACH
                               2.4.1.1.1 Evaluation of smart airports market
                                            FIGURE 4 MARKET SIZE ESTIMATION: BOTTOM-UP APPROACH (DEMAND-SIDE)
           2.4.2 TOP-DOWN APPROACH
                    FIGURE 5 MARKET SIZE ESTIMATION: TOP-DOWN APPROACH (SUPPLY-SIDE)
    2.5 MARKET BREAKDOWN AND DATA TRIANGULATION 
           FIGURE 6 DATA TRIANGULATION METHODOLOGY
    2.6 RECESSION IMPACT ON MARKET ANALYSIS 
           FIGURE 7 SMART AIRPORTS MARKET: QUARTERLY REVENUE OF TOP FOUR COMPANIES
           FIGURE 8 SMART AIRPORT SYSTEMS: AIR PASSENGER FOOTPRINT AND REVENUE PER KILOMETER (RPK) YOY GROWTH 2022
    2.7 GROWTH RATE ASSUMPTIONS 
    2.8 ASSUMPTIONS 
           FIGURE 9 PARAMETRIC ASSUMPTIONS MADE FOR MARKET FORECAST
    2.9 RISKS 
 
3 EXECUTIVE SUMMARY (Page No. - 45)
    FIGURE 10 BY APPLICATION, AIRSIDE SEGMENT PROJECTED TO LEAD SMART AIRPORTS MARKET DURING FORECAST PERIOD
    FIGURE 11 BY SYSTEM, ENDPOINT DEVICES SEGMENT ESTIMATED TO LEAD MARKET IN 2022
    FIGURE 12 BY AIRPORT SIZE, MEDIUM SEGMENT PROJECTED TO REGISTER HIGHEST GROWTH RATE DURING FORECAST PERIOD
    FIGURE 13 ASIA PACIFIC ESTIMATED TO ACCOUNT FOR LARGEST MARKET SHARE IN 2022
 
4 PREMIUM INSIGHTS (Page No. - 48)
    4.1 ATTRACTIVE OPPORTUNITIES FOR PLAYERS IN SMART AIRPORTS MARKET 
           FIGURE 14 BUSINESS OPTIMIZATION AND IMPROVED PASSENGER EXPERIENCE TO DRIVE GROWTH OF SMART AIRPORTS MARKET
    4.2 SMART AIRPORTS MARKET, BY APPLICATION 
           FIGURE 15 AIRSIDE SEGMENT TO HOLD DOMINANT SHARE DURING FORECAST PERIOD
    4.3 SMART AIRPORTS MARKET, BY AIRPORT TECHNOLOGY 
           FIGURE 16 AIRPORT 3.0 SEGMENT TO LEAD MARKET FROM 2022 TO 2027
    4.4 SMART AIRPORTS MARKET, BY END MARKET 
           FIGURE 17 UPGRADES & SERVICES SEGMENT TO LEAD MARKET FROM 2022 TO 2027
 
5 MARKET OVERVIEW (Page No. - 50)
    5.1 INTRODUCTION 
    5.2 MARKET DYNAMICS 
           FIGURE 18 SMART AIRPORTS: MARKET DYNAMICS
           5.2.1 DRIVERS
                    5.2.1.1 Growing need for real-time information
                               FIGURE 19 AIRPORT PASSENGERS’ TECHNOLOGY ADOPTION SURVEY, 2022
                    5.2.1.2 Increasing use of self-service technologies at airports
                    5.2.1.3 Rise in focus on customer-centric approaches
                    5.2.1.4 Adoption of sophisticated connectivity technologies
           5.2.2 RESTRAINTS
                    5.2.2.1 Difficulties in data collaboration
                    5.2.2.2 Lack of standardized regulations for blockchain technology
                    5.2.2.3 Privacy concerns
           5.2.3 OPPORTUNITIES
                    5.2.3.1 Airport operation optimization through digitization
                    5.2.3.2 New revenue sources from smart solutions
           5.2.4 CHALLENGES
                    5.2.4.1 Comprehension of passenger preferences
                    5.2.4.2 High CAPEX resulting in slow integration of innovative technologies
    5.3 TRENDS/DISRUPTIONS IMPACTING CUSTOMER BUSINESS 
           5.3.1 REVENUE SHIFT AND NEW REVENUE POCKETS FOR PLAYERS IN SMART AIRPORTS MARKET
                    FIGURE 20 REVENUE SHIFT IN SMART AIRPORTS MARKET
    5.4 TRADE ANALYSIS 
           TABLE 4 IMPORTED VALUE OF AIRCRAFT AND SPACECRAFT PARTS, USD MILLION (2017–2021)
           TABLE 5 EXPORTED VALUE OF AIRCRAFT AND SPACECRAFT PARTS, USD MILLION (2017–2021)
    5.5 PRICING ANALYSIS 
           TABLE 6 AVERAGE SELLING PRICE RANGE: SMART AIRPORTS MARKET (BY APPLICATION)
    5.6 MARKET ECOSYSTEM 
           5.6.1 PROMINENT COMPANIES
           5.6.2 PRIVATE AND SMALL ENTERPRISES
           5.6.3 END USERS
                    FIGURE 21 MARKET ECOSYSTEM MAP: SMART AIRPORTS
                    TABLE 7 SMART AIRPORTS MARKET ECOSYSTEM
    5.7 VALUE CHAIN ANALYSIS 
           FIGURE 22 VALUE CHAIN ANALYSIS: SMART AIRPORTS MARKET
    5.8 RECESSION IMPACT ANALYSIS 
           FIGURE 23 RECESSION IMPACT ANALYSIS
    5.9 TECHNOLOGY ANALYSIS 
           5.9.1 TECHNOLOGICAL ADVANCEMENTS IN PASSENGER BOARDING BRIDGES
           5.9.2 MRO PROVIDERS TO INVEST IN MODERNIZATION OF GROUND SUPPORT EQUIPMENT
    5.10 PORTER’S FIVE FORCES MODEL 
           TABLE 8 SMART AIRPORTS MARKET: PORTER’S FIVE FORCES ANALYSIS
           5.10.1 THREAT OF NEW ENTRANTS
           5.10.2 THREAT OF SUBSTITUTES
           5.10.3 BARGAINING POWER OF SUPPLIERS
           5.10.4 BARGAINING POWER OF BUYERS
           5.10.5 INTENSITY OF COMPETITIVE RIVALRY
    5.11 KEY STAKEHOLDERS AND BUYING CRITERIA 
           5.11.1 KEY STAKEHOLDERS IN BUYING PROCESS
                     FIGURE 24 INFLUENCE OF STAKEHOLDERS ON BUYING PROCESS OF SMART AIRPORT TECHNOLOGIES
                     TABLE 9 INFLUENCE OF STAKEHOLDERS ON BUYING PROCESS FOR SMART AIRPORT TECHNOLOGIES (%)
           5.11.2 BUYING CRITERIA
                     FIGURE 25 KEY BUYING CRITERIA FOR SMART AIRPORT TECHNOLOGIES
                     TABLE 10 KEY BUYING CRITERIA FOR SMART AIRPORT TECHNOLOGIES
    5.12 KEY CONFERENCES AND EVENTS IN 2022–2023 
           TABLE 11 SMART AIRPORTS MARKET: CONFERENCES AND EVENTS, 2022–2023
    5.13 TARIFF REGULATORY LANDSCAPE FOR AEROSPACE INDUSTRY 
           TABLE 12 NORTH AMERICA: REGULATORY BODIES, GOVERNMENT AGENCIES, AND OTHER ORGANIZATIONS
           TABLE 13 EUROPE: REGULATORY BODIES, GOVERNMENT AGENCIES, AND OTHER ORGANIZATIONS
           TABLE 14 ASIA PACIFIC: REGULATORY BODIES, GOVERNMENT AGENCIES, AND OTHER ORGANIZATIONS
           TABLE 15 REST OF THE WORLD: REGULATORY BODIES, GOVERNMENT AGENCIES, AND OTHER ORGANIZATIONS
 
6 INDUSTRY TRENDS (Page No. - 72)
    6.1 INTRODUCTION 
    6.2 SUPPLY CHAIN ANALYSIS 
           FIGURE 26 SUPPLY CHAIN ANALYSIS OF SMART AIRPORTS MARKET
    6.3 TECHNOLOGY TRENDS 
           6.3.1 AGILE SYSTEM WITH OPEN ARCHITECTURE
           6.3.2 EDGE COMPUTING
           6.3.3 DYNAMIC WIRELESS INDUCTIVE EV CHARGING
           6.3.4 ELECTRIFICATION IN PASSENGER BUSES
    6.4 USE CASES: SMART AIRPORTS 
           TABLE 16 SMART AIRPORTS USE CASES
    6.5 IMPACT OF MEGATRENDS 
           FIGURE 27 IMPACT OF MEGATRENDS ON VALUE SHARING IN ECOSYSTEM
    6.6 SMART AIRPORTS MARKET: PATENT ANALYSIS 
           TABLE 17 KEY PATENTS, 2018–2022
 
7 SMART AIRPORTS MARKET, BY SYSTEM (Page No. - 82)
    7.1 INTRODUCTION 
           FIGURE 28 ENDPOINT DEVICES TO LEAD SMART AIRPORTS MARKET DURING FORECAST PERIOD
           TABLE 18 SMART AIRPORTS MARKET, BY SYSTEM, 2018–2021 (USD MILLION)
           TABLE 19 SMART AIRPORTS MARKET, BY SYSTEM, 2022–2027 (USD MILLION)
    7.2 COMMUNICATION & CONNECTIVITY 
           FIGURE 29 LPWAN & WLAN TO LEAD COMMUNICATION & CONNECTIVITY SEGMENT DURING FORECAST PERIOD
           TABLE 20 COMMUNICATION & CONNECTIVITY: SMART AIRPORTS MARKET, BY SUBSYSTEM, 2018–2021 (USD MILLION)
           TABLE 21 COMMUNICATION & CONNECTIVITY: SMART AIRPORTS MARKET, BY SUBSYSTEM, 2022–2027 (USD MILLION)
           7.2.1 WIRELESS
                    7.2.1.1 Deployment of wireless technology during upgradation of airport 2.0 to airport 3.0 to drive market
           7.2.2 NEAR-FIELD COMMUNICATION, RFID, BLUETOOTH
                    7.2.2.1 Growing use of RFID technology for passenger ease to drive market
           7.2.3 LPWAN & WLAN
                    7.2.3.1 Advanced WLAN systems to drive market
    7.3 ENDPOINT DEVICES 
           FIGURE 30 CAMERAS TO LEAD ENDPOINT DEVICES MARKET DURING FORECAST PERIOD
           TABLE 22 ENDPOINT DEVICES: SMART AIRPORTS MARKET, BY SUBSYSTEM, 2018–2021 (USD MILLION)
           TABLE 23 ENDPOINT DEVICES: SMART AIRPORTS MARKET, BY SUBSYSTEM, 2022–2027 (USD MILLION)
           7.3.1 CAMERAS
                    7.3.1.1 Deployment of thermal cameras for security and surveillance at airports to drive market
           7.3.2 SENSORS
                    7.3.2.1 Enhancing airport services such as taxi queues to drive market
           7.3.3 DISPLAYS
                    7.3.3.1 Advancements in display technology to drive market
           7.3.4 TAGS
                    7.3.4.1 Increase in air traveler footprint to drive market
           7.3.5 WEARABLES
                    7.3.5.1 Increment in operational efficiency to drive market
           7.3.6 BEACONS
                    7.3.6.1 Advancement in beacon technology to drive market
    7.4 DATA STORAGE 
           FIGURE 31 CLOUD TO LEAD DATA STORAGE MARKET DURING FORECAST PERIOD
           TABLE 24 DATA STORAGE: SMART AIRPORTS MARKET, BY SUBSYSTEM, 2018–2021 (USD MILLION)
           TABLE 25 DATA STORAGE: SMART AIRPORTS MARKET, BY SUBSYSTEM, 2022–2027 (USD MILLION)
           7.4.1 CLOUD
                    7.4.1.1 Advanced IT Infrastructure to drive market
           7.4.2 ON-PREMISES
                    7.4.2.1 Quickly accessible data to drive market
    7.5 SOFTWARE & SOLUTIONS 
           FIGURE 32 SOFTWARE & APPLICATIONS TO LEAD SOFTWARE & SOLUTIONS MARKET DURING FORECAST PERIOD
           TABLE 26 SOFTWARE & SOLUTIONS: SMART AIRPORTS MARKET, BY SUBSYSTEM, 2018–2021 (USD MILLION)
           TABLE 27 SOFTWARE & SOLUTIONS: SMART AIRPORTS MARKET, BY SUBSYSTEM, 2022–2027 (USD MILLION)
           7.5.1 SOFTWARE & APPLICATIONS
                    7.5.1.1 Modernization of existing infrastructure to drive market
           7.5.2 DATA ANALYTICS
                    7.5.2.1 Implementation of data analytics at large airports to improve passenger experience
           7.5.3 PLATFORMS
                    7.5.3.1 Advancements in airport platforms to drive market
           7.5.4 MANAGED SERVICES
                    7.5.4.1 Increased air-passenger traffic to drive market
 
8 SMART AIRPORTS MARKET, BY APPLICATION (Page No. - 93)
    8.1 INTRODUCTION 
           FIGURE 33 AIRSIDE SEGMENT TO HOLD MAJOR MARKET SHARE DURING FORECAST PERIOD
           TABLE 28 SMART AIRPORTS MARKET, BY APPLICATION, 2018–2021 (USD MILLION)
           TABLE 29 SMART AIRPORTS MARKET, BY APPLICATION, 2022–2027 (USD MILLION)
    8.2 LANDSIDE 
           FIGURE 34 VEHICLE PARKING TO LEAD LANDSIDE MARKET DURING FORECAST PERIOD
           TABLE 30 LANDSIDE: SMART AIRPORTS MARKET, BY APPLICATION, 2018–2021 (USD MILLION)
           TABLE 31 LANDSIDE: SMART AIRPORTS MARKET, BY APPLICATION, 2022–2027 (USD MILLION)
           8.2.1 INTELLIGENT ADVERTISING
                    8.2.1.1 Customized advertisements to drive market
           8.2.2 VEHICLE PARKING
                    8.2.2.1 Increase in use of SmartPark System to drive market
           8.2.3 CAR RENTAL & MASS TRANSIT
                    8.2.3.1 Ride-hailing apps to create significant business opportunities
    8.3 TERMINAL SIDE 
           FIGURE 35 PASSENGER SCREENING TO LEAD TERMINAL SIDE MARKET DURING FORECAST PERIOD
           TABLE 32 TERMINAL SIDE MARKET, BY APPLICATION, 2018–2021 (USD MILLION)
           TABLE 33 TERMINAL SIDE MARKET, BY APPLICATION, 2022–2027 (USD MILLION)
           8.3.1 BUILDING MANAGEMENT
                    8.3.1.1 Integration of advanced smart technologies to drive market
           8.3.2 PASSENGER SCREENING
                    8.3.2.1 Installation of self-check-in kiosks at airports to drive market
           8.3.3 PASSENGER EXPERIENCE
                    8.3.3.1 Deployment of robots at various airports to assist passengers with vital information to drive market
           8.3.4 STAFF & CREW MANAGEMENT
                    8.3.4.1 Traceable wearables and IoT solutions to improve crew management
           8.3.5 BEHAVIORAL ANALYTICS
                    8.3.5.1 Adoption of behavioral analytics into security protocol to drive market
           8.3.6 CARGO AND BAGGAGE HANDLING
                    8.3.6.1 Adoption of integrated cart systems to drive market
           8.3.7 PAYMENT & TOKENIZATION
                    8.3.7.1 Inception of blockchain technology to drive market
    8.4 AIRSIDE 
           FIGURE 36 AIR TRAFFIC MANAGEMENT TO LEAD AIRSIDE MARKET DURING FORECAST PERIOD
           TABLE 34 AIRSIDE MARKET, BY APPLICATION, 2018–2021 (USD MILLION)
           TABLE 35 AIRSIDE MARKET, BY APPLICATION, 2022–2027 (USD MILLION)
           8.4.1 E-FENCE
                    8.4.1.1 Integration of fences with sensors to drive market
           8.4.2 GROUND SUPPORT EQUIPMENT MANAGEMENT
                    8.4.2.1 Smart vehicles such as automatic bots to drive market
           8.4.3 AIRCRAFT MAINTENANCE
                    8.4.3.1 Advanced aircraft maintenance technologies to boost market
           8.4.4 AIR TRAFFIC MANAGEMENT
                    8.4.4.1 Implementation of smart technologies to drive market
           8.4.5 NOISE MONITORING
                    8.4.5.1 Smart solutions used for noise monitoring to boost market
           8.4.6 AIRCRAFT TURNAROUND MANAGEMENT
                    8.4.6.1 Smart solutions used for operations to drive market
           8.4.7 ADVANCED VISUAL DOCKING GUIDANCE SYSTEM (A-VDGS)
                    8.4.7.1 Automation for efficient gate management to drive market
 
9 SMART AIRPORTS MARKET, BY AIRPORT SIZE (Page No. - 104)
    9.1 INTRODUCTION 
           FIGURE 37 MEDIUM AIRPORT SEGMENT TO LEAD SMART AIRPORTS MARKET DURING FORECAST PERIOD
           TABLE 36 SMART AIRPORTS MARKET, BY AIRPORT SIZE, 2018–2021 (USD MILLION)
           TABLE 37 SMART AIRPORTS MARKET, BY AIRPORT SIZE, 2022–2027 (USD MILLION)
    9.2 LARGE 
           9.2.1 ADOPTION OF SELF-SERVICE SYSTEMS TO DRIVE MARKET
    9.3 MEDIUM 
           9.3.1 DEVELOPMENT OF NEW AIRPORTS IN ASIA PACIFIC TO DRIVE MARKET
    9.4 SMALL 
           9.4.1 INCREASED USE OF CHARTER SERVICES TO DRIVE MARKET
 
10 SMART AIRPORTS MARKET, BY END MARKET (Page No. - 107)
     10.1 INTRODUCTION 
             FIGURE 38 UPGRADES & SERVICES SEGMENT TO HOLD MAJOR MARKET SHARE DURING FORECAST PERIOD
             TABLE 38 SMART AIRPORTS MARKET, BY END MARKET, 2018–2021 (USD MILLION)
             TABLE 39 SMART AIRPORTS MARKET, BY END MARKET NORTH AMERICA RECESSION IMPACT, 2022–2027 (USD MILLION)
     10.2 IMPLEMENTATION 
             10.2.1 SMART APPLICATIONS IN AIRPORTS TO DRIVE MARKET
     10.3 UPGRADES & SERVICES 
             10.3.1 UPGRADATION OF LEGACY AIRPORT SYSTEMS WITH SMART TECHNOLOGIES TO DRIVE MARKET
 
11 SMART AIRPORTS MARKET, BY AIRPORT TECHNOLOGY (Page No. - 110)
     11.1 INTRODUCTION 
           FIGURE 39 AIRPORT 3.0 SEGMENT TO DOMINATE MARKET DURING FORECAST PERIOD
           TABLE 40 SMART AIRPORTS MARKET, BY AIRPORT TECHNOLOGY, 2018–2021 (USD MILLION)
           TABLE 41 SMART AIRPORTS MARKET, BY AIRPORT TECHNOLOGY, 2022–2027 (USD MILLION)
     11.2 AIRPORT 2.0 
             11.2.1 INCREASED ADOPTION OF DIGITIZATION TO IMPROVE PASSENGER EXPERIENCE
     11.3 AIRPORT 3.0 
             11.3.1 DIGITALIZATION LEVERAGED TO ENHANCE OPERATIONAL EFFICIENCY
     11.4 AIRPORT 4.0 
             11.4.1 BIG DATA AND OPEN DATA LEVERAGED TO ENHANCE INNOVATION
 
12 SMART AIRPORTS MARKET, BY OPERATION (Page No. - 113)
     12.1 INTRODUCTION 
             FIGURE 40 NON-AERONAUTICAL SEGMENT TO LEAD MARKET
             TABLE 42 SMART AIRPORTS MARKET, BY OPERATION, 2018–2021 (USD MILLION)
             TABLE 43 SMART AIRPORTS MARKET, BY OPERATION, 2022–2027 (USD MILLION)
     12.2 AERONAUTICAL 
             12.2.1 CONTENT MANAGEMENT
                        12.2.1.1 Adoption of technologically advanced smart airports solutions to drive market
             12.2.2 BUSINESS INTELLIGENCE
                        12.2.2.1 Reduction in administration cost to drive market
             12.2.3 REAL-TIME SERVICES
                        12.2.3.1 Increment in operational performance by implementation of IoT solutions to fuel market
             12.2.4 SUPPLY CHAIN MANAGEMENT
                        12.2.4.1 Technological advancements to improve efficiency of supply chain operations
     12.3 NON-AERONAUTICAL 
             12.3.1 REAL-TIME SERVICES
                        12.3.1.1 Demand for improved passenger experience to drive market
             12.3.2 BUSINESS INTELLIGENCE
                        12.3.2.1 Low operational costs to drive market
             12.3.3 INTELLIGENT TRANSPORT SERVICES
                        12.3.3.1 Growing need to optimize transportation to drive market
             12.3.4 INVENTORY MANAGEMENT
                        12.3.4.1 Advancements in IT solutions to drive demand
             12.3.5 FEE MANAGEMENT
                        12.3.5.1 Increased security with advancements in blockchain to drive demand
             12.3.6 RESOURCE MANAGEMENT
                        12.3.6.1 Increase in adoption of resource management solutions to drive demand
 
13 REGIONAL ANALYSIS (Page No. - 118)
     13.1 INTRODUCTION 
             FIGURE 41 ASIA PACIFIC ESTIMATED TO ACCOUNT FOR LARGEST MARKET SHARE IN 2022
             TABLE 44 SMART AIRPORTS MARKET, BY REGION, 2018–2021 (USD MILLION)
             TABLE 45 SMART AIRPORTS MARKET, BY REGION, 2022–2027 (USD MILLION)
     13.2 NORTH AMERICA 
             13.2.1 NORTH AMERICA: RECESSION ANALYSIS
                        TABLE 46 NORTH AMERICA: RECESSION IMPACT ANALYSIS
             13.2.2 PESTLE ANALYSIS: NORTH AMERICA
                        FIGURE 42 NORTH AMERICA: SMART AIRPORTS MARKET SNAPSHOT
                        TABLE 47 NORTH AMERICA: SMART AIRPORTS MARKET, BY APPLICATION, 2018–2021 (USD MILLION)
                        TABLE 48 NORTH AMERICA: SMART AIRPORTS MARKET, BY APPLICATION, 2022–2027 (USD MILLION)
                        TABLE 49 NORTH AMERICA: SMART AIRPORTS MARKET, BY OPERATION, 2018–2021 (USD MILLION)
                        TABLE 50 NORTH AMERICA: SMART AIRPORTS MARKET, BY OPERATION, 2022–2027 (USD MILLION)
                        TABLE 51 NORTH AMERICA: SMART AIRPORTS MARKET, BY AIRPORT SIZE, 2018–2021 (USD MILLION)
                        TABLE 52 NORTH AMERICA: SMART AIRPORTS MARKET, BY AIRPORT SIZE, 2022–2027 (USD MILLION)
                        TABLE 53 NORTH AMERICA: SMART AIRPORTS MARKET, BY AIRPORT TECHNOLOGY, 2018–2021 (USD MILLION)
                        TABLE 54 NORTH AMERICA: SMART AIRPORTS MARKET, BY AIRPORT TECHNOLOGY, 2022–2027 (USD MILLION)
                        TABLE 55 NORTH AMERICA: SMART AIRPORTS MARKET, BY SYSTEM, 2018–2021 (USD MILLION)
                        TABLE 56 NORTH AMERICA: SMART AIRPORTS MARKET, BY SYSTEM, 2022–2027 (USD MILLION)
                        TABLE 57 NORTH AMERICA: SMART AIRPORTS MARKET, BY END MARKET, 2018–2021 (USD MILLION)
                        TABLE 58 NORTH AMERICA: SMART AIRPORTS MARKET, BY END MARKET, 2022–2027 (USD MILLION)
                        TABLE 59 NORTH AMERICA: SMART AIRPORTS MARKET, BY COUNTRY, 2018–2021 (USD MILLION)
                        TABLE 60 NORTH AMERICA: SMART AIRPORTS MARKET, BY COUNTRY, 2022–2027 (USD MILLION)
             13.2.3 US
                        13.2.3.1 High number of busy airports to drive market for smart technology
                                     TABLE 61 US: SMART AIRPORTS MARKET, BY AIRPORT SIZE, 2018–2021 (USD MILLION)
                                     TABLE 62 US: SMART AIRPORTS MARKET, BY AIRPORT SIZE, 2022–2027 (USD MILLION)
                                     TABLE 63 US: SMART AIRPORTS MARKET, BY AIRPORT TECHNOLOGY, 2018–2021 (USD MILLION)
                                     TABLE 64 US: SMART AIRPORTS MARKET, BY AIRPORT TECHNOLOGY, 2022–2027 (USD MILLION)
             13.2.4 CANADA
                        13.2.4.1 Increased investment by Canadian government to enhance airport operations
                                     TABLE 65 CANADA: SMART AIRPORTS MARKET, BY AIRPORT SIZE, 2018–2021 (USD MILLION)
                                     TABLE 66 CANADA: SMART AIRPORTS MARKET, BY AIRPORT SIZE, 2022–2027 (USD MILLION)
                                     TABLE 67 CANADA: SMART AIRPORTS MARKET, BY AIRPORT TECHNOLOGY, 2018–2021 (USD MILLION)
                                     TABLE 68 CANADA: SMART AIRPORTS MARKET, BY AIRPORT TECHNOLOGY, 2022–2027 (USD MILLION)
     13.3 EUROPE 
             13.3.1 EUROPE: RECESSION ANALYSIS
                        TABLE 69 EUROPE: RECESSION IMPACT ANALYSIS
             13.3.2 PESTLE ANALYSIS: EUROPE
                        FIGURE 43 EUROPE: SMART AIRPORTS MARKET SNAPSHOT
                        TABLE 70 EUROPE: SMART AIRPORTS MARKET, BY APPLICATION, 2018–2021 (USD MILLION)
                        TABLE 71 EUROPE: SMART AIRPORTS MARKET, BY APPLICATION, 2022–2027 (USD MILLION)
                        TABLE 72 EUROPE: SMART AIRPORTS MARKET, BY OPERATION, 2018–2021 (USD MILLION)
                        TABLE 73 EUROPE: SMART AIRPORTS MARKET, BY OPERATION, 2022–2027 (USD MILLION)
                        TABLE 74 EUROPE: SMART AIRPORTS MARKET, BY AIRPORT SIZE, 2018–2021 (USD MILLION)
                        TABLE 75 EUROPE: SMART AIRPORTS MARKET, BY AIRPORT SIZE, 2022–2027 (USD MILLION)
                        TABLE 76 EUROPE: SMART AIRPORTS MARKET, BY AIRPORT TECHNOLOGY, 2018–2021 (USD MILLION)
                        TABLE 77 EUROPE: SMART AIRPORTS MARKET, BY AIRPORT TECHNOLOGY, 2022–2027 (USD MILLION)
                        TABLE 78 EUROPE: SMART AIRPORTS MARKET, BY SYSTEM, 2018–2021 (USD MILLION)
                        TABLE 79 EUROPE: SMART AIRPORTS MARKET, BY SYSTEM, 2022–2027 (USD MILLION)
                        TABLE 80 EUROPE: SMART AIRPORTS MARKET, BY END MARKET, 2018–2021 (USD MILLION)
                        TABLE 81 EUROPE: SMART AIRPORTS MARKET, BY END MARKET, 2022–2027 (USD MILLION)
                        TABLE 82 EUROPE: SMART AIRPORTS MARKET, BY COUNTRY, 2018–2021 (USD MILLION)
                        TABLE 83 EUROPE: SMART AIRPORTS MARKET, BY COUNTRY, 2022–2027 (USD MILLION)
             13.3.3 UK
                        13.3.3.1 Airport congestion to lead to modernization of airport systems
                                     TABLE 84 UK: SMART AIRPORTS MARKET, BY AIRPORT SIZE, 2018–2021 (USD MILLION)
                                     TABLE 85 UK: SMART AIRPORTS MARKET, BY AIRPORT SIZE, 2022–2027 (USD MILLION)
                                     TABLE 86 UK: SMART AIRPORTS MARKET, BY AIRPORT TECHNOLOGY, 2018–2021 (USD MILLION)
                                     TABLE 87 UK: SMART AIRPORTS MARKET, BY AIRPORT TECHNOLOGY, 2022–2027 (USD MILLION)
             13.3.4 FRANCE
                        13.3.4.1 Increased adoption of smart solutions to drive market
                                     TABLE 88 FRANCE: SMART AIRPORTS MARKET, BY AIRPORT SIZE, 2018–2021 (USD MILLION)
                                     TABLE 89 FRANCE: SMART AIRPORTS MARKET, BY AIRPORT SIZE, 2022–2027 (USD MILLION)
                                     TABLE 90 FRANCE: SMART AIRPORTS MARKET, BY AIRPORT TECHNOLOGY, 2018–2021 (USD MILLION)
                                     TABLE 91 FRANCE: SMART AIRPORTS MARKET, BY AIRPORT TECHNOLOGY, 2022–2027 (USD MILLION)
             13.3.5 GERMANY
                        13.3.5.1 Increasing partnerships between airlines and smart solution providers
                                     TABLE 92 GERMANY: SMART AIRPORTS MARKET, BY AIRPORT SIZE, 2018–2021 (USD MILLION)
                                     TABLE 93 GERMANY: SMART AIRPORTS MARKET, BY AIRPORT SIZE, 2022–2027 (USD MILLION)
                                     TABLE 94 GERMANY: SMART AIRPORTS MARKET, BY AIRPORT TECHNOLOGY, 2018–2021 (USD MILLION)
                                     TABLE 95 GERMANY: SMART AIRPORTS MARKET, BY AIRPORT TECHNOLOGY, 2022–2027 (USD MILLION)
             13.3.6 REST OF EUROPE
                        13.3.6.1 Rapid development of small regional airports
                                     TABLE 96 REST OF EUROPE: SMART AIRPORTS MARKET, BY AIRPORT SIZE, 2018–2021 (USD MILLION)
                                     TABLE 97 REST OF EUROPE: SMART AIRPORTS MARKET, BY AIRPORT SIZE, 2022–2027 (USD MILLION)
                                     TABLE 98 REST OF EUROPE: SMART AIRPORTS MARKET, BY AIRPORT TECHNOLOGY, 2018–2021 (USD MILLION)
                                     TABLE 99 REST OF EUROPE: SMART AIRPORTS MARKET, BY AIRPORT TECHNOLOGY, 2022–2027 (USD MILLION)
     13.4 ASIA PACIFIC 
             13.4.1 ASIA PACIFIC: REGIONAL RECESSION ANALYSIS
                        TABLE 100 ASIA PACIFIC: RECESSION IMPACT ANALYSIS
             13.4.2 PESTLE ANALYSIS: ASIA PACIFIC
                        FIGURE 44 ASIA PACIFIC: SMART AIRPORTS MARKET SNAPSHOT
                        TABLE 101 ASIA PACIFIC: SMART AIRPORTS MARKET, BY APPLICATION, 2018–2021 (USD MILLION)
                        TABLE 102 ASIA PACIFIC: SMART AIRPORTS MARKET, BY APPLICATION, 2022–2027 (USD MILLION)
                        TABLE 103 ASIA PACIFIC: SMART AIRPORTS MARKET, BY OPERATION, 2018–2021 (USD MILLION)
                        TABLE 104 ASIA PACIFIC: SMART AIRPORTS MARKET, BY OPERATION, 2022–2027 (USD MILLION)
                        TABLE 105 ASIA PACIFIC: SMART AIRPORTS MARKET, BY AIRPORT SIZE, 2018–2021 (USD MILLION)
                        TABLE 106 ASIA PACIFIC: SMART AIRPORTS MARKET, BY AIRPORT SIZE, 2022–2027 (USD MILLION)
                        TABLE 107 ASIA PACIFIC: SMART AIRPORTS MARKET, BY AIRPORT TECHNOLOGY, 2018–2021 (USD MILLION)
                        TABLE 108 ASIA PACIFIC: SMART AIRPORTS MARKET, BY AIRPORT TECHNOLOGY, 2022–2027 (USD MILLION)
                        TABLE 109 ASIA PACIFIC: SMART AIRPORTS MARKET, BY SYSTEM, 2018–2021 (USD MILLION)
                        TABLE 110 ASIA PACIFIC: SMART AIRPORTS MARKET, BY SYSTEM, 2022–2027 (USD MILLION)
                        TABLE 111 ASIA PACIFIC: SMART AIRPORTS MARKET, BY END MARKET, 2018–2021 (USD MILLION)
                        TABLE 112 ASIA PACIFIC: SMART AIRPORTS MARKET, BY END MARKET, 2022–2027 (USD MILLION)
                        TABLE 113 ASIA PACIFIC: SMART AIRPORTS MARKET, BY COUNTRY, 2018–2021 (USD MILLION)
                        TABLE 114 ASIA PACIFIC: SMART AIRPORTS MARKET, BY COUNTRY, 2022–2027 (USD MILLION)
             13.4.3 CHINA
                        13.4.3.1 Digital transformation initiatives to drive market
                                     TABLE 115 CHINA: SMART AIRPORTS MARKET, BY AIRPORT SIZE, 2018–2021 (USD MILLION)
                                     TABLE 116 CHINA: SMART AIRPORTS MARKET, BY AIRPORT SIZE, 2022–2027 (USD MILLION)
                                     TABLE 117 CHINA: SMART AIRPORTS MARKET, BY AIRPORT TECHNOLOGY, 2018–2021 (USD MILLION)
                                     TABLE 118 CHINA: SMART AIRPORTS MARKET, BY AIRPORT TECHNOLOGY, 2022–2027 (USD MILLION)
             13.4.4 INDIA
                        13.4.4.1 New airport projects to drive market growth in India
                                     TABLE 119 INDIA: SMART AIRPORTS MARKET, BY AIRPORT SIZE, 2018–2021 (USD MILLION)
                                     TABLE 120 INDIA: SMART AIRPORTS MARKET, BY AIRPORT SIZE, 2022–2027 (USD MILLION)
                                     TABLE 121 INDIA: SMART AIRPORTS MARKET, BY AIRPORT TECHNOLOGY, 2018–2021 (USD MILLION)
                                     TABLE 122 INDIA: SMART AIRPORTS MARKET, BY AIRPORT TECHNOLOGY, 2022–2027 (USD MILLION)
             13.4.5 JAPAN
                        13.4.5.1 Investment in implementation of smart technologies at airports to drive market
                                     TABLE 123 JAPAN: SMART AIRPORTS MARKET, BY AIRPORT SIZE, 2018–2021 (USD MILLION)
                                     TABLE 124 JAPAN: SMART AIRPORTS MARKET, BY AIRPORT SIZE, 2022–2027 (USD MILLION)
                                     TABLE 125 JAPAN: SMART AIRPORTS MARKET, BY AIRPORT TECHNOLOGY, 2018–2021 (USD MILLION)
                                     TABLE 126 JAPAN: SMART AIRPORTS MARKET, BY AIRPORT TECHNOLOGY, 2022–2027 (USD MILLION)
             13.4.6 SOUTH KOREA
                        13.4.6.1 Need to upgrade ATMs at airports to drive market
                                     TABLE 127 SOUTH KOREA: SMART AIRPORTS MARKET, BY AIRPORT SIZE, 2018–2021 (USD MILLION)
                                     TABLE 128 SOUTH KOREA: SMART AIRPORTS MARKET, BY AIRPORT SIZE, 2022–2027 (USD MILLION)
                                     TABLE 129 SOUTH KOREA: SMART AIRPORTS MARKET, BY AIRPORT TECHNOLOGY, 2018–2021 (USD MILLION)
                                     TABLE 130 SOUTH KOREA: SMART AIRPORTS MARKET, BY AIRPORT TECHNOLOGY, 2022–2027 (USD MILLION)
             13.4.7 AUSTRALIA
                        13.4.7.1 Increase in air travel to aid market growth
                                     TABLE 131 AUSTRALIA: SMART AIRPORTS MARKET, BY AIRPORT SIZE, 2018–2021 (USD MILLION)
                                     TABLE 132 AUSTRALIA: SMART AIRPORTS MARKET, BY AIRPORT SIZE, 2022–2027 (USD MILLION)
                                     TABLE 133 AUSTRALIA: SMART AIRPORTS MARKET, BY AIRPORT TECHNOLOGY, 2018–2021 (USD MILLION)
                                     TABLE 134 AUSTRALIA: SMART AIRPORTS MARKET, BY AIRPORT TECHNOLOGY, 2022–2027 (USD MILLION)
             13.4.8 REST OF ASIA PACIFIC
                        13.4.8.1 Government support for implementation of smart technologies to drive market
                                     TABLE 135 REST OF ASIA PACIFIC: SMART AIRPORTS MARKET, BY AIRPORT SIZE, 2018–2021 (USD MILLION)
                                     TABLE 136 REST OF ASIA PACIFIC: SMART AIRPORTS MARKET, BY AIRPORT SIZE, 2022–2027 (USD MILLION)
                                     TABLE 137 REST OF ASIA PACIFIC: SMART AIRPORTS MARKET, BY AIRPORT TECHNOLOGY, 2018–2021 (USD MILLION)
                                     TABLE 138 REST OF ASIA PACIFIC: SMART AIRPORTS MARKET, BY AIRPORT TECHNOLOGY, 2022–2027 (USD MILLION)
     13.5 REST OF THE WORLD 
             13.5.1 REST OF THE WORLD: REGIONAL ANALYSIS
                        TABLE 139 REST OF THE WORLD: RECESSION IMPACT ANALYSIS
             13.5.2 PESTLE ANALYSIS: REST OF THE WORLD
                        FIGURE 45 REST OF THE WORLD: SMART AIRPORTS MARKET SNAPSHOT
                        TABLE 140 REST OF THE WORLD: SMART AIRPORTS MARKET, BY APPLICATION, 2018–2021 (USD MILLION)
                        TABLE 141 REST OF THE WORLD: SMART AIRPORTS MARKET, BY APPLICATION, 2022–2027 (USD MILLION)
                        TABLE 142 REST OF THE WORLD: SMART AIRPORTS MARKET, BY OPERATION, 2018–2021 (USD MILLION)
                        TABLE 143 REST OF THE WORLD: SMART AIRPORTS MARKET, BY OPERATION, 2022–2027 (USD MILLION)
                        TABLE 144 REST OF THE WORLD: SMART AIRPORTS MARKET, BY AIRPORT SIZE, 2018–2021 (USD MILLION)
                        TABLE 145 REST OF THE WORLD: SMART AIRPORTS MARKET, BY AIRPORT SIZE, 2022–2027 (USD MILLION)
                        TABLE 146 REST OF THE WORLD: SMART AIRPORTS MARKET, BY AIRPORT TECHNOLOGY, 2018–2021 (USD MILLION)
                        TABLE 147 REST OF THE WORLD: SMART AIRPORTS MARKET, BY AIRPORT TECHNOLOGY, 2022–2027 (USD MILLION)
                        TABLE 148 REST OF THE WORLD: SMART AIRPORTS MARKET, BY SYSTEM, 2018–2021 (USD MILLION)
                        TABLE 149 REST OF THE WORLD: SMART AIRPORTS MARKET, BY SYSTEM, 2022–2027 (USD MILLION)
                        TABLE 150 REST OF THE WORLD: SMART AIRPORTS MARKET, BY END MARKET, 2018–2021 (USD MILLION)
                        TABLE 151 REST OF THE WORLD: SMART AIRPORTS MARKET, BY END MARKET, 2022–2027 (USD MILLION)
                        TABLE 152 REST OF THE WORLD: SMART AIRPORTS MARKET, BY COUNTRY, 2018–2021 (USD MILLION)
                        TABLE 153 REST OF THE WORLD: SMART AIRPORTS MARKET, BY COUNTRY, 2022–2027 (USD MILLION)
             13.5.3 BRAZIL
                        13.5.3.1 Increase in demand from tourism industry to drive market
                                     TABLE 154 BRAZIL: SMART AIRPORTS MARKET, BY AIRPORT SIZE, 2018–2021 (USD MILLION)
                                     TABLE 155 BRAZIL: SMART AIRPORTS MARKET, BY AIRPORT SIZE 2022–2027 (USD MILLION)
                                     TABLE 156 BRAZIL: SMART AIRPORTS MARKET, BY AIRPORT TECHNOLOGY, 2018–2021 (USD MILLION)
                                     TABLE 157 BRAZIL: SMART AIRPORTS MARKET, BY AIRPORT TECHNOLOGY, 2022–2027 (USD MILLION)
             13.5.4 UAE
                        13.5.4.1 Development of large airports equipped with smart systems to drive market
                                     TABLE 158 UAE: SMART AIRPORTS MARKET, BY AIRPORT SIZE, 2018–2021 (USD MILLION)
                                     TABLE 159 UAE: SMART AIRPORTS MARKET, BY AIRPORT SIZE, 2022–2027 (USD MILLION)
                                     TABLE 160 UAE: SMART AIRPORTS MARKET, BY AIRPORT TECHNOLOGY, 2018–2021 (USD MILLION)
                                     TABLE 161 UAE: SMART AIRPORTS MARKET, BY AIRPORT TECHNOLOGY, 2022–2027 (USD MILLION)
             13.5.5 OTHERS IN ROW
                        13.5.5.1 Upgrades in international airports to boost market growth
                                     TABLE 162 OTHERS IN ROW: SMART AIRPORTS MARKET, BY AIRPORT SIZE 2018–2021 (USD MILLION)
                                     TABLE 163 OTHERS IN ROW: SMART AIRPORTS MARKET, BY AIRPORT SIZE, 2022–2027 (USD MILLION)
                                     TABLE 164 OTHERS IN ROW: SMART AIRPORTS MARKET, BY AIRPORT TECHNOLOGY, 2018–2021 (USD MILLION)
                                     TABLE 165 OTHERS IN ROW: SMART AIRPORTS MARKET, BY AIRPORT TECHNOLOGY, 2022–2027 (USD MILLION)
 
14 COMPETITIVE LANDSCAPE (Page No. - 167)
     14.1 INTRODUCTION 
     14.2 MARKET SHARE ANALYSIS OF KEY PLAYERS, 2021 
             TABLE 166 SMART AIRPORTS MARKET: DEGREE OF COMPETITION
             FIGURE 46 SHARE OF TOP PLAYERS IN SMART AIRPORTS MARKET, 2021
             TABLE 167 KEY DEVELOPMENTS BY LEADING PLAYERS IN SMART AIRPORTS MARKET, 2022
     14.3 RANKING ANALYSIS OF TOP FIVE PLAYERS, 2021 
             FIGURE 47 MARKET RANKING OF LEADING PLAYERS IN SMART AIRPORTS MARKET, 2021
             FIGURE 48 REVENUE ANALYSIS OF TOP FIVE MARKET PLAYERS, 2017–2021
     14.4 COMPETITIVE BENCHMARKING 
             TABLE 168 STRENGTH OF PRODUCT PORTFOLIO
             TABLE 169 BUSINESS STRATEGY EXCELLENCE
             TABLE 170 REGIONAL FOOTPRINT OF COMPANIES
     14.5 COMPANY EVALUATION QUADRANT 
             14.5.1 STARS
             14.5.2 EMERGING LEADERS
             14.5.3 PERVASIVE PLAYERS
             14.5.4 PARTICIPANTS
                        FIGURE 49 MARKET COMPETITIVE LEADERSHIP MAPPING, 2021
     14.6 START-UP/SME EVALUATION QUADRANT 
             14.6.1 PROGRESSIVE COMPANIES
             14.6.2 RESPONSIVE COMPANIES
             14.6.3 STARTING BLOCKS
             14.6.4 DYNAMIC COMPANIES
                        TABLE 171 SMART AIRPORTS MARKET: KEY STARTUPS/SMES
                        FIGURE 50 SMART AIRPORTS MARKET (START-UPS) COMPETITIVE LEADERSHIP MAPPING, 2021
     14.7 COMPETITIVE SCENARIOS AND TRENDS 
             14.7.1 MARKET EVALUATION FRAMEWORK
             14.7.2 PRODUCT LAUNCHES/DEVELOPMENTS
                        TABLE 172 SMART AIRPORTS MARKET: PRODUCT LAUNCHES/DEVELOPMENTS, MARCH 2019–JUNE 2022
             14.7.3 DEALS
                        TABLE 173 SMART AIRPORTS MARKET: DEALS, MARCH 2019–MARCH 2022
 
15 COMPANY PROFILES (Page No. - 185)
     15.1 INTRODUCTION 
(Business overview, Products/Solutions/Services offered, Recent developments & MnM View)*  
     15.2 KEY PLAYERS 
             15.2.1 SITA
                        TABLE 174 SITA: BUSINESS OVERVIEW
             15.2.2 THALES
                        TABLE 175 THALES: BUSINESS OVERVIEW
                        FIGURE 51 THALES: COMPANY SNAPSHOT
                        TABLE 176 THALES: PRODUCT LAUNCHES
                        TABLE 177 THALES: DEALS
             15.2.3 SIEMENS AG
                        TABLE 178 SIEMENS AG: BUSINESS OVERVIEW
                        FIGURE 52 SIEMENS AG: COMPANY SNAPSHOT
                        TABLE 179 SIEMENS AG: DEALS
             15.2.4 CISCO SYSTEMS, INC.
                        TABLE 180 LIEBHERR GROUP: BUSINESS OVERVIEW
                        FIGURE 53 CISCO SYSTEMS, INC.: COMPANY SNAPSHOT
             15.2.5 AMADEUS IT GROUP SA
                        TABLE 181 AMADEUS IT GROUP SA: BUSINESS OVERVIEW
                        FIGURE 54 AMADEUS IT GROUP SA: COMPANY SNAPSHOT
             15.2.6 RAYTHEON TECHNOLOGIES CORPORATION
                        TABLE 182 RAYTHEON TECHNOLOGIES CORPORATION: BUSINESS OVERVIEW
                        FIGURE 55 RAYTHEON TECHNOLOGIES CORPORATION: COMPANY SNAPSHOT
                        TABLE 183 RAYTHEON TECHNOLOGIES CORPORATION: PRODUCT LAUNCHES
                        TABLE 184 RAYTHEON TECHNOLOGIES CORPORATION: DEALS
             15.2.7 DAIFUKU CO., LTD.
                        TABLE 185 DAIFUKU CO., LTD.: BUSINESS OVERVIEW
                        FIGURE 56 DAIFUKU CO., LTD..: COMPANY SNAPSHOT
                        TABLE 186 DAIFUKU CO., LTD.: DEALS
             15.2.8 T-SYSTEMS
                        TABLE 187 T-SYSTEMS: BUSINESS OVERVIEW
             15.2.9 NATS LIMITED
                        TABLE 188 NATS LIMITED: BUSINESS OVERVIEW
                        FIGURE 57 NATS LIMITED: COMPANY SNAPSHOT
                        TABLE 189 NATS LIMITED: DEALS
             15.2.10 SABRE CORPORATION
                        TABLE 190 SABRE CORPORATION: BUSINESS OVERVIEW
                        FIGURE 58 SABRE CORPORATION: COMPANY SNAPSHOT
             15.2.11 IBM CORPORATION
                        TABLE 191 IBM CORPORATION: BUSINESS OVERVIEW
                        FIGURE 59 IBM CORPORATION: COMPANY SNAPSHOT
                        TABLE 192 IBM CORPORATION: DEALS
             15.2.12 L3HARRIS TECHNOLOGIES INC.
                        TABLE 193 L3HARRIS TECHNOLOGIES INC.: BUSINESS OVERVIEW
                        FIGURE 60 L3HARRIS TECHNOLOGIES INC.: COMPANY SNAPSHOT
             15.2.13 LEIDOS HOLDINGS, INC.
                        TABLE 194 LEIDOS HOLDINGS, INC.: BUSINESS OVERVIEW
                        FIGURE 61 LEIDOS HOLDINGS, INC.: COMPANY SNAPSHOT
             15.2.14 ASCENT TECHNOLOGIES, INC.
                        TABLE 195 ASCENT TECHNOLOGY, INC.: BUSINESS OVERVIEW
             15.2.15 WIPRO LIMITED
                        TABLE 196 WIPRO LIMITED: BUSINESS OVERVIEW
                        FIGURE 62 WIPRO LIMITED: -COMPANY SNAPSHOT
             15.2.16 HUAWEI TECHNOLOGIES CO., LTD.
                        TABLE 197 HUAWEI TECHNOLOGIES CO., LTD.: BUSINESS OVERVIEW
             15.2.17 INDRA SISTEMAS S.A.
                        TABLE 198 INDRA SISTEMAS S.A.: BUSINESS OVERVIEW
                        FIGURE 63 INDRA SISTEMAS S.A.: COMPANY SNAPSHOT
             15.2.18 INFAX INC.
                        TABLE 199 INFAX INC.: BUSINESS OVERVIEW
             15.2.19 SMART AIRPORT SYSTEMS (SAS)
                        TABLE 200 SMART AIRPORTS SYSTEMS (SAS): BUSINESS OVERVIEW
 
     15.3 OTHER PLAYERS 
             15.3.1 ZENSORS
                        TABLE 201 ZENSORS, INC.: BUSINESS OVERVIEW
             15.3.2 GORILLA TECHNOLOGY
                        TABLE 202 GORILLA TECHNOLOGY: BUSINESS OVERVIEW
             15.3.3 EMARTECH
                        TABLE 203 EMARTECH: BUSINESS OVERVIEW
             15.3.4 TAV TECHNOLOGIES
                        TABLE 204 TAV TECHNOLOGIES: BUSINESS OVERVIEW
*Details on Business overview, Products/Solutions/Services offered, Recent developments & MnM View might not be captured in case of unlisted companies.  
 
16 APPENDIX (Page No. - 238)
     16.1 DISCUSSION GUIDE 
     16.2 KNOWLEDGESTORE: MARKETSANDMARKETS’ SUBSCRIPTION PORTAL 
     16.3 CUSTOMIZATION OPTIONS 
     16.4 RELATED REPORTS 
     16.5 AUTHOR DETAILS 


The study involved four major activities in estimating the current market size for the Smart Airports market. Exhaustive secondary research was conducted to collect information on the market, the peer markets, and the parent market. The next step was to validate these findings, assumptions, and sizing with industry experts across the value chain through primary research. Both top-down and bottom-up approaches were employed to estimate the complete market size. Thereafter, market breakdown and data triangulation procedures were used to estimate the market size of segments and subsegments.

Secondary Research

In the secondary research process, various secondary sources, such as D&B Hoovers, Bloomberg, BusinessWeek, and different magazines, were referred to identify and collect information for this study. Secondary sources also included annual reports, press releases & investor presentations of companies, certified publications, articles by recognized authors, and simulator databases.

Primary Research

The Smart Airports market comprises several stakeholders, such as raw material providers, Smart Airports manufacturers and suppliers, and regulatory organizations in the supply chain. While the demand side of this market is characterized by various end users, the supply side is characterized by technological advancements in actuator technologies. Various primary sources from both the supply and demand sides of the market were interviewed to obtain qualitative and quantitative information. Following is the breakdown of primary respondents:
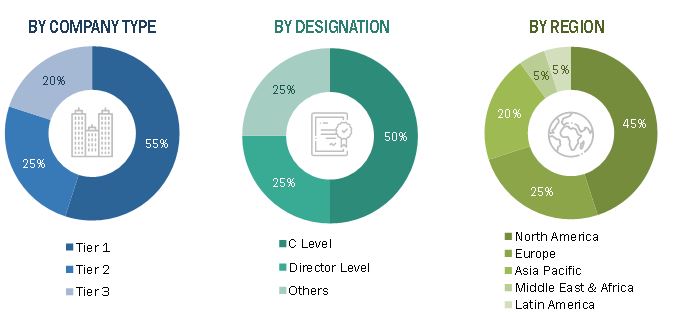
Smart airports Market Size, and Share

To know about the assumptions considered for the study, download the pdf brochure

Market Size Estimation

Both top-down and bottom-up approaches were used to estimate and validate the total size of the Smart Airport market. These methods were also used extensively to estimate the size of various subsegments of the market. The research methodology used to estimate the market size includes the following:

  • Key players in the industry and markets were identified through extensive secondary research.
  • The industry’s supply chain and market size, in terms of value, were determined through primary and secondary research processes.
  • All percentage shares, splits, and breakdowns were determined using secondary sources and verified through primary sources.

Market size Estimation Methodology: Bottom-Up Approach

The bottom-up approach was employed to arrive at the overall size of the smart airports market from the demand for such systems and components by end users in each country, and the average cost of integration for both brownfield and greenfield. These calculations led to the estimation of the overall market size.
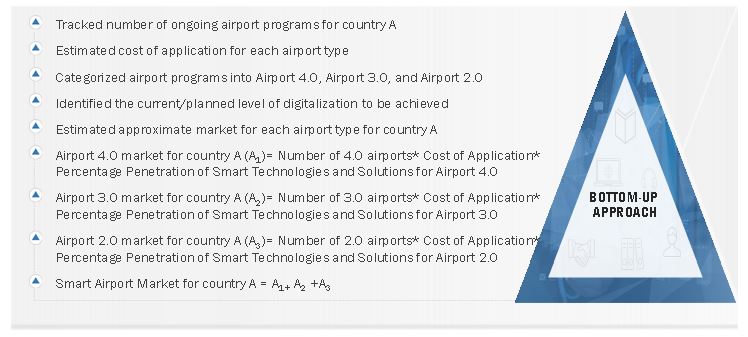
Smart airports Market Size, and Bottom-Up Approach

Market size Estimation Methodology: Top-Down Approach

In the top-down approach, the overall market size was used to estimate the size of the individual markets (mentioned in market segmentation) through percentage splits obtained from secondary and primary research.

The most appropriate and immediate parent market size was used to calculate the specific market segments to implement the top-down approach. The bottom-up approach was also implemented to validate the market segment revenues obtained.

A market share was then estimated for each company to verify the revenue share used earlier in the bottom-up approach. With data triangulation procedures and data validation through primaries, the overall parent market size and each market size were determined and confirmed in this study. The data triangulation procedure used for this study is explained in the market breakdown and triangulation section.

Smart airports Market Size, and Top-Down Approach

Data Triangulation

After arriving at the overall market size-using the market size estimation process explained above-the market was split into several segments and subsegments. Data triangulation and market breakdown procedures were employed, wherever applicable, to complete the overall market engineering process and arrive at the exact statistics of each market segment and subsegment. The data was triangulated by studying various factors and trends from both the demand and supply sides of the smart airports market.

Transforming Air Travel: The Growing Market for Smart Airport Systems and Intelligent Airports

The aviation industry is rapidly evolving, with technological advancements leading to the development of smart airport systems that improve efficiency and passenger experience. These intelligent airports are equipped with a range of cutting-edge technologies, including airport kiosks, biometric systems, and smart baggage handling systems.

Smart airport systems offer several benefits, including faster check-in and boarding processes, streamlined baggage handling, and improved security. Airport kiosks, for example, allow passengers to check in and print boarding passes, reducing wait times and eliminating the need for manual check-in processes. Biometric systems, such as facial recognition and fingerprint scanning, enable faster and more secure identity verification, reducing the risk of fraud and enhancing security.

In addition to improving passenger experience, smart airport systems also offer benefits for airlines and airport operators. For example, smart baggage handling systems use sensors and tracking technologies to ensure that baggage is transported efficiently and accurately, reducing the risk of lost or delayed baggage. This can improve airline efficiency and reduce costs associated with baggage handling.

Growth opportunities:

The smart airports market is expected to experience significant growth in the coming years, with increasing passenger traffic, technological advancements, and demand for efficient and sustainable airport operations driving this growth. With smart airport systems offering a range of benefits for passengers, airlines, and airport operators, there are many opportunities for companies to innovate and invest in this rapidly evolving industry. Key areas for growth include airport kiosks, biometric systems, and smart baggage handling systems, as well as other technologies that enhance efficiency, security, and the overall passenger experience. By capitalizing on these growth opportunities, companies can position themselves as leaders in the smart airports market and contribute to the continued transformation of the aviation industry.

Report Objectives

  • To identify and analyze key drivers, restraints, challenges, and opportunities influencing the growth of the Smart Airports market
  • To analyze the impact of macro and micro indicators on the market
  • To forecast the market size of segments for five regions, namely, North America, Europe, Asia Pacific, and Rest of the World, along with major countries in each of these regions
  • To strategically analyze micro markets with respect to individual technological trends, prospects, and their contribution to the overall market
  • To strategically profile key market players and comprehensively analyze their market ranking and core competencies
  • To provide a detailed competitive landscape of the market, along with an analysis of business and corporate strategies, such as contracts, agreements, partnerships, and expansions.
  • To identify detailed financial positions, key products, unique selling points, and key developments of leading companies in the market

Available customizations

Along with the market data, MarketsandMarkets offers customizations as per the specific needs of companies. The following customization options are available for the report:

Product Analysis

  • Product matrix, which gives a detailed comparison of the product portfolio of each company

Regional Analysis

  • Further breakdown of the market segments at country-level

Company Information

  • Detailed analysis and profiling of additional market players (up to 4)
Custom Market Research Services

We will customize the research for you, in case the report listed above does not meet with your exact requirements. Our custom research will comprehensively cover the business information you require to help you arrive at strategic and profitable business decisions.

Request Customization

Instant Answers with GPT - Ask Now!

Ask real questions. Get complete answers !
Report Code
AS 2788
Published ON
Dec, 2022
Choose License Type
BUY NOW
  • SHARE
X
Request Customization
Speak to Analyst
Speak to Analyst
OR FACE-TO-FACE MEETING
PERSONALIZE THIS RESEARCH
  • Triangulate with your Own Data
  • Get Data as per your Format and Definition
  • Gain a Deeper Dive on a Specific Application, Geography, Customer or Competitor
  • Any level of Personalization
REQUEST A FREE CUSTOMIZATION
LET US HELP YOU!
  • What are the Known and Unknown Adjacencies Impacting the Smart Airports Market
  • What will your New Revenue Sources be?
  • Who will be your Top Customer; what will make them switch?
  • Defend your Market Share or Win Competitors
  • Get a Scorecard for Target Partners
CUSTOMIZED WORKSHOP REQUEST
knowledgestore logo

Want to explore hidden markets that can drive new revenue in Smart Airports Market?

Find Hidden Markets
  • Call Us
  • +1-888-600-6441 (Corporate office hours)
  • +1-888-600-6441 (US/Can toll free)
  • +44-800-368-9399 (UK office hours)
CONNECT WITH US
ABOUT TRUST ONLINE
©2024 MarketsandMarkets Research Private Ltd. All rights reserved
DMCA.com Protection Status
Website Feedback