3D Printing Powder Market by Type (Metal, Plastic, Ceramic), by Application (Aerospace & Defense, Automotive, Medical & Dental, Others), by Geography (North America, Europe, Asia-Pacific, RoW) - Global Forecast to 2020


The 3D printing powder market, along with their end products, has witnessed a significant growth in the past few years. The increased number of technological developments is expected to fuel the growth of this market. Important patents for powder-based laser sintering technology, which is one of the cheapest technologies that uses metal powders to produce durable products, have expired in 2014. This will significantly contribute to the growth of 3D printing powder in the coming years.
The global market is estimated at USD 213.3 Million in 2015, and is expected to grow at a CAGR of 24.4% from 2015 to 2020.
The market has been segmented on the basis of its type, application, and region. The years considered for the study are:
Base Year – 2014
Estimated Year – 2015
Projected Year – 2020
Forecast Period – 2015 to 2020
For company profiles in the report, 2014 has been considered as the base year. Where information was unavailable for the base year, the year previous to that has been considered.
Research Methodology
This research study involves extensive usage of secondary sources, directories, and databases (such as Hoovers, Bloomberg, Businessweek, Factiva, and OneSource) to identify and collect information useful for this technical, market-oriented, and commercial aspects of 3D printing powder. The research methodology used for the report can be explained as follows.
- Analysis of country-wise volume of 3D printing powder for the past three years
- Analysis of the technology patents and its impact on market volume and technology
- Analysis of different powder manufacturers, industry associations, and aggregate volume of metal powder, plastic powder and ceramic powder
- Analysis of 3D printing powder peer market and 3D printing materials market
Overall market size values were finalized by triangulation with the supply side data, which includes product developments, supply chain, and trading volumes.
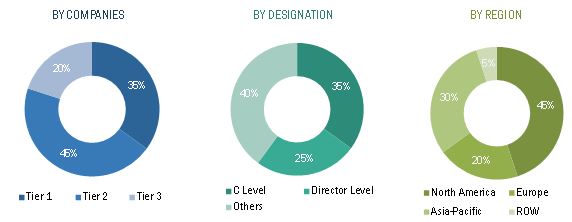
The figure below shows the breakdown of the primaries on the basis of company, designation, and region, conducted during the research study.
Market Ecosystem:
The ecosystem for 3D printing powder consists of suppliers and powder metallurgy manufacturers, including metal powders, plastic powders, and ceramic powders manufacturers.
Various powder manufacturers such as Sandvik, Carpenter, LPW Technology, and Erasteel are supply 3D printing powders to meet the demand of the market. The demand side for 3D printing powder market constitutes manufacturing and engineering companies, such as GE Aviation, Volvo, Surgical Clinics, and others. 3D printing powders are used by heavy industries for the manufacturing of component parts and end products. These components are then used in aircrafts, engines, or surgical implants.
Stakeholders
The stakeholder’s for the report include:
- Powder Manufacturers
- 3D Printer Manufacturers
- Aerospace & Defense Component Manufacturers
- Automotive Manufacturers
- Investors
- Entrepreneurs
- Technology Professionals
- Government Officials
- Policy Professionals
- Technology startups and Venture Capital Funds
- Angel investors
Scope of the Report:
By Type
- Metal Powder
- Plastic Powder
- Ceramic Powder
- Other Powders
By Application
- Aerospace Defense
- Automotive
- Medical Dental
- Others
By Region
- North America
- Europe
- Asia-Pacific
- RoW
Available Customizations:
Along with the given market data, MarketsandMarkets offers customizations as per the client’s specific needs. The following customization options are available for the report:
- Technical Analysis
- Low Cost Sourcing Locations
- Regulatory Framework
- Powder Usage Data
- Impact Analysis
- Trade Analysis
The global 3D printing powder market is projected to reach USD 636.9 Million by 2020, at a CAGR of 24.4% from 2015 to 2020. The growth of the market is primarily driven by the expiry of key patents for powder-based additive manufacturing in 2014 and increasing investments in research & development of powder-based technology.
3D printing or additive manufacturing is majorly used in the aerospace & defense industry, which requires high precision and quality products. 3D printing powders offer high compressibility and durability to manufactured products. These products are widely used in the industrial and commercial applications, due to their extensive properties. The aerospace & defense application segment is expected to contribute to the largest share in 2015. Automotive is expected to be the second-largest segment, followed by the medical and dental segments. With the reduction in technology costs, powder-based 3D printing will become accessible to other industries as well. This will lead to growth in other applications such as printing of consumer durable goods, accessories, and ornaments.
Based on type, the market has been classified into metal, plastic, ceramic, and others. Metal powders are mostly used in heavy engineering and fabrication works. The metal powder segment is expected to account for a major share of the market in 2015. Titanium powders (metal powders), due to their rigid structure and higher resistance to corrosion, are majorly used in aerospace & defense industry for manufacturing aircraft engine components. Metal powders are also used in automotive industry in tooling applications.
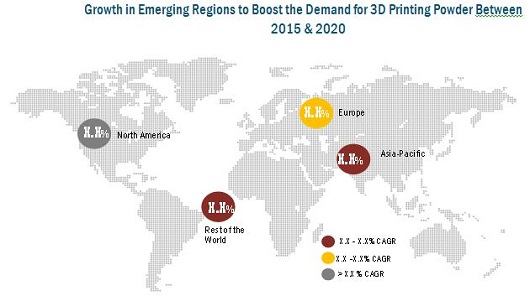
North America is expected to be the largest market for 3D printing powder market in 2015. Europe is one of the global manufacturing and commercial hub for powder metallurgy manufacturers. The manufacturers in this region have made large investment in the expansion of their capacities to meet the varied needs of the 3D printing market in the near future. The market in Row is expected to witness significant growth from 2015 to 2020. The increasing investments from technology startups and government agencies are projected drive the growth of the market in the coming years.
Some of the key players operating in global 3D printing powder market are Sandvik AB (Sweden), GKN Plc (U.S.), Carpenter Technology Corporation (U.S.), LPW Technology Ltd. (U.K.), Arcam AB (Sweden), and Erasteel Kloster AB (Sweden).
Powders used in additive manufacturing need to be atomized for use in high precision engineering applications. Supply of these specialized powders still remains a concern, which may restrain the growth runoff the market. Although powder-based 3D printers can serve in the most remote location in world, servicing these printers’ remains a challenge for powder-based 3D printer manufacturers.
 Exclusive indicates content/data unique to MarketsandMarkets and not available with any competitors.
Table of Contents
1 Introduction (Page No. - 11)
1.1 Objectives of the Study
1.2 Market Segmentation & Coverage
1.3 Stakeholders
2 Research Methodology (Page No. - 13)
2.1 Integrated Ecosystem of the Global Market
2.2 Arriving at the Global Market Size
2.2.1 Top-Down Approach
2.2.2 Bottom-Up Approach
2.2.3 Demand Side Approach
2.3 Assumptions
3 Executive Summary (Page No. - 18)
4 3D Printing Powder Market Overview (Page No. - 20)
4.1 Introduction
4.2 Market: Comparison With 3D Printing Material (Parent Market)
4.3 Market Drivers and Inhibitors
4.4 Key Market Dynamics
5 Market, By Application (Page No. - 26)
5.1 Introduction
5.2 Aerospace & Defense
5.3 Automotive
5.4 Medical & Dental
6 Market, By Type (Page No. - 34)
6.1 Introduction
6.2 Metal
6.3 Plastic
6.4 Ceramic
7 Market, By Geography (Page No. - 43)
7.1 Introduction
7.2 North America
7.2.1 By Application
7.2.2 By Type
7.3 Asia-Pacific
7.3.1 By Application
7.3.2 By Type
7.4 Europe
7.4.1 By Application
7.4.2 By Type
7.5 RoW
7.5.1 By Application
7.5.2 By Type
8 Competitive Landscape (Page No. - 65)
8.1 Company Presence in Market, By Type
8.2 Company Developments
8.2.1 Mergers, Acquisitions, and Partnerships
8.2.2 New Product Launches
8.2.3 Investments
9 Company Profiles (Page No. - 68)
(Overview, Financials, Products & Services, Strategy, and Developments)*
9.1 Sandvik AB
9.2 Carpenter Technology Corporation
9.3 LPW Technology
9.4 Arcam AB
9.5 Erasteel
9.6 EOS GmbH Electro Optical Systems
9.7 Arkema
9.8 Exone GmbH
9.9 Hoganas AB
9.10 GKN PLC
*Details on Overview, Financials, Product & Services, Strategy, and Developments Might Not Be Captured in Case of Unlisted Companies.
10 Appendix (Page No. - 89)
10.1 Customization Options
10.1.1 Technical Analysis
10.1.2 Low-Cost Sourcing Locations
10.1.3 Regulatory Framework
10.1.4 Powder Usage Data
10.1.5 Impact Analysis
10.1.6 Trade Analysis
10.1.7 Historical Data and Trends
10.2 Introducing RT: Real Time Market Intelligence
10.2.1 Rt Snapshot
10.3 Related Reports
List of Tables (53 Tables)
Table 1 3D Printing Powder Peer Market Size, 2014 (USD MN)
Table 2 3D Printing Powder Application Market, 2014 (USD MN)
Table 3 3D Printing Powder Market: Comparison With the Parent Market, 2013-2020 (USD MN)
Table 4 Market: Comparison With the Parent Market, 2013-2020 (MT)
Table 5 Market: Drivers and Inhibitors
Table 6 Market, By Application, 2013-2020 (USD MN)
Table 7 Market, By Application, 2013-2020 (MT)
Table 8 Market, By Type, 2013-2020 (USD MN)
Table 9 Market, By Type, 2013-2020 (MT)
Table 10 Market, By Geography, 2013-2020 (USD MN)
Table 11 Market, By Geography, 2013-2020 (MT)
Table 12 Market, By Application, 2013-2020 (USD MN)
Table 13 Market, By Application, 2013-2020 (MT)
Table 14 3D Printing Powder in Aerospace & Defense, By Geography, 2013 – 2020 (USD MN)
Table 15 3D Printing Powder in Aerospace & Defense, By Geography, 2013-2020 (MT)
Table 16 3D Printing Powder Market in Automotive, By Geography, 2013-2020 (USD MN)
Table 17 3D Printing Powder in Automotive, By Geography, 2013-2020 (MT)
Table 18 3D Printing Powder in Medical & Dental, By Geography, 2013–2020 (USD MN)
Table 19 3D Printing Powder in Medical & Dental, By Geography, 2013-2020 (MT)
Table 20 Market, By Type, 2013-2020 (USD MN)
Table 21 Market, By Type, 2013-2020 (MT)
Table 22 Market: Type Comparison With Powder Market, 2013-2020 (USD MN)
Table 23 Metal By Market, By Geography, 2013-2020 (USD MN)
Table 24 Metal By Market, By Geography, 2013-2020 (MT)
Table 25 Plastic By Market, By Geography, 2013-2020 (USD MN)
Table 26 Plastic By Market, By Geography, 2013-2020 (MT)
Table 27 Ceramic By Market, By Geography, 2013-2020 (USD MN)
Table 28 Ceramic By Market, By Geography, 2013-2020 (MT)
Table 29 Market, By Geography, 2013-2020 (USD MN)
Table 30 Market, By Geography, 2013-2020 (MT)
Table 31 North America 3D Printing Powder Market, By Application, 2013-2020 (USD MN)
Table 32 North America Market, By Application, 2013-2020 (MT)
Table 33 North America Market, By Type, 2013-2020 (USD MN)
Table 34 North America Market, By Type, 2013-2020 (MT)
Table 35 Asia-Pacific 3D Printing Powder Market, By Application, 2013-2020 (USD MN)
Table 36 Asia-Pacific Market, By Application, 2013-2020 (MT)
Table 37 Asia-Pacific Market, By Type, 2013-2020 (USD MN)
Table 38 Asia-Pacific Market, By Type, 2013-2020 (MT)
Table 39 Europe Market, By Application, 2013-2020 (USD MN)
Table 40 Europe Market, By Application, 2013-2020 (MT)
Table 41 Europe Market, By Type, 2013-2020 (USD MN)
Table 42 Europe Market, By Type, 2013-2020 (MT)
Table 43 RoW 3D Printing Powder Market, By Application, 2013-2020 (USD MN)
Table 44 RoW 3D Printing Powder Market, By Application, 2013-2020 (MT)
Table 45 RoW 3D Printing Powder Market, By Type, 2013-2020 (USD MN)
Table 46 RoW 3D Printing Powder Market, By Type, 2013-2020 (MT)
Table 47 Market: Mergers, Acquisitions, and Partnerships
Table 48 Market: New Product Launches
Table 49 Market: Investments
Table 50 Sandvik AB : Revenue, By Business Segment, 2010-2014 (USD MN)
Table 51 Carpenter Technology Corporation : Revenue, By Business Segment, 2010-2014 (USD MN)
Table 52 Arkema: Revenue, By Business Segment, 2010-2014 (USD MN)
Table 53 GKN PLC: Revenue, By Business Segment, 2010-2014 (USD MN)
List of Figures (60 Figures)
Figure 1 Global 3D Printing Powder Market: Segmentation & Coverage
Figure 2 Market: Integrated Ecosystem
Figure 3 Research Methodology
Figure 4 Top-Down Approach
Figure 5 Bottom-Up Approach
Figure 6 Demand Side Approach
Figure 7 Market Snapshot
Figure 8 Market: Growth Aspects
Figure 9 Market: Parent Market Comparison
Figure 10 Market, By Applications, 2015 & 2020
Figure 11 Market: Growth Analysis, By Type, 2013-2020 (%)
Figure 12 Market: Growth Analysis, By Geography, 2015 & 2020 (%)
Figure 13 3D Printing Powder : Application Market Scenario
Figure 14 Market, By Application, 2015 & 2020 (USD MN)
Figure 15 Market, By Application, 2015 & 2020 (MT)
Figure 16 Market in Aerospace & Defense, By Geography, 2015 & 2020 (USD MN)
Figure 17 Market in Automotive, By Geography, 2015 & 2020 (USD MN)
Figure 18 3D Printing Powder in Medical & Dental, By Geography, 2015 & 2020 (USD MN)
Figure 19 Market, By Type, 2015 & 2020 (USD MN)
Figure 20 Market, By Type, 2015 & 2020 (MT)
Figure 21 Market: Type Comparison, 2015 & 2020 (USD MN)
Figure 22 Metal 3D Printing Powder Market, By Geography, 2015 & 2020 (USD MN)
Figure 23 Plastic 3D Printing Powder Market, By Geography, 2015 & 2020 (USD MN)
Figure 24 Ceramic 3D Printing Powder Market, By Geography, 2015 & 2020 (USD MN)
Figure 25 Market: Growth Analysis, By Geography, 2015-2020 (USD MN)
Figure 26 Market: Growth Analysis, By Geography, 2015-2020 (MT)
Figure 27 North America 3D Printing Powder Market Overview, 2015 & 2020 (%)
Figure 28 North America Market, By Application, 2015 & 2020 (USD MN)
Figure 29 North America Market: Application Snapshot
Figure 30 North America Market, By Type, 2015 & 2020 (USD MN)
Figure 31 North America Market Share, By Type, 2015 & 2020 (%)
Figure 32 Asia-Pacific 3D Printing Powder Market Overview, 2015 & 2020 (%)
Figure 33 Asia-Pacific Market, By Application, 2015 & 2020 (USD MN)
Figure 34 Asia-Pacific Market: Application Snapshot
Figure 35 Asia-Pacific Market, By Type, 2015 & 2020 (USD MN)
Figure 36 Asia-Pacific Market Share, By Type, 2015 & 2020 (%)
Figure 37 Europe 3D Printing Powder Market Overview, 2015 & 2020 (%)
Figure 38 Europe Market, By Application, 2015 & 2020 (USD MN)
Figure 39 Europe Market: Application Snapshot
Figure 40 Europe Market, By Type, 2015 & 2020 (USD MN)
Figure 41 Europe Market Share, By Type, 2015 & 2020 (%)
Figure 42 RoW 3D Printing Powder Market Overview, 2015 & 2020 (%)
Figure 43 RoW Market, By Application, 2015 & 2020 (USD MN)
Figure 44 RoW Market: Application Snapshot
Figure 45 RoW Market , By Type, 2015 & 2020 (USD MN)
Figure 46 RoW Market Share, By Type, 2015 & 2020 (%)
Figure 47 Company Presence in Market, By Type, 2014
Figure 48 Sandvik AB: Revenue Mix, 2014 (%)
Figure 49 Sandvik AB: Sandvik Materials Technology Segment Revenue, 2010-2014 (USD MN)
Figure 50 Carpenter Technology Corporation: Business Revenue Mix, 2014 (%)
Figure 51 Carpenter Technology Corporation : Powder Metals Segment Revenue, 2010-2014 (USD MN)
Figure 52 Arcam AB : Revenue, 2010-2014 (USD MN)
Figure 53 Arkema: Revenue Mix, 2014 (%)
Figure 54 Arkema: High Performance Materials Segment Revenue, 2010-2014 (USD MN)
Figure 55 Exone GmbH: Business Revenue Mix, 2014 (%)
Figure 56 Exone GmbH: Revenue, 2010-2014 (USD MN)
Figure 57 Hoganas AB: Business Revenue Mix, 2012 (%)
Figure 58 Hoganas AB : Revenue, 2012-2014 (USD MN)
Figure 59 GKN PLC: Revenue Mix, 2014 (%)
Figure 60 GKN PLC : Powder Metallurgy Segment Revenue, 2010-2014 (USD MN)


Growth opportunities and latent adjacency in 3D Printing Powder Market