Venipuncture Procedure Analysis Market � By Success Rate (Total Venipuncture, Successful Venipuncture), Vein Type (Cephalic Vein, Median Cubital Vein, Basilic Vein), End Users (Hospitals (Private), Diagnostic Labs, Physicians Offices) - Global Forecast to 2021


[75 Pages Report] Venipuncture is the process of Blood Collection through venous access. This can be done by intravenous cannulation. The total venipuncture procedure includes the total number of cannulations performed, including successful and unsuccessful cannulation.
Venipuncture needle and syringes market is projected to reach USD 1,044.6 Million by 2021 from USD 790.8 Million in 2016, at a CAGR of 5.7% during the forecast period. The U.S. total venipuncture procedure volume contributed the largest share in 2016 and poised to grow at a CAGR of 1.8%.
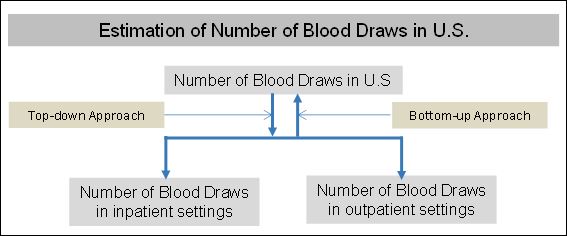
To estimation the total number of venipunctures, the bottom-up and top-down approaches were used. Besides, extensive primary research also has done from various key opinion leaders in the venipuncture procedures. The venipuncture procedures primarily depend on the medical condition of the patient and the experience and training of the technician performing the peripheral intravenous access.
The objectives of the venipuncture procedure analysis includes
- To study the total and successful number of venipuncture procedures/interventions in the U.S., Canada, the U.K. (including Ireland), Germany, France, Italy, Spain, Benelux (Belgium, the Netherlands, and Luxembourg), Nordic countries (Denmark, Finland, Iceland, Norway, and Sweden), Australia, Switzerland, and Austria
- To study the total and successful number of venipuncture procedures/interventions, segmented by cephalic vein, median cubital vein, basilic vein, and other veins (great saphenous, femoral, scalp, subclavian, and metacarpal veins)
- To study the total and successful number of venipuncture procedures/interventions, segmented by end user [hospitals (public and private), diagnostic laboratories, physician offices/clinics, and other end users (home care, long-term acute care, and nursing homes)]
- To provide detailed information regarding the major factors influencing the growth of venipuncture procedures (drivers, restraints, opportunities, and industry-specific challenges)
- To study the factors influencing the success rate of venipuncture procedure
Years considered for the study
|
Type |
Year |
|
Historical Years |
2014 |
|
Base Year |
2015 |
|
Estimated Year |
2016 |
|
Forecast Period |
2016–2021 |
Research methodology:
For the estimation of the total number of blood draws in the U.S., the bottom-up and top-down approaches were used
To know about the assumptions considered for the study, download the pdf brochure
Breakdown of Primaries:
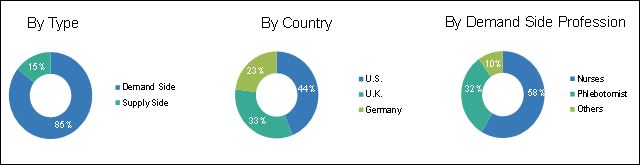
For this study, the primaries are broken down based on type, region, and profession of the primary.
Target Audience:
- Directors and Operational Heads in Hospitals and Blood Banks
- Physicians, Lab technicians, and Clinical Trial Investigators
- Various Research and Consulting Firms
- Research Institutes
- Hospitals, Clinical Laboratories, and Physician offices
- In and Out Patients
Segmentation of the study:
Venipuncture Procedure Analysis, by Vein Type
- Median Cubital Vein
- Cephalic Vein
- Basilic Vein
- Other Veins (Great Saphenous, Femoral, Scalp, Subclavian, and Metacarpal Veins)
Venipuncture Procedure Analysis, by End User
- Hospital (Public and Private)
- Diagnostic Laboratories
- Physician Offices/Clinics
- Other End Users (Home Care, Long-term Acute Care, and Nursing Homes)
Venipuncture Procedure Analysis, by Geography/Countries
- U.S.
- U.K.
- Germany
- France
- Canada
- Spain
- Italy
- Benelux (Belgium, the Netherlands, and Luxembourg)
- Nordic Countries (Denmark, Finland, Iceland, Norway, and Sweden)
- Australia
- Switzerland
- Austria
Venipuncture is the procedure of collecting blood from veins through venous access. Intravenous cannulation access is the method to get venous access for venipuncture. Distal to the antecubital fossa in deep-arm veins allows most successful cannulation. Moreover, medical condition of the patient and the experience and training of the technician performing the peripheral intravenous (PIV) access increases the success rate of PIV. Alternate approaches to attain cannulation include central venous catheterization (CVC), peripherally inserted central catheters, external jugular IVs, and ultrasound-guided vascular access.
Venipuncture needle and syringes market is projected to reach USD 1,044.6 Million by 2021 from USD 790.8 Million in 2016, at a CAGR of 5.7% during the forecast period. The U.S. total venipuncture procedure volume contributed the largest share in 2016 and poised to grow at a CAGR of 1.8%.
Factors such as aging population, cardiovascular disease death rate, pediatric population, chronic diseases conditions will make venipuncture difficult. It becomes difficult for patients with chronic diseases like diabetes, cancer, and cardiovascular conditions; thus, the increasing incidence of these diseases will increase the overall difficulty of the procedure. The lack of skilled professionals will also make venipuncture becomes difficult to perform.
Based on vein type, the venipuncture procedures of Canada are classified into median cubital vein, cephalic vein, basilic vein, and other veins. The other veins segment includes great saphenous, femoral, scalp, subclavian, and metacarpal veins. The procedures in each vein type are further divided into total venipuncture procedures and successful venipuncture procedures. In 2016, the median cubital vein segment is expected to account for the largest share of the venipuncture procedures.
Based on end user, the venipuncture procedures of France are classified into hospitals, diagnostic laboratories, physician office laboratories, and others. The others segment includes home care, long-term acute care, and nursing homes. The hospitals segment is accounted for the largest share of the venipuncture procedures in 2016.
Based on the vein type, the venipuncture procedures of Italy are divided into median cubital vein, cephalic vein, basilic vein, and other veins. The other veins segment includes great saphenous, femoral, scalp, subclavian, and metacarpal veins. In 2016, the median cubital vein segment is expected to account for the largest share of the venipuncture procedures. Based on end user, the Italian venipuncture procedures are segmented into hospitals, diagnostic laboratories, physician office laboratories, and others (home care, long-term acute care, and nursing homes). In 2016, the hospitals segment is expected to account for the largest share of the venipuncture procedure.
To speak to our analyst for a discussion on the above findings, click Speak to Analyst
 Exclusive indicates content/data unique to MarketsandMarkets and not available with any competitors.
Table of Contents
1 Introduction (Page No. - 10)
1.1 Objectives of the Study
1.1 Market Definition
2 Market Segmentation (Page No. - 13)
3 Research Methodology (Page No. - 15)
3.1 Research Methodology
3.1.1 Market Size Estimation
3.1.2 End User Analysis
3.1.3 Supplier Analysis
3.2 Market Breakdown and Data Triangulation
3.2.1 Venipuncture Procedure Analysis
3.2.2 Market Breakdown and Data Triangulation
4 Venipuncture Needles and Syringes Market, By Region (Page No. - 25)
4.1 Introduction
4.2 North America
4.2.1 U.S.
4.2.2 Canada
4.3 Europe
4.3.1 U.K.
4.3.2 Germany.
4.3.3 France
4.3.4 Rest of the Europe.
4.4 Rest of the World
5 Venipuncture Procedures: Market Overview (Page No. - 23)
5.1 Introduction
5.2 Factors Affecting Venipuncture Procedure
5.3 Global Burden of Lifestyle Diseases
5.4 Methods to Improve Venipuncture
6 Venipuncture Procedures: U.S (Page No. - 28)
6.1 U.S.: Venipuncture Procedure
6.2 U.S.: Venipuncture Procedure, By Vein Type
6.3 U.S.: Venipuncture Procedure, By End User
7 Venipuncture Procedures: U.K (Page No. - 32)
7.1 U.K.: Venipuncture Procedure
7.2 U.K.: Venipuncture Procedure, By Vein Type
7.3 U.K.: Venipuncture Procedure, By End User
8 Venipuncture Procedures: Germany (Page No. - 36)
8.1 Germany: Venipuncture Procedure
8.2 Germany: Venipuncture Procedure, By Vein Type
8.3 Germany: Venipuncture Procedure, By End User
9 Venipuncture Procedures: Canada (Page No. - 40)
9.1 Canada: Venipuncture Procedure
9.2 Canada: Venipuncture Procedure, By Vein Type
9.3 Canada: Venipuncture Procedure, By End User
10 Venipuncture Procedures: France (Page No. - 44)
10.1 France: Venipuncture Procedure
10.2 France: Venipuncture Procedure, By Vein Type
10.3 France: Venipuncture Procedure, By End User
11 Venipuncture Procedures: Italy (Page No. - 48)
11.1 Italy: Venipuncture Procedure
11.2 Italy: Venipuncture Procedure, By Vein Type
11.3 Italy: Venipuncture Procedure, By End User
12 Venipuncture Procedures: Switzerland (Page No. - 52)
12.1 Switzerland: Venipuncture Procedure
12.2 Switzerland: Venipuncture Procedure, By Vein Type
12.3 Switzerland: Venipuncture Procedure, By End User
13 Venipuncture Procedures: Austria (Page No. - 56)
13.1 Austria: Venipuncture Procedure
13.2 Austria: Venipuncture Procedure, By Vein Type
13.3 Austria: Venipuncture Procedure, By End User
14 Venipuncture Procedures: Spain (Page No. - 60)
14.1 Spain: Venipuncture Procedure
14.2 Spain: Venipuncture Procedure, By Vein Type
14.3 Spain: Venipuncture Procedure, By End User
15 Venipuncture Procedures: Nordic Countries (Page No. - 64)
15.1 Nordic Countries: Venipuncture Procedure
15.2 Nordic Countries: Venipuncture Procedure, By Vein Type
15.3 Nordic Countries: Venipuncture Procedure, By End User
16 Venipuncture Procedures: Australia (Page No. - 68)
16.1 Australia: Venipuncture Procedure
16.2 Australia: Venipuncture Procedure, By Vein Type
16.3 Australia: Venipuncture Procedure, By End User
17 Venipuncture Procedures: Benelux (Page No. - 72)
17.1 Benelux: Venipuncture Procedure
17.2 Benelux: Venipuncture Procedure, By Vein Type
17.3 Benelux: Venipuncture Procedure, By End User
List of Tables (43 Tables)
Table 1 Factors Affecting Venipuncture (%)
Table 2 Global Burden of Lifestyle Diseases
Table 3 Methods to Improve Venipuncture
Table 4 Global Venipuncture Needles and Syringes Market, 2014-2021 (USD Million)
Table 5 Venipuncture Needles and Syringes Market, By Region, 2014-2021 (USD Million)
Table 6 North America: Venipuncture Needles and Syringes Market, By Country, 2014-2021 (USD Million)
Table 7 Europe: Venipuncture Needles and Syringes Market, By Country, 2014-2021, (USD Million)
Table 8 U.S.: Total vs Successful Venipuncture Procedure, 2014–2021 (Million)
Table 9 U.S.: Total vs Successful Venipuncture Procedure, By Vein, 2014–2021 (Million)
Table 10 U.S.: Total vs Successful Venipuncture Procedure, By End User, 2014–2021 (Million)
Table 11 U.K.: Total vs Successful Venipuncture Procedure, 2014–2021 (Million)
Table 12 U.K.: Total vs Successful Venipuncture Procedure, By Vein, 2014–2021 (Million)
Table 13 U.K.: Total vs Successful Venipuncture Procedure, By End User, 2014–2021 (Million)
Table 14 Germany: Total vs Successful Venipuncture Procedure, 2014–2021 (Million)
Table 15 Germany: Total vs Successful Venipuncture Procedure, By Vein, 2014–2021 (Million)
Table 16 Germany: Total vs Successful Venipuncture Procedure, By End User, 2014–2021 (Million)
Table 17 Canada: Total vs Successful Venipuncture Procedure, 2014–2021 (Million)
Table 18 Canada: Total vs Successful Venipuncture Procedure, By Vein, 2014–2021 (Million)
Table 19 Canada: Total vs Successful Venipuncture Procedure, By End User, 2014–2021 (Million)
Table 20 France: Total vs Successful Venipuncture Procedure, 2014–2021 (Million)
Table 21 France: Total vs Successful Venipuncture Procedure, By Vein, 2014–2021 (Million)
Table 22 France: Total vs Successful Venipuncture Procedure, By End User, 2014–2021 (Million)
Table 23 Italy: Total vs Successful Venipuncture Procedure, 2014–2021 (Million)
Table 24 Italy: Total vs Successful Venipuncture Procedure, By Vein, 2014–2021 (Million)
Table 25 Italy: Total vs Successful Venipuncture Procedure, By End User, 2014–2021 (Million)
Table 26 Switzerland: Total vs Successful Venipuncture Procedure, 2014–2021 (Million)
Table 27 Switzerland: Total vs Successful Venipuncture Procedure, By Vein, 2014–2021 (Million)
Table 28 Switzerland: Total vs Successful Venipuncture Procedure, By End User, 2014–2021 (Million)
Table 29 Austria: Total vs Successful Venipuncture Procedure, 2014–2021 (Million)
Table 30 Austria: Total vs Successful Venipuncture Procedure, By Vein, 2014–2021 (Million)
Table 31 Austria: Total vs Successful Venipuncture Procedure, By End User, 2014–2021 (Million)
Table 32 Spain: Total vs Successful Venipuncture Procedure, 2014–2021 (Million)
Table 33 Spain: Total vs Successful Venipuncture Procedure, By Vein, 2014–2021 (Million)
Table 34 Spain: Total vs Successful Venipuncture Procedure, By End User, 2014–2021 (Million)
Table 35 Nordic Countries: Total vs Successful Venipuncture Procedure, 2014–2021 (Million)
Table 36 Nordic Countries: Total vs Successful Venipuncture Procedure, By Vein, 2014–2021 (Million)
Table 37 Nordic Countries: Total vs Successful Venipuncture Procedure, By End User, 2014–2021 (Million)
Table 38 Australia: Total vs Successful Venipuncture Procedure, 2014–2021 (Million)
Table 39 Australia: Total vs Successful Venipuncture Procedure, By Vein, 2014–2021 (Million)
Table 40 Australia: Total vs Successful Venipuncture Procedure, By End User, 2014–2021 (Million)
Table 41 Benelux: Total vs Successful Venipuncture Procedure, 2014–2021 (Million)
Table 42 Benelux: Total vs Successful Venipuncture Procedure, By Vein, 2014–2021 (Million)
Table 43 Benelux: Total vs Successful Venipuncture Procedure, By End User, 2014–2021 (Million)
List of Figures (69 Figures)
Figure 1 Aging Population 2014 (Above 65 Years)
Figure 2 CVD Death Rate 2012
Figure 3 Pediatric Population 2014 (0-14 Years)
Figure 4 Estimated New Cancer Cases 2015
Figure 5 Prevalence of Obesity 2014
Figure 6 Diabetes Prevalence in Adults 2015
Figure 7 Venipuncture Needles and Syringes Market, By Region, (USD Million)
Figure 8 North America: Venipuncture Needles and Syringes Market, By Country, (USD Million)
Figure 9 Europe: Venipuncture Needles and Syringes Market, By Country, (USD Million)
Figure 10 U.S.: Total vs Successful Venipuncture Procedures, 2016 (Million)
Figure 11 U.S.: Total Venipuncture Procedures, By Vein, 2016 (Million)
Figure 12 U.S.: Successful Venipuncture Procedures, By Vein, 2016 (Million)
Figure 13 Total Venipunctures vs Successful Venipunctures, By End User, 2016 (Million)
Figure 14 Successful Venipunctures: Private vs Public Hospitals, 2016
Figure 15 U.K.: Total vs Successful Venipuncture Procedures, 2016 (Million)
Figure 16 U.K.: Total Venipuncture Procedures, By Vein, 2016 (Million)
Figure 17 U.K.: Successful Venipuncture Procedures, By Vein, 2016 (Million)
Figure 18 Total Venipunctures vs Successful Venipunctures, By End User, 2016 (Million)
Figure 19 Successful Venipunctures: Private vs Public Hospitals, 2016
Figure 20 Germany: Total vs Successful Venipuncture Procedures, 2016 (Million)
Figure 21 Germany: Total Venipuncture Procedures, By Vein, 2016 (Million)
Figure 22 Germany: Successful Venipuncture Procedures, By Vein, 2016 (Million)
Figure 23 Total Venipunctures vs Successful Venipunctures, By End User, 2016 (Million)
Figure 24 Successful Venipunctures: Private vs Public Hospitals, 2016
Figure 25 Canada: Total vs Successful Venipuncture Procedures, 2016 (Million)
Figure 26 Canada: Total Venipuncture Procedures, By Vein, 2016 (Million)
Figure 27 Canada: Successful Venipuncture Procedures, By Vein, 2016 (Million)
Figure 28 Total Venipunctures vs Successful Venipunctures, By End User, 2016 (Million)
Figure 29 Successful Venipunctures: Private vs Public Hospitals, 2016
Figure 30 France: Total vs Successful Venipuncture Procedures, 2016 (Million)
Figure 31 France: Total Venipuncture Procedures, By Vein, 2016 (Million)
Figure 32 France: Successful Venipuncture Procedures, By Vein, 2016 (Million)
Figure 33 Total Venipunctures vs Successful Venipunctures, By End User, 2016 (Million)
Figure 34 Successful Venipunctures: Private vs Public Hospitals, 2016
Figure 35 Italy: Total vs Successful Venipuncture Procedures, 2016 (Million)
Figure 36 Italy: Total Venipuncture Procedures, By Vein, 2016 (Million)
Figure 37 Italy: Successful Venipuncture Procedures, By Vein, 2016 (Million)
Figure 38 Total Venipunctures vs Successful Venipunctures, By End User, 2016 (Million)
Figure 39 Successful Venipunctures: Private vs Public Hospitals, 2016
Figure 40 Switzerland: Total vs Successful Venipuncture Procedures, 2016 (Million)
Figure 41 Switzerland: Total Venipuncture Procedures, By Vein, 2016 (Million)
Figure 42 Switzerland: Successful Venipuncture Procedures, By Vein, 2016 (Million)
Figure 43 Total Venipunctures vs Successful Venipunctures, By End User, 2016 (Million)
Figure 44 Successful Venipunctures: Private vs Public Hospitals, 2016
Figure 45 Austria: Total vs Successful Venipuncture Procedures, 2016 (Million)
Figure 46 Austria: Total Venipuncture Procedures, By Vein, 2016 (Million)
Figure 47 Austria: Successful Venipuncture Procedures, By Vein, 2016 (Million)
Figure 48 Total Venipunctures vs Successful Venipunctures, By End User, 2016 (Million)
Figure 49 Successful Venipunctures: Private vs Public Hospitals, 2016
Figure 50 Spain: Total vs Successful Venipuncture Procedures, 2016 (Million)
Figure 51 Spain: Total Venipuncture Procedures, By Vein, 2016 (Million)
Figure 52 Spain: Successful Venipuncture Procedures, By Vein, 2016 (Million)
Figure 53 Total Venipunctures vs Successful Venipunctures, By End User, 2016 (Million)
Figure 54 Successful Venipunctures: Private vs Public Hospitals, 2016
Figure 55 Nordic Countries: Total vs Successful Venipuncture Procedures, 2016 (Million)
Figure 56 Nordic Countries: Total Venipuncture Procedures, By Vein, 2016 (Million)
Figure 57 Nordic Countries: Successful Venipuncture Procedures, By Vein, 2016 (Million)
Figure 58 Total Venipunctures vs Successful Venipunctures, By End User, 2016 (Million)
Figure 59 Successful Venipunctures, By End User, 2016
Figure 60 Australia: Total vs Successful Venipuncture Procedures, 2016 (Million)
Figure 61 Australia: Total Venipuncture Procedures, By Vein, 2016 (Million)
Figure 62 Australia: Successful Venipuncture Procedures, By Vein, 2016 (Million)
Figure 63 Total Venipunctures vs Successful Venipunctures, By End User, 2016 (Million)
Figure 64 Successful Venipunctures, By End User, 2016
Figure 65 Benelux: Total vs Successful Venipuncture Procedures, 2016 (Million)
Figure 66 Benelux: Total Venipuncture Procedures, By Vein, 2016 (Million)
Figure 67 Benelux: Successful Venipuncture Procedures, By Vein, 2016 (Million)
Figure 68 Total Venipunctures vs Successful Venipunctures, By End User, 2016 (Million)
Figure 69 Total Venipunctures, By End User, 2016

 Generating Response ...


Growth opportunities and latent adjacency in Venipuncture Procedure Analysis Market