Vacuum Contactor Market

Vacuum Contactor Market by Voltage Rating (1-5kV, 5.1-10kV, 10.1-15kV, 15.1-24kV), Configuration (Contactor, Contactor Fuse Combination), Application (Motors, Transformers, Capacitors, Reactors, Resistive Loads), End Users, Region - Global Forecast to 2028

Report Code: EP 3621 Aug, 2023, by marketsandmarkets.com

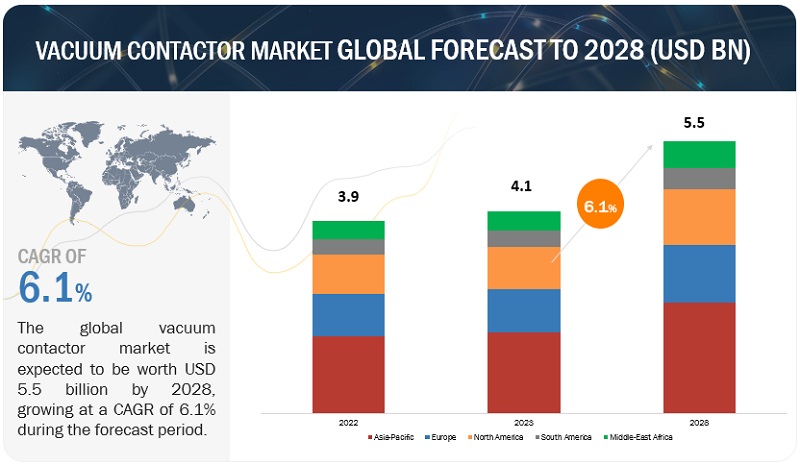
[224 Pages Report] The vacuum contactor market is expected to witness significant growth, with an estimated value of USD 4.1 billion in 2023 and a projected reach of USD 5.5 billion by 2028, exhibiting a Compound Annual Growth Rate (CAGR) of 6.1%. The driving force behind the expansion of the vacuum contactor market is the rising need for dependable and effective electrical control solutions across a wide range of industries and use cases.
Vacuum Contactor Market

To know about the assumptions considered for the study, Request for Free Sample Report
Vacuum Contactor Market

To know about the assumptions considered for the study, download the pdf brochure

Market Dynamics

Driver: Empowering Electrical Control

The rapid progression of industrialization and the concurrent expansion of manufacturing sectors have brought about a heightened necessity for precise motor control and the safeguarding of circuits. This has consequently resulted in an escalated demand for vacuum contactors, which play an instrumental role in meeting these requirements. The surge in urbanization and the ambitious scope of infrastructure projects underscore the significance of streamlined and efficient electrical systems. Within this context, vacuum contactors emerge as crucial components, ensuring the dependable and secure functioning of operations.

The intrinsic capability of vacuum contactors to enable meticulous control over motors and equipment is pivotal in achieving optimal energy consumption levels while simultaneously curtailing unnecessary wastage. By facilitating such controlled management, vacuum contactors contribute significantly to bolstering energy efficiency, aligning with contemporary sustainability objectives. Moreover, their incorporation serves as a robust defense mechanism, diligently protecting circuits from disruptions and faults, thus elevating the overall safety quotient.

Restraints: Factors Limiting the Market Acceptance of Vacuum Contactors

Vacuum contactors encounter several constraints that can influence their market acceptance and adoption. One significant aspect is the relatively higher initial costs associated with vacuum contactors in comparison to conventional contactors. This financial disparity can act as a deterrent for budget-conscious buyers, potentially steering them towards more economical alternatives. Moreover, the proper installation, maintenance, and operation of vacuum contactors often necessitate a specialized level of technical expertise. This requirement can result in the need for additional training and contribute to operational complexities. This challenge not only affects the initial setup but can also impact the ongoing management of these components within electrical systems. A noteworthy restraint lies in the realm of awareness and understanding. Despite the notable benefits that vacuum contactors offer, a lack of awareness about their advantages and applications persists within specific industries or regions. This limited knowledge can hinder their adoption as potential users may be more inclined to stick with familiar options or technologies.

The presence of alternative technologies poses another constraint. Technologies like solid-state relays or different contactor types may present competitive solutions tailored for certain applications. This technological diversity adds another layer of consideration for potential buyers, potentially diverting demand away from vacuum contactors. Additionally, the adoption and integration of vacuum contactors can be impacted by the regulatory landscape. Different regions may have distinct regulatory requirements or standards that must be met for compliance. Negotiating these varying regulatory frameworks can add intricacy to the process of incorporating vacuum contactors into diverse electrical systems.

 In conclusion, while vacuum contactors offer significant advantages, these constraints—ranging from cost considerations and technical expertise demands to awareness gaps, alternative technologies, and regulatory variations—highlight the multifaceted challenges that influence their widespread adoption and integration within the market..

Opportunities: Harnessing the Potential of Vacuum Contactors in Smart Grids, IoT, and Emerging Markets

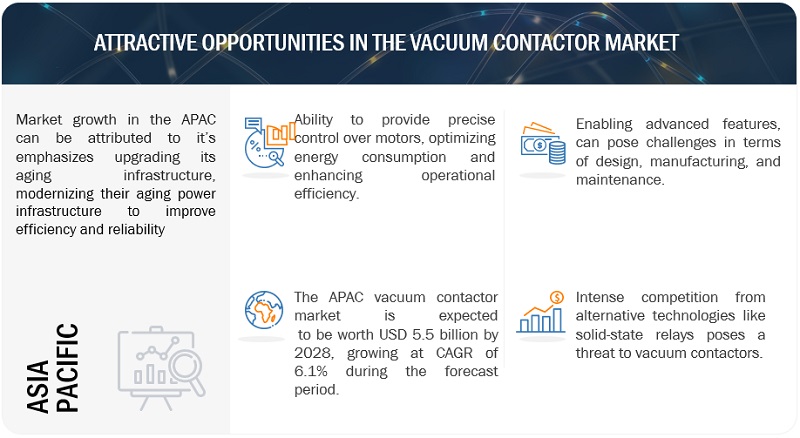
Vacuum contactors possess a remarkable capacity for achieving precise control over motors, thereby enabling the optimization of energy consumption. Manufacturers can capitalize on this capability to augment the energy efficiency attributes of vacuum contactors, aligning seamlessly with the growing emphasis on sustainability and the reduction of energy waste. In tandem with the progression of electrical systems into more sophisticated and interconnected configurations, there emerges a promising prospect of integrating vacuum contactors into smart grid solutions. This integration would usher in the potential for remote monitoring, control, and diagnostics, thereby elevating operational efficiency and curtailing instances of downtime.

Moreover, the fusion of vacuum contactors with industrial automation systems and the expansive realm of the Internet of Things (IoT) can pave the way for a heightened level of automation, insights derived from data, and anticipatory maintenance practices. Consequently, this convergence holds the promise of bolstering the comprehensive performance and reliability of entire systems. An avenue rife with growth potential for manufacturers of vacuum contactors lies in penetrating burgeoning markets characterized by rapid industrialization and the development of critical infrastructure. Notable examples encompass certain regions within Asia, Africa, and South America, where significant opportunities for expansion are abound.

The trajectory of ongoing research and development endeavors stands poised to yield innovative breakthroughs in the realm of vacuum contactor technology. These advancements are anticipated to yield enhanced levels of performance, bolstered reliability, and a more cost-effective operational landscape.Promoting awareness and understanding of the manifold advantages and applications intrinsic to vacuum contactors is instrumental in stimulating demand and ultimately galvanizing market growth. Through collaborative endeavors with fellow industry stakeholders, including manufacturers of electrical equipment, utility companies, and providers of cutting-edge technologies, the potential to devise synergistic solutions and garner heightened exposure within the market is considerably augmented.

Challenges: Aging of lithium-ion batteries

The intricate nature of vacuum contactor technology poses challenges in design, manufacturing, and maintenance, potentially hindering smooth integration. Specialized expertise is essential throughout the product lifecycle, impacting resource allocation and operational efficiency. Growing demand for low-voltage vacuum contactors is driven by their efficiency and durability in industrial electrical systems. Solid-state relays are emerging as alternatives due to their compactness, resilience, and longer lifespan.

Complex features like integrated protection circuits and digital communication enhance contactor market functionality but raise development and manufacturing costs, requiring a balance between innovation and affordability. As vacuum contactors evolve amidst competition, finding equilibrium between innovation, function, and cost shapes their role in modern industrial systems.

Vacuum Contactor Market Ecosystem

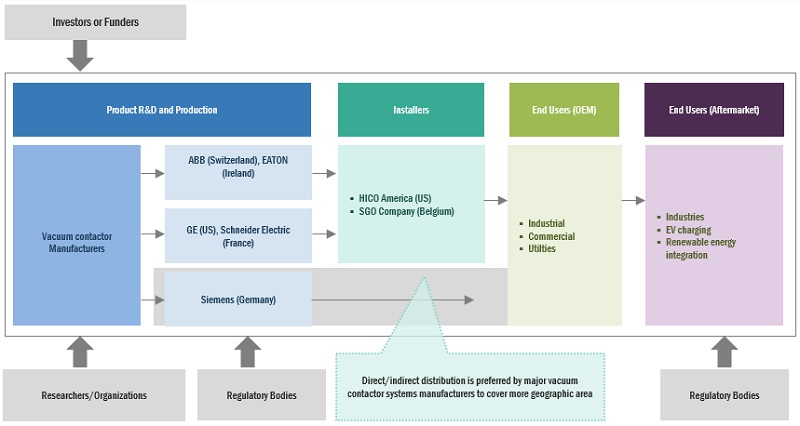
Dominant players in this sector comprise established and financially robust vacuum contactor manufacturers and component providers. These firms boast extensive market experience, diverse product ranges, cutting-edge technologies, and robust worldwide sales and marketing networks. Notable entities encompass Eaton (Ireland), ABB (Switzerland), Siemens (Germany), GE (US), and Schneider Electric (France).
Vacuum Contactor Market

By application, the capacitors is expected to grow at the fastest rate during the forecast period.

From 2023 to 2028, the capacitors are projected to exhibit the highest growth rate compared to other applications. Rising infrastructure development, automation, stability enhancement, and energy savings in power systems are driving capacitor demand. The vacuum contactors market for capacitors is growing due to increased usage, reliable switching for capacitor banks, and specialized vacuum contactor designs for capacitors.

By power rating, the 1-5 kV segment is expected to hold the largest share during the forecast period.

Throughout the forecast period, the 1-5 kV segment is anticipated to maintain its leading position in terms of market share. Market growth for vacuum contactors is propelled by expanding infrastructure, transmission loss reduction, and industrial distribution advancements. Increasing awareness about harmonics, power factor correction, and commutation failure prevention is boosting demand for 1KV-5KV vacuum contactors in residential and commercial applications.

By End User, utilities segment is expected to grow the fastest, during the forecast period.

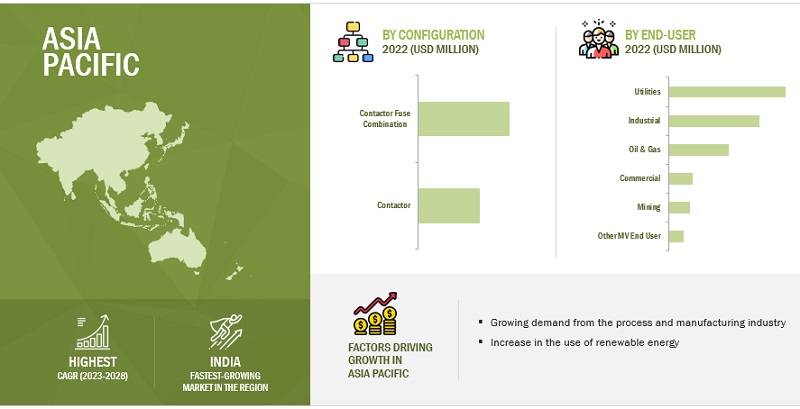
The vacuum contactor market is segmented based on end user, which includes utilities, industrial, oil & gas, commercial, mining and others. Among these segments, the utilities segment is experiencing significant growth. The utilities sector encompasses power generation and transmission in wind, solar, and hydropower industries. Growing demand for electricity and services, along with new electrical devices, drives this sector. Vacuum contactors play a vital role by providing dependable power switching and motor starting solutions for reliable electricity supply in power plants. Vacuum contactors find applications in blowers, water pumping, conveyors, capacitor switching, and various power switching tasks within the utilities sector.

Asia Pacific is expected to be the largest market during the forecast period.

During the forecast time frame, Asia Pacific is anticipated to be the largest and fastest-growing regional market for vacuum contactor. The Asia-Pacific region is experiencing rapid industrialization, urbanization, and infrastructure development, driving increased energy demand. This surge in activity necessitates efficient power distribution and control, leading to a higher demand for vacuum contactors. Additionally, emerging markets, favorable government policies, and growing awareness of energy efficiency contribute to the region's significant growth in the vacuum contactor market.
Vacuum Contactor Market Size, and Share

Key Market Players

The vacuum contactor market is primarily led by prominent entities including Eaton (Ireland), ABB (Switzerland), Schneider Electric (France), Siemens (Germany), and GE (US). During the period spanning 2018 to 2022, these companies have strategically employed tactics such as introducing new products, forging contracts, establishing agreements, entering partnerships, facilitating collaborations, pursuing acquisitions, and expanding operations to bolster their market presence within the vacuum contactor industry.

Want to explore hidden markets that can drive new revenue in Vacuum Contactor Market?

Scope of the Report

Report Metric

Details

Market size available for years

2021–2028

Base year considered

2022

Forecast period

2023–2028

Forecast units

Value (USD Million)

Segments covered

Configuration, application, voltage rating, end-user, and region

Geographies covered

North America, Europe, Asia Pacific, South America and Middle East & Africa.

Companies covered

ABB Ltd (Switzerland), Siemens AG (Germany), Eaton Corporation plc (Dublin, Ireland), Toshiba Corporation (Japan), Mitsubishi Electric Corporation (Japan), Schneider Electric SE (France), Larsen & Toubro Limited (India), Rockwell Automation, Inc. (US), Crompton Greaves Limited (India), LS Industrial Systems Co., Ltd (South Korea), Joslyn Clark (US), Meidensha Corporation (Japan), Ampcontrol Pty Ltd (Australia), ARTECHE Group (Spain), Yueqing Liyond Electric Co., Ltd. (China), Fuji Electric (Japan), Xiamen Huadian Switchgear Co., Ltd. (China), TDK Electronics AG (Germany), ZHIYUE GROUP CO., LTD (China), Wuxi Haibang Mechanical & Electrical Manufacturing Co., Ltd (China).

This research report categorizes the vacuum contactor market by configuration, application, voltage rating, end-user, and region.

On the basis of configuration:
  • Contactor
  • Contactor fuse combination
On the basis of application:
  • Motors
  • Transformers
  • Capacitors
  • Reactors
  • Resistive loads
  • Other medium voltage equipment
On the basis of voltage rating:
  • 1KV–5KV
  • 5.1KV–10KV
  • 10.1KV–15KV
  • 15.1KV–24KV
On the basis of end user:
  • Utilities
  • Industrial
  • Oil & gas
  • Commercial
  • Mining
  • Others
On the basis of region:
  • North America
  • Europe
  • Asia Pacific
  • South America
  • Middle East & Africa

Recent Developments

  • In July 2022, TDK collaborates with students across diverse universities to cultivate innovative and sustainable mobility visions for the future. Through its sponsorship initiatives, TDK is championing the advancement of concepts encompassing Hyperloop technology, solar-powered solutions, and electric vehicles. TDK's involvement extends beyond mere support, encompassing the provision of components, expertise, and financial backing. Presently, teams at prestigious institutions like ETH Zurich in Switzerland, Leuven University of Technology in Belgium, and Aalen University of Applied Sciences in Germany are reaping the benefits of this comprehensive engagement.
  • In January 2023, TDK has revealed its acquisition of Qeexo, Co., a notable pioneer in the realm of automated machine learning (ML) platforms, particularly focusing on tinyML models tailored for low-power, persistent intelligent devices. This strategic acquisition underscores TDK's ambition to fortify its ML prowess and optimize the process of ML application development, positioning the company as a front-runner in furnishing intelligent edge solution.
  • In May 2023, Ampcontrol, now under full ownership of investment firm Washington H. Soul Pattinson since 2022, has marked its inaugural acquisition by procuring Androck Engineering & Mining Pty Limited, a Hunter-based enterprise. This deliberate acquisition harmonizes seamlessly with Ampcontrol's strategic trajectory for amplifying its presence and influence in the renewable energy manufacturing arena. It serves as a tangible manifestation of Ampcontrol's dedication to facilitating the worldwide shift toward a low-carbon economy.

Frequently Asked Questions (FAQ):

To speak to our analyst for a discussion on the above findings, click Speak to Analyst

Exclusive indicates content/data unique to MarketsandMarkets and not available with any competitors.

TABLE OF CONTENTS
 
1 INTRODUCTION (Page No. - 24)
    1.1 STUDY OBJECTIVES 
    1.2 MARKET DEFINITION 
    1.3 INCLUSIONS AND EXCLUSIONS 
           1.3.1 VACUUM CONTACTOR MARKET, BY CONFIGURATION
           1.3.2 MARKET, BY APPLICATION
           1.3.3 MARKET, BY VOLTAGE RATING
           1.3.4 MARKET, BY VERTICAL
           1.3.5 MARKET, BY REGION
    1.4 MARKETS COVERED 
    1.5 REGIONAL SCOPE 
    1.6 YEARS CONSIDERED 
    1.7 CURRENCY CONSIDERED 
    1.8 LIMITATIONS 
    1.9 STAKEHOLDERS 
    1.10 SUMMARY OF CHANGES 
    1.11 RECESSION IMPACT 
 
2 RESEARCH METHODOLOGY (Page No. - 31)
    2.1 RESEARCH DATA 
           FIGURE 1 VACUUM CONTACTOR MARKET: RESEARCH DESIGN
    2.2 DATA TRIANGULATION 
           FIGURE 2 DATA TRIANGULATION METHODOLOGY
           2.2.1 SECONDARY DATA
                    2.2.1.1 Key data from secondary sources
           2.2.2 PRIMARY DATA
                    2.2.2.1 Breakdown of primaries
                               FIGURE 3 KEY INDUSTRY INSIGHTS
                               FIGURE 4 BREAKDOWN OF PRIMARIES
                               FIGURE 5 MAIN METRICS CONSIDERED WHILE ANALYZING AND ASSESSING DEMAND FOR VACUUM CONTACTORS
    2.3 MARKET SIZE ESTIMATION 
           2.3.1 BOTTOM-UP APPROACH
                    FIGURE 6 MARKET SIZE ESTIMATION METHODOLOGY: BOTTOM-UP APPROACH
           2.3.2 TOP-DOWN APPROACH
                    FIGURE 7 MARKET SIZE ESTIMATION METHODOLOGY: TOP-DOWN APPROACH
           2.3.3 DEMAND-SIDE ANALYSIS
                    2.3.3.1 Regional analysis
                    2.3.3.2 Country-level analysis
                    2.3.3.3 Demand-side assumptions
                    2.3.3.4 Demand-side calculations
           2.3.4 SUPPLY-SIDE ANALYSIS
                    FIGURE 8 KEY STEPS CONSIDERED FOR ASSESSING SUPPLY-SIDE OF VACUUM CONTACTORS
                    FIGURE 9 VACUUM CONTACTOR MARKET: SUPPLY-SIDE ANALYSIS
                    2.3.4.1 Supply-side assumptions
                    2.3.4.2 Supply-side calculations
           2.3.5 GROWTH FORECAST
    2.4 RECESSION IMPACT 
 
3 EXECUTIVE SUMMARY (Page No. - 42)
    TABLE 1 SNAPSHOT OF VACUUM CONTACTOR MARKET 
    FIGURE 10 1–5 KV SEGMENT TO ACCOUNT FOR LARGEST MARKET SHARE, BY VOLTAGE RATING, IN 2028 
    FIGURE 11 MOTORS SEGMENT TO DOMINATE MARKET, BY APPLICATION, IN 2028 
    FIGURE 12 CONTACTOR FUSE COMBINATION TO EXHIBIT HIGHER CAGR, BY CONFIGURATION DURING FORECAST PERIOD 
    FIGURE 13 UTILITIES TO BE FASTEST-GROWING VERTICAL DURING FORECAST PERIOD 
    FIGURE 14 ASIA PACIFIC ACCOUNTED FOR LARGEST MARKET SHARE IN 2022 
 
4 PREMIUM INSIGHTS (Page No. - 47)
    4.1 ATTRACTIVE OPPORTUNITIES FOR PLAYERS IN VACUUM CONTACTOR MARKET 
           FIGURE 15 GROWING EMPHASIS ON UPGRADING AGING INFRASTRUCTURE TO DRIVE MARKET FROM 2023 TO 2028
    4.2 MARKET IN ASIA PACIFIC, BY CONFIGURATION AND COUNTRY 
           FIGURE 16 CHINA AND CONTACTOR FUSE COMBINATION CONTACTORS HELD LARGEST SHARES OF ASIA PACIFIC MARKET IN 2022
    4.3 MARKET, BY VOLTAGE 
           FIGURE 17 1–5 KV SEGMENT HELD LARGEST SHARE OF MARKET IN 2022
    4.4 MARKET, BY APPLICATION 
           FIGURE 18 MOTORS SEGMENT CAPTURED LARGEST MARKET SHARE IN 2022
    4.5 MARKET, BY CONFIGURATION 
           FIGURE 19 CONTACTOR FUSE COMBINATION SEGMENT ACCOUNTED FOR LARGER MARKET SHARE IN 2022
    4.6 MARKET, BY VERTICAL 
           FIGURE 20 UTILITIES SECTOR ACCOUNTED FOR LARGEST MARKET SHARE IN 2022
    4.7 MARKET, BY REGION 
           FIGURE 21 ASIA PACIFIC TO RECORD HIGHEST CAGR DURING FORECAST PERIOD
 
5 MARKET OVERVIEW (Page No. - 51)
    5.1 INTRODUCTION 
    5.2 MARKET DYNAMICS 
           FIGURE 22 VACUUM CONTACTOR MARKET: DRIVERS, RESTRAINTS, OPPORTUNITIES, AND CHALLENGES
           5.2.1 DRIVERS
                    5.2.1.1 Rising focus on renewable energy and industrial automation
                    5.2.1.2 Electrification of rural areas
                    5.2.1.3 Surging demand for HVAC equipment
           5.2.2 RESTRAINTS
                    5.2.2.1 Competition from other switching technologies
                    5.2.2.2 Stringent environmental regulations
           5.2.3 OPPORTUNITIES
                    5.2.3.1 Prevailing opportunities in railway sector
           5.2.4 CHALLENGES
                    5.2.4.1 Transition from traditional to digitalized infrastructure
                    5.2.4.2 Lack of technicians and engineers well-versed in traditional and digital technologies
    5.3 TRENDS/DISRUPTIONS IMPACTING CUSTOMER BUSINESS 
           5.3.1 REVENUE SHIFTS AND NEW REVENUE POCKETS FOR PLAYERS IN MARKET
                    FIGURE 23 REVENUE SHIFT AND NEW REVENUE POCKETS FOR PROVIDERS OF MARKET
    5.4 ECOSYSTEM MAPPING 
           5.4.1 PARTICIPANTS IN VACUUM CONTACTOR ECOSYSTEM
    5.5 TRADE ANALYSIS 
           TABLE 2 COUNTRY-WISE EXPORT DATA, 2021 AND 2022 (USD MILLION)
           TABLE 3 COUNTRY-WISE IMPORT DATA, 2021 AND 2022 (USD MILLION)
    5.6 VALUE CHAIN ANALYSIS 
           FIGURE 24 VACUUM CONTACTOR VALUE CHAIN ANALYSIS
           5.6.1 RAW MATERIAL PROVIDERS/SUPPLIERS
           5.6.2 COMPONENT MANUFACTURERS
           5.6.3 ASSEMBLERS/MANUFACTURERS
           5.6.4 DISTRIBUTORS (BUYERS)/END USERS
           5.6.5 POST-SALES SERVICE PROVIDERS
    5.7 TECHNOLOGY ANALYSIS 
           5.7.1 TECHNOLOGY TRENDS
    5.8 PORTER’S FIVE FORCES ANALYSIS 
           FIGURE 25 IMPACT OF PORTER'S FIVE FORCES ON MARKET
           TABLE 4 MARKET: PORTER’S FIVE FORCES ANALYSIS
           5.8.1 THREAT OF SUBSTITUTES
           5.8.2 BARGAINING POWER OF SUPPLIERS
           5.8.3 BARGAINING POWER OF BUYERS
           5.8.4 THREAT OF NEW ENTRANTS
           5.8.5 INTENSITY OF COMPETITIVE RIVALRY
    5.9 REGULATORY STANDARDS 
           TABLE 5 VACUUM CONTACTOR: STANDARDS AND REGULATIONS
    5.10 PATENT ANALYSIS 
    5.11 CASE STUDY ANALYSIS 
           5.11.1 POTATO FARMS IN US UPGRADE TO VACUUM CONTACTORS AFTER CONSULTATIONS FROM GE
    5.12 PRICING ANALYSIS 
                    FIGURE 26 AVERAGE SELLING PRICE OF VACUUM CONTACTOR, BY VOLTAGE RATING
                    TABLE 6 AVERAGE SELLING PRICE RANGE OF VACUUM CONTACTOR, BY VOLTAGE RATING
    5.13 KEY STAKEHOLDERS AND BUYING CRITERIA 
           5.13.1 KEY STAKEHOLDERS IN BUYING PROCESS
                    FIGURE 27 INFLUENCE OF STAKEHOLDERS ON BUYING PROCESS FOR TOP THREE APPLICATIONS
                    TABLE 7 INFLUENCE OF STAKEHOLDERS ON BUYING PROCESS FOR TOP THREE APPLICATIONS
           5.13.2 BUYING CRITERIA
                    FIGURE 28 KEY BUYING CRITERIA FOR TOP THREE APPLICATIONS
                    TABLE 8 KEY BUYING CRITERIA FOR TOP THREE APPLICATIONS
    5.14 KEY CONFERENCES AND EVENTS, 2023–2024 
                    TABLE 9 MARKET: LIST OF CONFERENCES AND EVENTS
    5.15 REGULATORY BODIES, GOVERNMENT AGENCIES, AND OTHER ORGANIZATIONS 
                    TABLE 10 NORTH AMERICA: LIST OF REGULATORY BODIES, GOVERNMENT AGENCIES, AND OTHER ORGANIZATIONS
                    TABLE 11 EUROPE: LIST OF REGULATORY BODIES, GOVERNMENT AGENCIES, AND OTHER ORGANIZATIONS
                    TABLE 12 ASIA PACIFIC: LIST OF REGULATORY BODIES, GOVERNMENT AGENCIES, AND OTHER ORGANIZATIONS
                    TABLE 13 SOUTH AMERICA: LIST OF REGULATORY BODIES, GOVERNMENT AGENCIES, AND OTHER ORGANIZATIONS
                    TABLE 14 MIDDLE EAST AND AFRICA: LIST OF REGULATORY BODIES, GOVERNMENT AGENCIES, AND OTHER ORGANIZATIONS
 
6 VACUUM CONTACTOR MARKET, BY APPLICATION (Page No. - 80)
    6.1 INTRODUCTION 
           FIGURE 29 MOTORS SEGMENT DOMINATED MARKET IN 2022
           TABLE 15 MARKET, BY APPLICATION, 2021–2028 (USD MILLION)
    6.2 MOTORS 
           6.2.1 INCREASING EMPHASIS ON ENERGY EFFICIENCY TO BOOST ADOPTION OF SOPHISTICATED MOTORS
                    TABLE 16 MOTORS: MARKET, BY REGION, 2021–2028 (USD MILLION)
    6.3 TRANSFORMERS 
           6.3.1 RISING INDUSTRIAL AND COMMERCIAL ACTIVITIES TO DRIVE VACUUM CONTACTOR DEMAND
                    TABLE 17 TRANSFORMERS: MARKET, BY REGION, 2021–2028 (USD MILLION)
    6.4 CAPACITORS 
           6.4.1 RISING DEPLOYMENT OF POWER FACTOR CORRECTION DEVICES IMPLEMENTING IN RESIDENTIAL AND NON-RESIDENTIAL BUILDINGS
                    TABLE 18 CAPACITORS: MARKET, BY REGION, 2021–2028 (USD MILLION)
    6.5 REACTORS 
           6.5.1 GROWING USE OF REACTORS IN METALS & MINING INDUSTRY TO BOOST SEGMENTAL GROWTH
                    TABLE 19 REACTORS: MARKET, BY REGION, 2021–2028 (USD MILLION)
    6.6 RESISTIVE LOADS 
           6.6.1 INCREASING ADOPTION OF RESISTIVE LOADS IN CHEMICAL PROCESSING TO OFFER LUCRATIVE GROWTH OPPORTUNITIES
                    TABLE 20 RESISTIVE LOADS: MARKET, BY REGION, 2021–2028 (USD MILLION)
    6.7 OTHER MEDIUM VOLTAGE EQUIPMENT 
           TABLE 21 OTHER MEDIUM-VOLTAGE EQUIPMENT: MARKET, BY REGION, 2021–2028 (USD MILLION)
 
7 VACUUM CONTACTOR MARKET, BY VERTICAL (Page No. - 90)
    7.1 INTRODUCTION 
           FIGURE 30 UTILITIES SECTOR ACCOUNTED FOR LARGEST MARKET SHARE IN 2022
           TABLE 22 MARKET, BY VERTICAL, 2021–2028 (USD MILLION)
    7.2 UTILITIES 
           7.2.1 ADVENT OF NEW ELECTRICAL GADGETS TO OFFER LUCRATIVE OPPORTUNITIES
                    TABLE 23 UTILITIES: MARKET, BY REGION, 2021–2028 (USD MILLION)
    7.3 INDUSTRIAL 
           7.3.1 EMERGENCE OF COST-EFFECTIVE MANUFACTURING TECHNIQUES TO DRIVE ADOPTION OF VACUUM CONTACTORS
                    TABLE 24 INDUSTRIAL: MARKET, BY REGION, 2021–2028 (USD MILLION)
    7.4 OIL & GAS 
           7.4.1 GROWING UTILIZATION OF VACUUM CONTACTOR IN OIL AND GAS REFINERIES TO SUPPORT MARKET GROWTH
                    TABLE 25 OIL & GAS: MARKET, BY REGION, 2021–2028 (USD MILLION)
    7.5 COMMERCIAL 
           7.5.1 EXPANSION OF COMMERCIAL FIRMS IN DEVELOPING COUNTRIES TO CONTRIBUTE TO MARKET GROWTH
                    TABLE 26 COMMERCIAL: MARKET, BY REGION, 2021–2028 (UNITS)
    7.6 MINING 
           7.6.1 INCREASING ADOPTION OF AUTOMATION AND DIGITAL TECHNOLOGIES IN MINING SECTOR TO DRIVE MARKET
                    TABLE 27 MINING: MARKET, BY REGION, 2021–2028 (USD MILLION)
    7.7 OTHER VERTICALS 
           TABLE 28 OTHER VERTICALS: MARKET, BY REGION, 2021–2028 (USD MILLION)
 
8 VACUUM CONTACTOR MARKET, BY CONFIGURATION (Page No. - 100)
    8.1 INTRODUCTION 
           FIGURE 31 CONTACTOR FUSE COMBINATION SEGMENT DOMINATED MARKET IN 2022
           TABLE 29 MARKET, BY CONFIGURATION, 2021–2028 (USD MILLION)
    8.2 CONTACTORS 
           8.2.1 TRANSITION TOWARD SUSTAINABLE ENERGY SOURCES TO DRIVE MARKET
    8.3 CONTACTOR FUSE COMBINATION 
           8.3.1 ADOPTION OF VACUUM CONTACTORS BY DATA CENTER OWNERS IN POWER CONTROL AND PROTECTION APPLICATIONS TO DRIVE MARKET
 
9 VACUUM CONTACTOR MARKET, BY VOLTAGE RATING (Page No. - 104)
    9.1 INTRODUCTION 
           FIGURE 32 1–5 KV SEGMENT ACCOUNTED FOR LARGEST MARKET SHARE IN 2022
           TABLE 30 MARKET, BY VOLTAGE RATING, 2021–2028 (USD MILLION)
           TABLE 31 MARKET, BY VOLTAGE RATING, 2021–2028 (THOUSAND UNITS)
    9.2 1–5 KV 
           9.2.1 GROWING FOCUS ON REDUCING TRANSMISSION LOSSES TO BENEFIT MARKET
                    TABLE 32 1–5 KV VOLTAGE RATING: MARKET, BY REGION, 2021–2028 (USD MILLION)
    9.3 5.1–10 KV 
           9.3.1 RAPID ECONOMIC GROWTH IN DEVELOPING COUNTRIES TO OFFER LUCRATIVE OPPORTUNITIES
                    TABLE 33 5.1–10 KV: MARKET, BY REGION, 2021–2028 (USD MILLION)
    9.4 10.1–15 KV 
           9.4.1 MANUFACTURING, MINING, AND METAL INDUSTRIES TO CONTRIBUTE TO MARKET GROWTH
                    TABLE 34 FROM 10.1–15 KV: MARKET, BY REGION, 2021–2028 (USD MILLION)
    9.5 15.1–24 KV 
           9.5.1 EXPANSION OF RENEWABLE ENERGY PROJECTS TO DRIVE MARKET
                    TABLE 35 15.1–24 KV: MARKET, BY REGION, 2021–2028 (USD MILLION)
 
10 VACUUM CONTACTOR MARKET, BY REGION (Page No. - 111)
     10.1 INTRODUCTION 
               FIGURE 33 ASIA PACIFIC TO DISPLAY HIGHEST CAGR DURING FORECAST PERIOD
     10.2 IMPACT OF RECESSION 
               TABLE 36 MARKET, BY REGION, 2021–2028 (USD MILLION)
               TABLE 37 MARKET, BY REGION, 2021–2028 (THOUSAND UNITS)
               FIGURE 34 MARKET, BY REGION
     10.3 NORTH AMERICA 
               FIGURE 35 NORTH AMERICA: MARKET SNAPSHOT
             10.3.1 RECESSION IMPACT: NORTH AMERICA
                       TABLE 38 NORTH AMERICA: MARKET, BY VOLTAGE RATING, 2021–2028 (USD MILLION)
                       TABLE 39 NORTH AMERICA: MARKET, BY APPLICATION, 2021–2028 (USD MILLION)
                       TABLE 40 NORTH AMERICA: MARKET, BY VERTICAL, 2021–2028 (USD MILLION)
                       TABLE 41 NORTH AMERICA: MARKET, BY COUNTRY, 2021–2028 (USD MILLION)
             10.3.2 US
                       10.3.2.1 Thriving utilities sector to drive market
                                   TABLE 42 US: MARKET, BY VERTICAL, 2021–2028 (USD MILLION)
             10.3.3 CANADA
                       10.3.3.1 Government grants to advance manufacturing technologies to boost market
                                   TABLE 43 CANADA: MARKET, BY VERTICAL, 2021–2028 (USD MILLION)
             10.3.4 MEXICO
                       10.3.4.1 Booming industrial sector to offer lucrative opportunities for market players
                                   TABLE 44 MEXICO: MARKET, BY VERTICAL, 2021–2028 (USD MILLION)
     10.4 EUROPE 
               FIGURE 36 EUROPE: MARKET SNAPSHOT
             10.4.1 RECESSION IMPACT: EUROPE
                       TABLE 45 EUROPE: MARKET, BY VOLTAGE RATING, 2021–2028 (USD MILLION)
                       TABLE 46 EUROPE: MARKET, BY APPLICATION, 2021–2028 (USD MILLION)
                       TABLE 47 EUROPE: MARKET, BY VERTICAL, 2021–2028 (USD MILLION)
                       TABLE 48 EUROPE: MARKET, BY COUNTRY, 2021–2028 (USD MILLION)
             10.4.2 FRANCE
                       10.4.2.1 Growing emphasis of industrial players on automation and energy efficiency to drive market
                                   TABLE 49 FRANCE: MARKET, BY VERTICAL, 2021–2028 (USD MILLION)
             10.4.3 GERMANY
                       10.4.3.1 Rising adoption of advanced electrical switching systems to fuel market
                                   TABLE 50 GERMANY: MARKET, BY VERTICAL, 2021–2028 (USD MILLION)
             10.4.4 ITALY
                       10.4.4.1 Growing inclination toward cleaner energy sources to drive market
                                   TABLE 51 ITALY: MARKET, BY VERTICAL, 2021–2028 (USD MILLION)
             10.4.5 UK
                       10.4.5.1 Rising adoption of EVs and renewable energy resources to drive market
                                   TABLE 52 UK: MARKET, BY VERTICAL, 2021–2028 (USD MILLION)
             10.4.6 RUSSIA
                       10.4.6.1 Rising focus on expansion and modernization of industrial infrastructure to support market growth
                                   TABLE 53 RUSSIA: MARKET, BY VERTICAL, 2021–2028 (USD MILLION)
             10.4.7 REST OF EUROPE
                       TABLE 54 REST OF EUROPE: MARKET, BY VERTICAL, 2021–2028 (USD MILLION)
     10.5 ASIA PACIFIC 
               FIGURE 37 ASIA PACIFIC: MARKET SNAPSHOT
             10.5.1 RECESSION IMPACT: ASIA PACIFIC
                       TABLE 55 ASIA PACIFIC: MARKET, BY VOLTAGE RATING, 2021–2028 (USD MILLION)
                       TABLE 56 ASIA PACIFIC: MARKET, BY APPLICATION, 2021–2028 (USD MILLION)
                       TABLE 57 ASIA PACIFIC: MARKET, BY VERTICAL, 2021–2028 (USD MILLION)
                       TABLE 58 ASIA PACIFIC: MARKET, BY COUNTRY, 2021–2028 (USD MILLION)
             10.5.2 CHINA
                       10.5.2.1 Rapid industrialization and urbanization to provide lucrative opportunities
                                   TABLE 59 CHINA: MARKET, BY VERTICAL, 2021–2028 (USD MILLION)
             10.5.3 INDIA
                       10.5.3.1 Push for automation and Industry 4.0 practices to drive market
                                   TABLE 60 INDIA: MARKET, BY VERTICAL, 2021–2028 (USD MILLION)
             10.5.4 JAPAN
                       10.5.4.1 Deployment of smart grid solutions to drive market
                                   TABLE 61 JAPAN: MARKET, BY VERTICAL, 2021–2028 (USD MILLION)
             10.5.5 SOUTH KOREA
                       10.5.5.1 Growing focus on industrial automation and robotics to drive market
                                   TABLE 62 SOUTH KOREA: MARKET, BY VERTICAL, 2021–2028 (USD MILLION)
             10.5.6 REST OF ASIA PACIFIC
                       TABLE 63 REST OF ASIA PACIFIC: MARKET, BY VERTICAL, 2021–2028 (USD MILLION)
     10.6 SOUTH AMERICA 
               TABLE 64 SOUTH AMERICA: MARKET, BY VOLTAGE RATING, 2021–2028 (USD MILLION)
               TABLE 65 SOUTH AMERICA: MARKET, BY APPLICATION, 2021–2028 (USD MILLION)
               TABLE 66 SOUTH AMERICA: MARKET, BY VERTICAL, 2021–2028 (USD MILLION)
               TABLE 67 SOUTH AMERICA: MARKET, BY COUNTRY, 2021–2028 (USD MILLION)
             10.6.1 RECESSION IMPACT: SOUTH AMERICA
             10.6.2 ARGENTINA
                       10.6.2.1 Policies promoting renewable energy to benefit market
                                   TABLE 68 ARGENTINA: MARKET, BY VERTICAL, 2021–2028 (USD MILLION)
             10.6.3 BRAZIL
                       10.6.3.1 Growing focus on wind and solar energy to drive market
                                   TABLE 69 BRAZIL: MARKET, BY VERTICAL, 2021–2028 (USD MILLION)
             10.6.4 REST OF SOUTH AMERICA
                       TABLE 70 REST OF SOUTH AMERICA: MARKET, BY VERTICAL, 2021–2028 (USD MILLION)
     10.7 MIDDLE EAST & AFRICA 
               TABLE 71 MIDDLE EAST & AFRICA: MARKET, BY VOLTAGE RATING, 2021–2028 (USD MILLION)
               TABLE 72 MIDDLE EAST & AFRICA: MARKET, BY APPLICATION, 2021–2028 (USD MILLION)
               TABLE 73 MIDDLE EAST & AFRICA: MARKET, BY VERTICAL, 2021–2028 (USD MILLION)
               TABLE 74 MIDDLE EAST & AFRICA: MARKET, BY COUNTRY, 2021–2028 (USD MILLION)
             10.7.1 SAUDI ARABIA
                       10.7.1.1 Launch of infrastructure and renewable energy projects to foster market growth
                                   TABLE 75 SAUDI ARABIA: MARKET, BY VERTICAL, 2021–2028 (USD MILLION)
             10.7.2 UAE
                       10.7.2.1 Smart cities and transportation networks projects to drive market
                                   TABLE 76 UAE: MARKET, BY VERTICAL, 2021–2028 (USD MILLION)
             10.7.3 SOUTH AFRICA
                       10.7.3.1 Ongoing renewable energy generation projects to create opportunities for vacuum contactor vendors
                                   TABLE 77 SOUTH AFRICA: VACUUM CONTACTOR MARKET, BY VERTICAL, 2021–2028 (USD MILLION)
             10.7.4 REST OF MIDDLE EAST & AFRICA
                       TABLE 78 REST OF MIDDLE EAST & AFRICA: VACUUM CONTACTOR MARKET, BY VERTICAL, 2021–2028 (USD MILLION)
 
11 COMPETITIVE LANDSCAPE (Page No. - 154)
     11.1 OVERVIEW 
     11.2 KEY STRATEGIES ADOPTED BY MAJOR PLAYERS 
               TABLE 79 OVERVIEW OF STRATEGIES ADOPTED BY TOP PLAYERS, 2019–2023
     11.3 MARKET SHARE ANALYSIS, 2022 
               TABLE 80 MARKET: DEGREE OF COMPETITION
               FIGURE 38 MARKET SHARE ANALYSIS, 2022
     11.4 FIVE-YEAR REVENUE ANALYSIS OF TOP COMPANIES, 2019–2022 
               FIGURE 39 REVENUE ANALYSIS OF TOP FIVE COMPANIES IN MARKET, 2018–2022
     11.5 KEY COMPANY EVALUATION MATRIX, 2022 
             11.5.1 STARS
             11.5.2 PERVASIVE PLAYERS
             11.5.3 EMERGING LEADERS
             11.5.4 PARTICIPANTS
                       FIGURE 40 MARKET: COMPANY EVALUATION MATRIX, 2022
     11.6 STARTUPS/SMES EVALUATION MATRIX, 2022 
             11.6.1 PROGRESSIVE COMPANIES
             11.6.2 RESPONSIVE COMPANIES
             11.6.3 STARTING BLOCKS
             11.6.4 DYNAMIC COMPANIES
                       FIGURE 41 MARKET: STARTUPS/SMES EVALUATION MATRIX, 2022
             11.6.5 COMPETITIVE BENCHMARKING
                       TABLE 81 MARKET: DETAILED LIST OF KEY STARTUPS/SMES
                       TABLE 82 STARTUPS/SMES: VERTICAL FOOTPRINT
     11.7 COMPANY FOOTPRINT 
               TABLE 83 KEY COMPANIES: VOLTAGE FOOTPRINT
               TABLE 84 KEY COMPANIES: VERTICAL FOOTPRINT
               TABLE 85 KEY COMPANIES: REGION FOOTPRINT
               TABLE 86 KEY COMPANIES: OVERALL COMPANY FOOTPRINT
     11.8 COMPETITIVE SCENARIOS AND TRENDS 
               TABLE 87 MARKET: PRODUCT LAUNCHES, 2019–2023
               TABLE 88 MARKET: DEALS, 2019–2023
 
12 COMPANY PROFILES (Page No. - 169)
(Business Overview, Products/Solutions/Services Offered, Recent Developments, MnM view (Key strengths/Right to win, Strategic choices made, Weakness/competitive threats)*
     12.1 KEY PLAYERS 
             12.1.1 ABB LTD.
                       TABLE 89 ABB LTD.: COMPANY OVERVIEW
                       FIGURE 42 ABB LTD.: COMPANY SNAPSHOT
                       TABLE 90 ABB LTD.: PRODUCTS/SOLUTIONS/SERVICES OFFERED
             12.1.2 SIEMENS
                       TABLE 91 SIEMENS: COMPANY OVERVIEW
                       FIGURE 43 SIEMENS: COMPANY SNAPSHOT
                       TABLE 92 SIEMENS: PRODUCTS/SOLUTIONS/SERVICES OFFERED
             12.1.3 SCHNEIDER ELECTRIC
                       TABLE 93 SCHNEIDER ELECTRIC: COMPANY OVERVIEW
                       FIGURE 44 SCHNEIDER ELECTRIC: COMPANY SNAPSHOT
                       TABLE 94 SCHNEIDER ELECTRIC: PRODUCTS/SOLUTIONS/SERVICES OFFERED
             12.1.4 EATON
                       TABLE 95 EATON: COMPANY OVERVIEW
                       FIGURE 45 EATON: COMPANY SNAPSHOT
                       TABLE 96 SIEMENS LIMITED: PRODUCTS/SOLUTIONS/SERVICES OFFERED
             12.1.5 TOSHIBA CORPORATION
                       TABLE 97 TOSHIBA CORPORATION: COMPANY OVERVIEW
                       FIGURE 46 TOSHIBA CORPORATION: COMPANY SNAPSHOT
                       TABLE 98 TOSHIBA CORPORATION: PRODUCTS/SOLUTIONS/SERVICES OFFERED
             12.1.6 GENERAL ELECTRIC
                       TABLE 99 GENERAL ELECTRIC: COMPANY OVERVIEW
                       FIGURE 47 GENERAL ELECTRIC: COMPANY SNAPSHOT
                       TABLE 100 GENERAL ELECTRIC: PRODUCTS/SOLUTIONS/SERVICES OFFERED
             12.1.7 MITSUBISHI ELECTRIC
                       TABLE 101 MITSUBISHI ELECTRIC: COMPANY OVERVIEW
                       FIGURE 48 MITSUBISHI ELECTRIC: COMPANY SNAPSHOT
                       TABLE 102 MITSUBISHI ELECTRIC: PRODUCTS/SOLUTIONS/SERVICES OFFERED
             12.1.8 YUEQING LIYOND ELECTRIC CO., LTD.
                       TABLE 103 YUEQING LIYOND ELECTRIC CO., LTD.: COMPANY OVERVIEW
                       TABLE 104 YUEQING LIYOND ELECTRIC CO., LTD.: PRODUCTS/SOLUTIONS/SERVICES OFFERED
             12.1.9 ROCKWELL AUTOMATION
                       TABLE 105 ROCKWELL AUTOMATION: COMPANY OVERVIEW
                       FIGURE 49 ROCKWELL AUTOMATION: COMPANY SNAPSHOT
                       TABLE 106 ROCKWELL AUTOMATION: PRODUCTS/SOLUTIONS/SERVICES OFFERED
             12.1.10 LS ELECTRIC CO., LTD.
                       TABLE 107 LS ELECTRIC CO., LTD.: COMPANY OVERVIEW
                       TABLE 108 LS ELECTRIC CO., LTD.: PRODUCTS/SOLUTIONS/SERVICES OFFERED
             12.1.11 CG POWER & INDUSTRIAL SOLUTIONS LTD.
                       TABLE 109 CG POWER & INDUSTRIAL SOLUTIONS LTD.: COMPANY OVERVIEW
                       FIGURE 50 CG POWER & INDUSTRIAL SOLUTIONS LTD.: COMPANY SNAPSHOT
                       TABLE 110 CG POWER & INDUSTRIAL SOLUTIONS LTD.: PRODUCTS/SOLUTIONS/SERVICES OFFERED
             12.1.12 SPECIALTY PRODUCT TECHNOLOGIES (JOSLYN CLARK)
                       TABLE 111 SPECIALTY PRODUCT TECHNOLOGIES (JOSLYN CLARK): COMPANY OVERVIEW
                       TABLE 112 SPECIALTY PRODUCT TECHNOLOGIES (JOSLYN CLARK) : PRODUCTS/SOLUTIONS/SERVICES OFFERED
             12.1.13 WUXI HAIBANG MECHANICAL & ELECTRICAL MANUFACTURING CO., LTD.
                       TABLE 113 WUXI HAIBANG MECHANICAL & ELECTRICAL MANUFACTURING CO., LTD.: COMPANY OVERVIEW
                       TABLE 114 WUXI HAIBANG MECHANICAL & ELECTRICAL MANUFACTURING CO., LTD.: PRODUCTS/SOLUTIONS/SERVICES OFFERED
             12.1.14 TDK ELECTRONICS
                       TABLE 115 TDK ELECTRONICS: COMPANY OVERVIEW
                       FIGURE 51 TDK ELECTRONICS: COMPANY SNAPSHOT
                       TABLE 116 TDK ELECTRONICS: PRODUCTS/SOLUTIONS/SERVICES OFFERED
                       TABLE 117 TDK ELECTRONICS: DEALS
             12.1.15 AMPCONTROL LIMITED
                       TABLE 118 AMPCONTROL LIMITED: COMPANY OVERVIEW
                       TABLE 119 AMPCONTROL LIMITED: PRODUCTS/SOLUTIONS/SERVICES OFFERED
                       TABLE 120 AMPCONTROL LIMITED: DEALS
     12.2 OTHER PLAYERS 
             12.2.1 FUJI ELECTRIC
             12.2.2 MEIDENSHA CORPORATION
             12.2.3 ARTECHE
             12.2.4 ZHIYUE GROUP CO., LTD.
             12.2.5 XIAMEN HUADIAN SWITCHGEAR CO., LTD
*Details on Business Overview, Products/Solutions/Services Offered, Recent Developments, MnM view (Key strengths/Right to win, Strategic choices made, Weakness/competitive threats)* might not be captured in case of unlisted companies.
 
13 APPENDIX (Page No. - 215)
     13.1 INSIGHTS FROM INDUSTRY EXPERTS 
     13.2 DISCUSSION GUIDE 
     13.3 KNOWLEDGESTORE: MARKETSANDMARKETS’ SUBSCRIPTION PORTAL 
     13.4 CUSTOMIZATION OPTIONS 
     13.5 RELATED REPORTS 
     13.6 AUTHOR DETAILS 

This study involved four major activities in estimating the current size of the vacuum contactor market. Exhaustive secondary research was done to collect information on the market, the peer market, and the parent market. The next step was to validate these findings, assumptions, and market sizing with industry experts across the value chain through rigorous primary research. Both top-down and bottom-up approaches were used to estimate the total market size. The market breakdown and data triangulation techniques were employed to estimate the market size of the segments and the corresponding subsegments.

Secondary Research

This research study involved the use of extensive secondary sources, directories, and databases such as industry publications, several newspaper articles, Statista Industry Journal, and UNESCO Institute of Statistics to identify and collect information useful for a technical, market-oriented, and commercial study of the utility communication market. The other secondary sources included annual reports, press releases & investor presentations of companies, white papers, certified publications, articles by recognized authors, manufacturer associations, trade directories, and databases. 

Primary Research

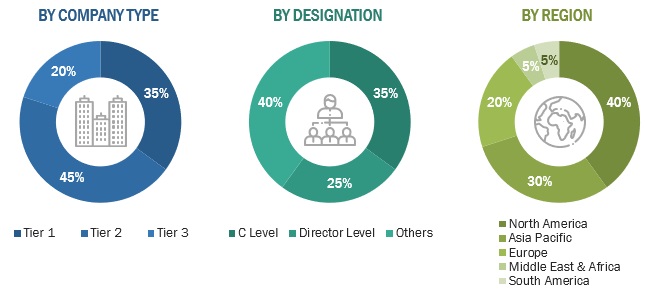
Primary sources included several industry experts from core and related industries, preferred suppliers, manufacturers, service providers, technology developers, and organizations related to all the segments of the nuclear industry. In-depth interviews were conducted with various primary respondents, including key industry participants, subject matter experts (SME), C-level executives of the key market players, and industry consultants, among other experts, to obtain and verify qualitative and quantitative information, as well as to assess the prospects of the market. The breakdown of primary respondents is given below:
Vacuum Contactor Market Size, and Share

To know about the assumptions considered for the study, download the pdf brochure

Market Size Estimation

Both top-down and bottom-up approaches have been used to estimate and validate the size of the global vacuum contactor market and its dependent submarkets. These methods were also extensively used to estimate the size of various subsegments in the market. The research methodology used to estimate the market size includes the following:

  • The key players in the industry and market have been identified through extensive secondary research, and their market shares in the respective regions have been determined through both primary and secondary research.
  • The industry’s supply chain and market size, in terms of value, have been determined through primary and secondary research processes.
  • All percentage shares, splits, and breakdowns have been determined using secondary sources and verified through primary sources.

Global Vacuum Contactor Market Size: Top-Down Approach

Vacuum Contactor Market Size, and Share

To know about the assumptions considered for the study, Request for Free Sample Report

Data Triangulation

After arriving at the overall market size—using the market size estimation processes as explained above—the market was split into several segments and subsegments. To complete the entire market engineering process and arrive at the exact statistics of each market segment and subsegment, the data triangulation, and market breakdown procedures were employed, wherever applicable. The data was triangulated by studying various factors and trends from both the demand and supply sides in the vacuum contactor market.

Objectives of the Study

  • To forecast and describe the vacuum contactor market size, by by configuration, application, voltage rating, end-user, and region, in terms of value and volume
  • To provide detailed information regarding the major drivers, restraints, opportunities, and challenges influencing the growth of the market
  • To estimate the size of the market in terms of value and volume
  • To strategically analyze micro markets with respect to individual growth trends, prospects, future expansions, and contributions to the overall market
  • To provide post-pandemic estimation for the market and analyze the impact of the recession on the overall market and value chain
  • To forecast the growth of the market with respect to five major regions, namely, North America, Europe, Asia Pacific, South America and Middle East & Africa
  • To analyze market opportunities for stakeholders and the competitive landscape for market leaders
  • To strategically profile key players and comprehensively analyze their respective market shares and core competencies
  • To analyze competitive developments such as investments & expansions, mergers & acquisitions, product launches, contracts & agreements, and joint ventures & collaborations in the vacuum contactor market

Available Customizations:

With the given market data, MarketsandMarkets offers customizations according to your specific needs. The following customization options are available for the report:

Company Information

  • Product Matrix, which provides a detailed comparison of the product portfolio of each company

Company Information

  • Detailed analysis and profiling of additional market players 
Custom Market Research Services

We will customize the research for you, in case the report listed above does not meet with your exact requirements. Our custom research will comprehensively cover the business information you require to help you arrive at strategic and profitable business decisions.

Request Customization
Report Code
EP 3621
Published ON
Aug, 2023
Choose License Type
BUY NOW
  • SHARE
X
Request Customization
Speak to Analyst
Speak to Analyst
OR FACE-TO-FACE MEETING
PERSONALIZE THIS RESEARCH
  • Triangulate with your Own Data
  • Get Data as per your Format and Definition
  • Gain a Deeper Dive on a Specific Application, Geography, Customer or Competitor
  • Any level of Personalization
REQUEST A FREE CUSTOMIZATION
LET US HELP YOU!
  • What are the Known and Unknown Adjacencies Impacting the Vacuum Contactor Market
  • What will your New Revenue Sources be?
  • Who will be your Top Customer; what will make them switch?
  • Defend your Market Share or Win Competitors
  • Get a Scorecard for Target Partners
CUSTOMIZED WORKSHOP REQUEST
knowledgestore logo

Want to explore hidden markets that can drive new revenue in Vacuum Contactor Market?

Find Hidden Markets
  • Call Us
  • +1-888-600-6441 (Corporate office hours)
  • +1-888-600-6441 (US/Can toll free)
  • +44-800-368-9399 (UK office hours)
CONNECT WITH US
ABOUT TRUST ONLINE
©2024 MarketsandMarkets Research Private Ltd. All rights reserved
DMCA.com Protection Status
Website Feedback