Transportation Systems and Analytics Market [by Transportation Management, Transportation Control Systems, by Analytics (Traffic, Video, GIS, Predictive, Fleet), Ticketing Management, Remote Sensing, Electronic Access, Display] - Worldwide Market Forecasts and Analysis (2013 - 2018)


[256 Pages Report] MarketsandMarkets expects the transportation systems market to grow from $28.09 billion in 2013 to $57.46 billion by 2018, at an estimated CAGR of 15.4% from 2013 to 2018.
Globalization, hyper-population, and demand for high travel convenience have created the need for efficient transportation system. The increasing use of analytics and advanced transportation control system along with the system integrators are helping to get rid of various problems associated with transportation system. The applications derived from the technologies are benefiting the users greatly and more innovations are expected in the years to come.
The Transportation Systems market and Transportation Analytics market research report provides an in-depth study of driving forces, restraints, and challenges for this market. It also provides insights into the strategies of key vendors. The report also analyzes global adoption trends and future growth potentials across different regions. The key vendors involved in this market are IBM, Oracle, Siemens, Hexagon, NovAtel, and TomTom.
This report segments the Transportation Systems market and Transportation Analytics market by solutions, applications, products, verticals, and geographical regions. It categorizes the global Transportation Systems market to forecast the revenues and analyzes the trends in each of the following submarkets:
On the basis of solutions:
- Analytics solution
- Advanced transportation control system
- Management solutions
On the basis of applications:
- Remote sensing
- Transit management
- Traffic incident management
- Others
On the basis of products:
- Displays
- Traffic sensors
- Electronic access
- Mobility
- Others
On the basis of verticals:
- Roadways
- Railways
- Airways
- Seaways
- Others
On the basis of region:
- North America (NA)
- Europe (EU)
- Middle East and Africa (MEA)
- Asia Pacific (APAC)
- Latin America (LA)
Transportation systems and analytics discuss about how the analytic solution, advanced transportation control system, and management solutions capabilities aid in taking the real-time decisions. These solutions and applications provide businesses with various benefits which include making faster and smarter business decisions with advanced analytics and improved customer satisfaction with on-time delivery performance. Looking at the vast networks of the transportation systems which include road, rail, air, and sea smart initiatives have been taken, which brings together the physical and digital infrastructure providing intelligent networks. The solutions and applications are needed to address the challenges arising from the intelligent networks such as improving operational efficiency along with reducing environmental impacts and assuring safety and security.
Increase in population and migration of the people from rural areas to the cities are the major factors of traffic congestion. Traffic congestion reduces the efficiency of transportation infrastructure and also increases the traveling time, fuel consumption, and air pollution. To overcome this problem, many countries such as the U.S., Germany, U.K., Japan, and others are deploying transportation analytics solutions.
The global Transportation Systems Market and Transportation Analytics Market is expected to rise at a Compound Annual Growth Rate (CAGR) of 15.4% from 2013 to 2018. Demand for more travel convenience, rapid population expansion, hyper-urbanization, and globalization are the major drivers of this market. Transportation analytics offers features, such as traffic analytics, Geographical Information System (GIS) analytics, video analytics, predictive analytics, fleet analytics, advanced transportation management system, advanced traveler information, ticketing and parking management solutions, and more. Modern products such as traffic sensors, electronic access, display, and mobility products assist in monitoring and managing transport more effectively.
MarketsandMarkets expects the Transportation Systems market to grow from $28.09 billion in 2013 to $57.46 billion by 2018, at an estimated CAGR of 15.4% from 2013 to 2018.
Transportation Systems Market Size, by Types, 2013�2018 ($Billion)
Source: MarketsandMarkets Analysis
The table given above highlights the market size on the basis of types, from 2013 to 2018.
Transportation Systems Market, by Types, 2013�2018, Y-O-Y (%)
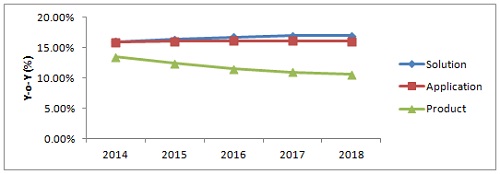
Source: MarketsandMarkets Analysis
The figure given above highlights the Transportation Systems Market and Transportation Analytics market on the basis of types from 2013 to 2018. The market by types comprises solutions, applications, and products. For the period 2013�2014, solution is expected to experience the highest Y-o-Y of 16.00%.
 Exclusive indicates content/data unique to MarketsandMarkets and not available with any competitors.
Table Of Contents
1 Introduction (Page No. - 24)
1.1 Research Overview
1.1.1 Purpose and Scope
1.1.2 Report Description
1.1.3 Key Take-Aways
1.2 Research Methodology
1.2.1 Secondary and Primary Research
1.2.2 Data Triangulation and Forecasting
1.2.3 Forecast Assumption
1.3 Market Overview
1.3.1 Markets Covered
1.3.2 Segment Definition
1.3.3 Industry Trends
2 Transportation Systems Market: Executive Summary (Page No. - 32)
2.1 Abstract
2.2 Overall Market Size
3 Transportation Systems Market Overview (Page No. - 35)
3.1 Market Ecosystem
3.1.1 Mapping Trends
3.1.2 Market Players and Roles
3.2 Market Dynamics
3.2.1 Drivers
3.2.1.1 Changing Travel Demand
3.2.1.2 Hyper-Urbanization
3.2.1.3 Globalization
3.2.2 Restraints and Challenges
3.2.2.1 Slow Growth of the Infrastructure
3.2.2.2 High Installation Cost
3.2.3 Opportunities
3.2.3.1 Smart Vehicles On Smart Roads
3.2.4 Time-Impact Analysis of Dynamics
4 Transportation Systems Market Size and Forecast By Types (Page No. - 41)
4.1 Types of Solution
4.1.1 Overview
4.1.2 Market Size and Forecast
4.2 Analytics
4.2.1 Overview
4.2.2 Geospatial Analytics
4.2.2.1 Overview
4.2.2.2 Market Size and Forecast
4.2.3 Traffic Analytics
4.2.3.1 Overview
4.2.3.2 Market Size and Forecast
4.2.4 Video Analytics
4.2.4.1 Overview
4.2.4.2 Market Size and Forecast
4.2.5 Predictive Analytics
4.2.5.1 Overview
4.2.5.2 Market Size and Forecast
4.2.6 Fleet Analytics
4.2.6.1 Overview
4.2.6.2 Market Size and Forecast
4.2.7 Others
4.2.7.1 Overview
4.2.7.2 Market Size and Forecast
4.3 Advanced Transportation Control System
4.3.1 Overview
4.3.2 Advanced Transportation Management System
4.3.2.1 Overview
4.3.2.2 Intelligent Infrastructure
4.3.2.2.1 Overview
4.3.2.2.2 Market Size and Forecast
4.3.2.3 Intelligent Vehicles
4.3.2.3.1 Overview
4.3.2.3.2 Market Size and Forecast
4.3.3 Advanced Traveler Information System
4.3.3.1 Overview
4.3.3.2 Market Size and Forecast
4.3.4 Advanced Vehicle Control System
4.3.4.1 Overview
4.3.4.2 Market Size and Forecast
4.4 Management Solution
4.4.1 Overview
4.4.1.1 Ticketing Management
4.4.1.1.1 Overview
4.4.1.1.2 Market Size and Forecast
4.4.1.2 Parking Management
4.4.1.2.1 Overview
4.4.1.2.2 Market Size and Forecast
4.4.1.3 Fleet Management
4.4.1.3.1 Overview
4.4.1.3.2 Market Size and Forecast
4.4.1.4 Others
4.4.1.4.1 Overview
4.4.1.4.2 Market Size and Forecast
4.5 Types of Application
4.5.1 Overview
4.5.2 Remote Sensing
4.5.2.1 Overview
4.5.2.2 Market Size and Forecast
4.5.3 Transit Management
4.5.3.1 Overview
4.5.3.2 Market Size and Forecast
4.5.4 Incident Management
4.5.4.1 Overview
4.5.4.2 Market Size and Forecast
4.5.5 Others
4.5.5.1 Overview
4.5.5.2 Market Size and Forecast
4.6 Types of Product
4.6.1 Overview
4.6.1.1 Display
4.6.1.1.1 Variable Message Sign
4.6.1.1.1.1 Overview
4.6.1.1.1.2 Market Size and Forecast
4.6.1.1.2 Digital Signage
4.6.1.1.2.1 Overview
4.6.1.1.2.2 Market Size and Forecast
4.6.1.1.3 Others
4.6.1.1.3.1 Overview
4.6.1.1.3.2 Market Size and Forecast
4.6.1.2 Traffic Sensors
4.6.1.2.1 Overview
4.6.1.2.2 Market Size and Forecast
4.6.1.3 Electronic Access
4.6.1.3.1 Overview
4.6.1.3.2 Market Size and Forecast
4.6.1.4 Mobility
4.6.1.4.1 Tachograph
4.6.1.4.1.1 Overview
4.6.1.4.1.2 Market Size and Forecast
4.6.1.4.2 Ip Cameras
4.6.1.4.2.1 Overview
4.6.1.4.2.2 Market Size and Forecast
4.6.1.4.3 Others
4.6.1.4.3.1 Overview
4.6.1.4.3.2 Market Size and Forecast
4.6.1.5 Others
4.6.1.5.1 Overview
4.6.1.5.2 Market Size and Forecast
5 Transportation Systems Market Size and Forecast By Verticals (Page No. - 115)
5.1 Types of Vertical
5.1.1 Overview
5.1.2 Market Size and Forecast
5.1.3 Roadways
5.1.3.1 Overview
5.1.3.2 Market Size and Forecast By Solutions
5.1.3.3 Market Size and Forecast By Application
5.1.4 Railways
5.1.4.1 Overview
5.1.4.2 Market Size and Forecast By Solution
5.1.4.3 Market Size and Forecast By Application
5.1.5 Airways
5.1.5.1 Overview
5.1.5.2 Market Size and Forecast By Solution
5.1.5.3 Market Size and Forecast By Application
5.1.6 Seaways
5.1.6.1 Overview
5.1.6.2 Market Size and Forecast By Solution
5.1.6.3 Market Size and Forecast By Application
5.1.7 Others
5.1.7.1 Overview
5.1.7.2 Market Size and Forecast By Solution
5.1.7.3 Market Size and Forecast By Application
6 Transportation Systems Market Size and Forecast By Regions (Page No. - 151)
6.1 Overview
6.1.1 Parfait Charts
6.1.2 Regional Market Lifecycle
6.2 Market Size and Forecast
6.2.1 North America (Na)
6.2.1.1 Overview
6.2.1.2 Market Size and Forecast By Solution
6.2.1.3 Market Size and Forecast By Verticals
6.2.2 Europe
6.2.2.1 Overview
6.2.2.2 Market Size and Forecast By Solution
6.2.2.3 Market Size and Forecast By Verticals
6.2.3 Asia-Pacific
6.2.3.1 Overview
6.2.3.2 Market Size and Forecast By Solution
6.2.3.3 Market Size and Forecast By Verticals
6.2.4 Middle East and Africa
6.2.4.1 Overview
6.2.4.2 Market Size and Forecast By Solution
6.2.4.3 Market Size and Forecast By Verticals
6.2.5 Latin America
6.2.5.1 Overview
6.2.5.2 Market Size and Forecast By Solution
6.2.5.3 Market Size and Forecast By Verticals
7 Transportation Systems Market Analysis, Trends and Insights (Page No. - 195)
7.1 Market Evolution
7.1.1 Market Uptake and Disruption
7.1.2 Lifecycle and Chasm Plots
7.2 Business Case Analysis
7.2.1 Go to Market Strategy
7.2.2 Value Innovation and Creation
7.3 Trends and Roadmaps
7.3.1 Adoption Roadmaps
7.4 Market Opportunity Analysis
7.4.1 Technological Impact
7.4.2 Opportunity Plots
8 Transportation Systems Market : Competitive Landscape (Page No. - 203)
8.1 Portfolio Comparison
8.1.1 Overview
8.1.2 Product Category Mapping
8.2 Venture Capital (Vc) Funding Analysis
8.2.1 Capital Funding Trends
8.3 Mergers and Acquisitions (M&A)
8.3.1 Impact Analysis
8.4 Social Reach
8.4.1 Social Trends
9 Company Profiles (Mnm View, Overview, Products & Services, Financials, SWOT Analysis and Strategy & Analyst Insights)* (Page No. - 208)
9.1 Cellint
9.2 Cubic Corporation
9.3 Deltion, Ltd.
9.4 Garmin, Ltd.
9.5 IBM
9.6 Inrix, Inc.
9.7 Kapsch Ag
9.8 Kewill, Ltd.
9.9 Oracle
9.10 Qualcomm Inc.
9.11 Ryder Systems, Inc.
9.12 Thales
9.13 Tomtom
9.14 Traffic Master
9.15 Trimble Navigation, Ltd.
*Details on Marketsandmarkets View, Overview, Products & Services, Financials, SWOT Analysis and Strategy & Analyst Insights Might Not Be
Captured in Case of Unlisted Companies.
9.16 Other Key Innovator
9.16.1 Decawave Ltd.
9.16.2 Emkay, Inc.
9.16.3 Leddertech
9.16.4 Moxa
9.16.5 Novatel
List Of Tables (123 Tables)
Table 1 Transportation Systems Market Revenue, By Types, 2013 � 2018 ($Billion)
Table 2 Transportation Systems Market and Analytics Market Revenue, By Solution, 2013 � 2018 ($Billion)
Table 3 Transportation Systems and Analytics Market, By Solution, 2013 � 2018,Y-O-Y (%)
Table 4 Transportation Systems and Analytics Market Revenue, By Analytics Solution, 2013 � 2018 ($Billion)
Table 5 Transportation Systems and Analytics Market, By Analytics Solution, 2013 � 2018, Y-O-Y (%)
Table 6 Geospatial Analytics Market Revenue, By Application, 2013 � 2018 ($Million)
Table 7 Traffic Analytics Market Revenue, By Application,
Table 8 2013 � 2018 ($Million)
Table 9 Video Analytics Market Revenue, By Application, 2013 � 2018 ($Million)
Table 10 Predictive Analytics Market Revenue, By Application, 2013 � 2018 ($Million)
Table 11 Fleet Analytics Market Revenue, By Application, 2013 � 2018 ($Million)
Table 12 Others Market Revenue, By Application, 2013 � 2018 ($Million)
Table 13 Transportation Systems Market Revenue, By Advanced Transportation Control System, 2013 � 2018 ($Billion)
Table 14 Market, By Advanced Transportation Control System, 2013 � 2018, Y-O-Y (%)
Table 15 Market Revenue, By Advanced Transportation Management System, 2013 � 2018 ($Billion)
Table 16 Market, By Advanced Transportation Management System, 2013 � 2018, Y-O-Y (%)
Table 17 Advanced Transportation Management System Revenue, By Application, 2013 � 2018 ($Million)
Table 18 Intelligent Infrastructure Market Revenue, By Regions, 2013 � 2018 ($Million)
Table 19 Intelligent Vehicle Market Revenue, By Regions, 2013 � 2018 ($Million)
Table 20 Advanced Traveler Information System Market Revenue, By Application, 2013 � 2018 ($Million)
Table 21 Advanced Vehicle Control System Market Revenue, By Application, 2013 � 2018 ($Million)
Table 22 Transportation Systems Market and Analytics Market Revenue, By Management Solution, 2013 � 2018 ($Billion)
Table 23 Market, By Management Solution, 2013 � 2018, Y-O-Y (%)
Table 24 Ticketing Management Market Revenue, By Application, 2013 � 2018 ($Million)
Table 25 Parking Management Market Revenue, By Application, 2013 � 2018 ($Million)
Table 26 Fleet Management Market Revenue, By Application, 2013 � 2018 ($Million)
Table 27 Others Market Revenue, By Application, 2013 � 2018 ($Million)
Table 28 Transportation Systems and Analytics Market Revenue, By Application, 2013 � 2018 ($Billion)
Table 29 Transportation Systems Market, By Application, 2013 � 2018, Y-O-Y (%)
Table 30 Remote Sensing Market Revenue, By Regions, 2013 � 2018 ($Million)
Table 31 Transit Management Market Revenue, By Regions, 2013 � 2018 ($Million)
Table 32 Traffic Incident Management Market Revenue, By Regions, 2013 � 2018 ($Million)
Table 33 Others Market Revenue, By Regions, 2013 � 2018 ($Million)
Table 34 Transportation Systems and Analytics Market Revenue, By Product, 2013 � 2018 ($Billion)
Table 35 Market, By Product, 2013 � 2018, Y-O-Y (%)
Table 36 Market Revenue, By Display Types, 2013 � 2018 ($Million)
Table 37 Transportation Systems Market, By Display Types, 2013 � 2018, Y-O-Y (%)
Table 38 Variable Message Sign Market Revenue, By Regions, 2013 � 2018 ($Million)
Table 39 Digital Signage Market Revenue, By Regions, 2013 � 2018 ($Million)
Table 40 Others Market Revenue, By Regions, 2013 � 2018 ($Million)
Table 41 Traffic Sensors Market Revenue, By Regions, 2013 � 2018 ($Million)
Table 42 Market Revenue, By Electronic Access, 2013 � 2018 ($Billion)
Table 43 Market, By Electronic Access, 2013 � 2018, Y-O-Y (%)
Table 44 Electronic Access Market Revenue, By Regions, 2013 � 2018 ($Million)
Table 45 Market Revenue, By Mobility Types, 2013 � 2018 ($Million)
Table 46 Market, By Display Types, 2013 � 2018, Y-O-Y (%)
Table 47 Tachograph Market Revenue, By Regions, 2013 � 2018 ($Million)
Table 48 IP Cameras Market Revenue, By Regions, 2013 � 2018 ($Million)
Table 49 Others Market Revenue, By Regions, 2013 � 2018 ($Million)
Table 50 Others Market Revenue, By Regions, 2013 � 2018 ($Million)
Table 51 Transportation Systems and Analytics Market Revenue, By Vertical, 2013 � 2018 ($Billion)
Table 52 Transportation Systems Market, By Vertical, 2013 � 2018, Y-O-Y (%)
Table 53 Roadways Market Revenue, By Solution, 2013 � 2018 ($Million)
Table 54 Roadways Market Revenue, By Analytics Solution, 2013 � 2018 ($Million)
Table 55 Roadways Market Revenue, By Advanced Transportation Control System, 2013 � 2018 ($Million)
Table 56 Roadways Market Revenue, By Management Solution, 2013 � 2018 ($Million)
Table 57 Roadways Market Revenue, By Application, 2013 � 2018 ($Million)
Table 58 Railways Market Revenue, By Solution, 2013 � 2018 ($Million)
Table 59 Railways Market Revenue, By Analytics Solution, 2013 � 2018 ($Million)
Table 60 Railways Market Revenue, By Advanced Transportation Control System, 2013 � 2018 ($Million)
Table 61 Railways Market Revenue, By Management Solution, 2013 � 2018 ($Million)
Table 62 Railways Market Revenue, By Application, 2013 � 2018 ($Million)
Table 63 Airways Market Revenue, By Solution, 2013 � 2018 ($Million)
Table 64 Airways Market Revenue, By Analytics Solution, 2013 � 2018 ($Million)
Table 65 Airways Market Revenue, By Advanced Transportation Control System, 2013 � 2018 ($Million)
Table 66 Airways Market Revenue, By Management Solution, 2013 � 2018 ($Million)
Table 67 Airways Market Revenue, By Application, 2013 � 2018 ($Million)
Table 68 Seaways Market Revenue, By Solution, 2013 � 2018 ($Million)
Table 69 Seaways Market Revenue, By Analytics Solution, 2013 � 2018 ($Million)
Table 70 Seaways Market Revenue, By Advanced Transportation Control System, 2013 � 2018 ($Million)
Table 71 Seaways Market Revenue, By Management Solution, 2013 � 2018 ($Million)
Table 72 Seaways Market Revenue, By Application, 2013 � 2018 ($Million)
Table 73 Others Market Revenue, By Solution, 2013 � 2018 ($Million)
Table 74 Others Market Revenue, By Analytics Solution, 2013 � 2018 ($Million)
Table 75 Others Market Revenue, By Advanced Transportation Control System, 2013 � 2018 ($Million)
Table 76 Others Market Revenue, By Management Solution, 2013 � 2018 ($Million)
Table 77 Others Market Revenue, By Application, 2013 � 2018 ($Million)
Table 78 Transportation Systems and Analytics Market Revenue, By Region, 2013 � 2018 ($Billion)
Table 79 Transportation Systems Market, By Region, 2013 � 2018, Y-O-Y (%)
Table 80 North America Revenue, By Solution, 2013 � 2018 ($Billion)
Table 81 North America Market Revenue, By Analytics Solution, 2013 � 2018 ($Million)
Table 82 North America Market Revenue, By Advanced Transportation Control System, 2013 � 2018 ($Million)
Table 83 North America Market Revenue, By Management Solution, 2013 � 2018 ($Million)
Table 84 North America Market Revenue, By Verticals, 2013 � 2018 ($Billion)
Table 85 North America Market, By Vertical, 2013 � 2018, Y-O-Y (%)
Table 86 Europe: Transportation Systems Market Revenue, By Solution, 2013 � 2018 ($Billion)
Table 87 Europe Market Revenue, By Analytic Solution, 2013 � 2018 ($Million)
Table 88 Europe Market Revenue, By Advanced Transportation Control System, 2013 � 2018 ($Million)
Table 89 Europe Market Revenue, By Management Solution, 2013 � 2018 ($Million)
Table 90 Europe Market Revenue, By Verticals, 2013 � 2018 ($Billion)
Table 91 Europe Market, By Vertical, 2013 � 2018, Y-O-Y (%)
Table 92 APAC: Transportation Systems Market Revenue, By Solution, 2013 � 2018 ($Billion)
Table 93 APAC Market Revenue, By Analytics Solution, 2013 � 2018 ($Million)
Table 94 APAC Market Revenue, By Advanced Transportation Control System, 2013 � 2018 ($Million)
Table 95 APAC Market Revenue, By Management Solution, 2013 � 2018 ($Million)
Table 96 APAC Market Revenue, By Verticals, 2013 � 2018 ($Billion)
Table 97 APAC Market, By Vertical, 2013 � 2018, Y-O-Y (%)
Table 98 MEA Revenue, By Solution, 2013 � 2018 ($Million)
Table 99 MEA: Transportation Systems Market Revenue, By Analytics Solution, 2013 � 2018 ($Million)
Table 100 MEA Market Revenue, By Advanced Transportation Control System, 2013 � 2018 ($Million)
Table 101 MEA Market Revenue, By Management Solution, 2013 � 2018 ($Million)
Table 102 MEA Market Revenue, By Verticals, 2013 � 2018 ($Billion)
Table 103 MEA Market, By Vertical, 2013 � 2018, Y-O-Y (%)
Table 104 Latin America Market Revenue, By Solution, 2013 � 2018 ($Million)
Table 105 Latin America Market Revenue, By Analytics Solution, 2013 � 2018 ($Million)
Table 106 Latin America Market Revenue, By Advanced Transportation Control System, 2013 � 2018 ($Million)
Table 107 Latin America Market Revenue, By Management Solution, 2013 � 2018 ($Million)
Table 108 Latin America Market Revenue, By Verticals, 2013 � 2018 ($Billion)
Table 109 Latin America: Transportation Systems Market, By Vertical, 2013 � 2018, Y-O-Y (%)
Table 110 Cubic Corporation: Revenue, 2011 � 2012 ($Million)
Table 111 Garmin: Revenue, 2011 � 2012 ($Million)
Table 112 IBM: Revenue, 2011 � 2012 ($Million)
Table 113 Kapsch: Revenue, 2011 � 2012 ($Million)
Table 114 Oracle: Revenue, 2011 � 2012 ($Million)
Table 115 Oracle: Revenue, By Segments 2011�2012 ($Million)
Table 116 Oracle: Revenue, By Regions 2011�2012 ($Million)
Table 117 Qualcomm: Revenue, 2011 � 2012 ($Million)
Table 118 Ryder Systems: Revenue, 2011 � 2012 ($Million)
Table 119 Thales: Revenue, 2011 � 2012 ($Million)
Table 120 Thales: Revenue By Business Segments, 2011�2012 ($Million)
Table 121 Thales: Revenue By Regions, 2011�2012 ($Million)
Table 122 Tomtom: Revenue, 2011 � 2012 ($Million)
Table 123 Trimble Navigation: Revenue, 2011 � 2012 ($Million)
List Of Figures (77 Figures)
Figure 1 Transportation Systems and Analytics Purpose and Scope
Figure 2 Transportation Systems Market
Figure 3 Transportation Systems Market, 2013 � 2018 ($Billion, Y-O-Y %)
Figure 4 Value-Chain
Figure 5 Ecosystem
Figure 6 Time-Impact Analysis of Dynamics
Figure 7 Transportation Systems and Analytics By Solution Types
Figure 8 Market Revenue, By Solution, 2013 � 2018 ($Billion)
Figure 9 Market Revenue, By Solution, 2013 � 2018 ($Billion)
Figure 10 Transportation Systems and Analytics Market, By Solutions, 2013 � 2018, Y-O-Y (%)
Figure 11 Market Revenue, By Analytics Solution, 2013 � 2018 ($Billion)
Figure 12 Market, By Analytic Solutions, 2013 � 2018, Y-O-Y (%)
Figure 13 Advanced Transportation Control System
Figure 14 Transportation Systems Market Revenue, By Advanced Transportation Control System, 2013 � 2018 ($Billion)
Figure 15 Market, By Advanced Transportation Control System, 2013 � 2018, Y-O-Y (%)
Figure 16 Market Revenue, By Advanced Transportation Management System, 2013 � 2018 ($Billion)
Figure 17 Market, By Advanced Transportation Management System, 2013 � 2018, Y-O-Y (%)
Figure 18 Flow of Information in Advanced Traveler Information System
Figure 19 Types of Management Solution
Figure 20 Transportation Systems Market Revenue, By Management Solutions, 2013 � 2018 ($Billion)
Figure 21 Market, By Management Solutions, 2013 � 2018, Y-O-Y (%)
Figure 22 Types of Application in Transportation Systems and Analytics Market
Figure 23 Market Revenue, By Application, 2013 � 2018 ($Billion)
Figure 24 Transportation Systems and Analytics Market, By Application, 2013 � 2018, Y-O-Y (%)
Figure 25 Types of Product in Transportation Systems and Analytics Market
Figure 26 Market Revenue, By Product, 2013 � 2018 ($Billion)
Figure 27 Market, By Product Types, 2013 �2018, Y-O-Y (%)
Figure 28 Types of Display in Transportation Systems and Analytics Market
Figure 29 Market Revenue, By Display Types, 2013 � 2018 ($Million)
Figure 30 Market, By Display Types, 2013 �2018, Y-O-Y (%)
Figure 31 Electronic Access
Figure 32 Transportation Systems Market Revenue, By Electronic Access, 2013 � 2018 ($Billion)
Figure 33 Market, By Electronic Access, 2013 � 2018, Y-O-Y (%)
Figure 34 Types of Mobility Products in Transportation Systems and Analytics Market
Figure 35 Market Revenue, By Mobility Types, 2013 � 2018 ($Million)
Figure 36 Market, By Mobility Products, 2013 �2018, Y-O-Y (%)
Figure 37 Types of Vertical in Transportation Systems and Analytics Market
Figure 38 Market Revenue, By Vertical, 2013 � 2018 ($Billions)
Figure 39 Transportation Systems Market, By Vertical, 2013 �2018, Y-O-Y (%)
Figure 40 Roadways Market, By Solutions, 2013 � 2018, ($Million, Y-O-Y (%)
Figure 41 Railways Market, By Solution, 2013 � 2018, Y-O-Y (%)
Figure 42 Airways Market, By Solutions, 2013 � 2018, Y-O-Y (%)
Figure 43 Seaways Market, By Solutions, 2013 � 2018, Y-O-Y (%)
Figure 44 Others Market, By Solutions, 2013 � 2018, Y-O-Y (%)
Figure 45 Transportation Systems Market Revenue, By Region, 2013 � 2018 ($Billion)
Figure 46 Market, By Region, 2013 � 2018, Y-O-Y (%)
Figure 47 North America Market, By Solutions, 2013 � 2018, Y-O-Y (%)
Figure 48 North America Market, By Vertical, 2013 � 2018, Y-O-Y (%)
Figure 49 Europe Market, By Solutions, 2013 � 2018, Y-O-Y (%)
Figure 50 Europe Market, By Vertical, 2013 � 2018, Y-O-Y (%)
Figure 51 APAC Market, By Solutions, 2013 � 2018, Y-O-Y (%)
Figure 52 APAC Market, By Vertical, 2013 � 2018, Y-O-Y (%)
Figure 53 MEA Revenue, By Solution, 2013 � 2018, Y-O-Y (%)
Figure 54 MEA Market, By Vertical, 2013 � 2018, Y-O-Y (%)
Figure 55 Latin America Market, By Solution, 2013 � 2018 ($Million, Y-O-Y %)
Figure 56 Latin America Market, By Vertical, 2013 � 2018, Y-O-Y (%)
Figure 57 Transportation Systems Market Disruption
Figure 58 Lifecycle and Chasm Plot
Figure 59 Transportation Systems and Analytics - Go to Market Strategy
Figure 60 Transportation Systems and Analytics: Value Innovation and Creation
Figure 61 Transportation Systems and Analytics: Adoption Roadmaps
Figure 62 Transportation Systems and Analytics: Opportunity Plots
Figure 63 Cellint: SWOT Analysis
Figure 64 Cubic Corporation: SWOT Analysis
Figure 65 Deltion: SWOT Analysis
Figure 66 Garmin: SWOT Analysis
Figure 67 IBM: SWOT Analysis
Figure 68 Inrix: SWOT Analysis
Figure 69 Kapsch: SWOT Analysis
Figure 70 Kewill: SWOT Analysis
Figure 71 Oracle: SWOT Analysis
Figure 72 Qualcomm: SWOT Analysis
Figure 73 Ryder Systems: SWOT Analysis
Figure 74 Thales: SWOT Analysis
Figure 75 Tomtom: SWOT Analysis
Figure 76 Traffic Master: SWOT Analysis
Figure 77 Trimble Navigation: SWOT Analysis


Growth opportunities and latent adjacency in Transportation Systems and Analytics Market