Thermal Ceramics Market by Type (Ceramic Fibers and Insulation Bricks), End-Use Industry(Mining & Metal Processing, Chemical & Petrochemical, Manufacturing, Power Generation),Temperature Range, and Region - Global Forecast to 2023


[125 Pages Report] The Thermal Ceramics Market was valued at USD 3.11 billion in 2017 and is projected to reach USD 5.02 billion by 2023, at a CAGR of 8.4% during the forecast period. The high demand for thermal ceramics in various end-use industries, growing need for energy savings, and rapid infrastructural development in emerging economies of APAC are driving the thermal ceramics market.
Objectives of the Study
- To analyze and forecast the market size for thermal ceramics, in terms of value and volume
- To provide detailed information about the key factors influencing the growth of the market (drivers, restraints, opportunities, and challenges)
- To define, describe, and forecast the thermal ceramic market on the basis of type, temperature range, and end-use industry
- To forecast the thermal ceramic market size with respect to 5 main regions, namely, North America, Europe, Asia Pacific, the Middle East & Africa, and South America
- To strategically analyze micromarkets with respect to individual growth trends, prospects, and their contribution to the overall market
- To analyze competitive developments, such as joint ventures, mergers & acquisitions, new product launches, mergers & acquisitions, and investments & expansions in the thermal ceramics market
- To analyze the opportunities in the market for stakeholders and provide a competitive landscape for market leaders
- To strategically profile key players and comprehensively analyze their market shares and core competencies
Years considered for this report
- 2016 �C Base Year
- 2018 �C Estimated Year
- 2023 �C Projected Year
Research Methodology
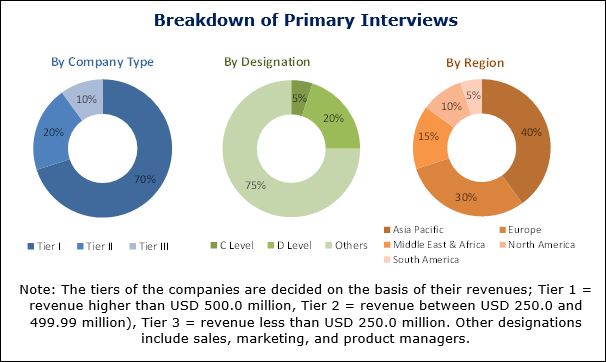
This study estimates the size of the thermal ceramics market for 2018 and projects its growth till 2023. It provides a detailed qualitative and quantitative analysis of the thermal ceramic market. Secondary sources, such as D&B Hoovers, Bloomberg Business Week, and Factiva, among others, were used to identify and collect information useful for this extensive, commercial study of the thermal ceramic market. Primary sources, such as experts from related industries and suppliers of thermal ceramics were interviewed to obtain and verify critical information and assess prospects of the thermal ceramics market.
To know about the assumptions considered for the study, download the pdf brochure
Key players profiled in the report include Morgan Thermal Ceramics (UK), Unifrax (US), IBIDEN (Japan), Isolite Insulating Products (Japan), Luyang Energy-Saving Materials (China), RHI Magnesita (Austria), Rath (US), Mitsubishi Chemical Corporation (Japan), 3M (US), and YESO Insulating Products (China).
Target Audience:
- Manufacturers of Thermal Ceramics
- Chemical Suppliers
- Traders, Distributors, and Suppliers of Thermal Ceramics
- Raw Material Suppliers
- Government and Research Organizations
- Industry Associations
This study answers several questions for stakeholders, primarily, which market segments they should focus on during the next 2 to 5 years to prioritize their efforts and investments. It also provides a competitive landscape of the thermal ceramic market.
Scope of the Report:
The thermal ceramics market has been segmented as follows:
Thermal Ceramics Market, by Type:
- Ceramic Fibers
- Insulation Bricks
Thermal Ceramic Market, by Temperature Range:
- 650 to 1,000 ��
- 1,000 to 1,400 ��
- 1,400 to 1,600 ��
Thermal Ceramics Market, by End-use Industry:
- Mining & Metal Processing
- Chemical & Petrochemical
- Manufacturing
- Power Generation
- Others
Thermal Ceramics Market, by Region:
- Asia Pacific
- Europe
- North America
- Middle East & Africa
- South America
The market has further been analyzed for key countries in each of these regions.
Available Customizations
Along with the market data, MarketsandMarkets offers customizations as per the specific needs of the companies. The following customization options are available for this report:
Product Analysis
- A product matrix that provides a detailed comparison of the product portfolio of each company
Regional Analysis
- Further breakdown of the Rest of Asia Pacific thermal ceramics market
- Further breakdown of the South America and the Middle East & Africa thermal ceramics markets
The thermal ceramics market is estimated to be USD 3.36 billion in 2018 and is projected to reach USD 5.02 billion by 2023, at a CAGR of 8.4% from 2018 to 2023. The high demand for thermal ceramics in various end-use industries, such as chemical & petrochemical, mining & metal processing, and manufacturing, are expected to drive the thermal ceramic market.
Based on type, the thermal ceramic market has been segmented into ceramic fibers and insulation bricks. The ceramic fibers segment is estimated to lead the market and is projected to grow at a higher rate than the insulation bricks segment during the forecast period. Ceramic fibers have an exceptionally low thermal conductivity, which makes them an energy-saving material. Additionally, they have low density, low thermal inertia, excellent temperature control inside the insulating surface, no preheat requirement, chemical stability, and are flexible, light in weight, and convenient to install. These properties have led to their growing preference and usage over other insulation products.
Based on temperature range, the thermal ceramic market has been segmented into 650 to 1,000��C, 1,000 to 1,400��C, and 1,400 to 1,6000C. The 1,000 to 1,400��C segment is estimated to be the largest temperature range segment of the market and is also projected to grow at the highest rate during the forecast period. The products operating in this range are used in an arena of applications, including high temperature filtration, refractory back-up for aluminum melting and holding furnaces, aluminum furnace tap-out plug cover and parting agent, aluminum distributor pan linings, gaskets for any high temperature application, back up lining for metal troughs, process heaters, ceramic kilns, annealing furnaces, heat treating furnaces, thermal oxidizers, high temperature gaskets and seals, and heat shields. Refractory ceramic fibers, low bio-persistent alkaline earth silicate fibers, and polycrystalline fibers are used for this temperature range.
Mining & metal processing is the largest end-use industry segment of the thermal ceramics market due to the huge demand for thermal ceramics in the production and processing of metals. The large production of metals has resulted in the high demand for thermal ceramics in kilns, furnaces, and other high-temperature insulation applications. Manufacturing is the fastest-growing end-use industry segment of the thermal ceramic market. This segment includes high growth industries, such as cement, glass, refractory, ceramic, transportation, and electronics & electrical.
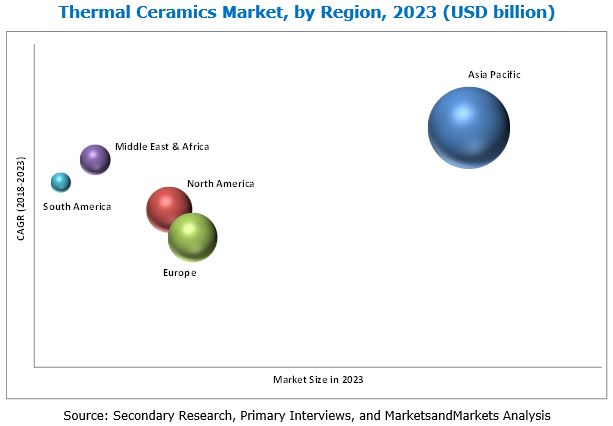
The thermal ceramics market has been studied for Asia Pacific (APAC), North America, Europe, the Middle East & Africa, and South America. APAC is the largest and the fastest-growing market for thermal ceramics. The high growth of the chemical industry has led to increased investments in chemical manufacturing units in this region. APAC countries, such as China and India, are also at the forefront of the ongoing industrial revolution. The chemical & petrochemical end-use industry is growing in the region because of the increase in demand for chemicals in various applications. Countries such as India, Indonesia, and Thailand are investing in new projects to decrease chemical imports as well as fulfill domestic demands, which will, in turn, drive the chemical industry in APAC. The growth of this industry drives the demand for thermal ceramics in thermal insulation applications. These factors, therefore, provide growth opportunities to the thermal ceramic market.
The key factor restraining the growth of the thermal ceramics market is the carcinogenic nature of ceramic fibers. Many countries have set stringent regulations on the use of ceramic fibers and workplace exposure to materials, such as alumina and silica.
Companies such as Morgan Thermal Ceramics (UK), Unifrax (US), IBIDEN (Japan), Isolite Insulating Products (Japan), Luyang Energy-Saving Materials (China), RHI Magnesita (Austria), Rath (US), Mitsubishi Chemical Corporation (Japan), 3M (US), and YESO Insulating Products (China), have adopted various developmental strategies, such as new product launches, mergers & acquisitions, agreements, and investments & expansions to enhance their foothold in the market.
Frequently Asked Questions (FAQ):
What is the market size of Thermal Ceramics Market?
The Thermal Ceramics Market was valued at USD 3.11 billion in 2017 and is projected to reach USD 5.02 billion by 2023, at a CAGR of 8.4%.
What is the forecast period considered in Thermal Ceramics Industry Report?
Forecast period considered for Thermal Ceramics Market is 2018-2023.
What is the growth rate of Thermal Ceramics Market?
The Thermal Ceramics Market is growing at a CAGR of 8.4%
Can you provide market share analysis of key players in Thermal Ceramics Market?
Yes, we can provide company ranking/market size analysis of key players. Is there any specific companies that you like to focus on?
To speak to our analyst for a discussion on the above findings, click Speak to Analyst
 Exclusive indicates content/data unique to MarketsandMarkets and not available with any competitors.
Table of Contents
1 Introduction (Page No. - 14)
1.1 Objectives of the Study
1.2 Market Definition
1.3 Market Scope
1.3.1 Years Considered for the Study
1.4 Currency
1.5 Unit Considered
1.6 Stakeholders
2 Research Methodology (Page No. - 17)
2.1 Research Data
2.1.1 Secondary Data
2.1.1.1 Key Data From Secondary Sources
2.1.2 Primary Data
2.1.2.1 Key Data From Primary Sources
2.1.2.2 Key Industry Insights
2.1.2.3 Breakdown of Primary Interviews
2.2 Market Size Estimation
2.2.1 Bottom-Up Approach
2.2.2 Top-Down Approach
2.3 Data Triangulation
2.4 Assumptions
2.5 Limitations
3 Executive Summary (Page No. - 25)
4 Premium Insights (Page No. - 29)
4.1 Significant Opportunities in the Thermal Ceramics Market
4.2 APAC Thermal Ceramic Market, By End-Use Industry and Country
4.3 Thermal Ceramics Market, By Temperature Range
4.4 Thermal Ceramic Market, By End-Use Industry
4.5 Thermal Ceramics Market, By Region
5 Market Overview (Page No. - 32)
5.1 Introduction
5.2 Market Dynamics
5.2.1 Drivers
5.2.1.1 Growing Need for Energy Savings
5.2.1.2 Rapid Infrastructural Development in Emerging Economies of APAC
5.2.1.3 High Growth Potential in Non-Metallic Minerals
5.2.2 Restraints
5.2.2.1 Carcinogenic Nature of Ceramic Fibers
5.2.2.2 Environmental Concerns Related to Refractories
5.2.3 Opportunities
5.2.3.1 Development of Low Bio-Persistent Materials
5.2.3.2 Need for Recycling of Refractories
5.3 Porter�s Five Forces Analysis
5.3.1 Threat of New Entrants
5.3.2 Threat of Substitutes
5.3.3 Bargaining Power of Buyers
5.3.4 Bargaining Power of Suppliers
5.3.5 Intensity of Competitive Rivalry
5.4 Macroeconomic Indicators
5.4.1 Introduction
5.4.2 Trends and Forecast of GDP
5.4.3 Automotive Industry
5.4.4 Chemical Industry
5.5 Energy Consumption Data, 2016
5.6 Crude Oil Production Data, 2016
5.7 Steel Industry Data, 2016
5.8 Manufacturing GDP Growth Rate, 2016
6 Expert Interview (Page No. - 42)
7 Thermal Ceramics Market, By Type (Page No. - 44)
7.1 Introduction
7.2 Ceramic Fibers
7.2.1 Vitreous Alumina-Silica Ceramic Fiber
7.2.1.1 Refractory Ceramic Fibers (RCF)
7.2.2 Low Bio-Persistent Ceramic Fibers
7.2.3 Polycrystalline Ceramic Fibers
7.3 Insulating Firebricks
7.3.1 Acidic Refractory Bricks
7.3.2 Neutral Refractory Bricks
7.3.3 Basic Refractory Bricks
8 Thermal Ceramics Market, By Temperature Range (Page No. - 49)
8.1 Introduction
8.2 650�1,000○C
8.3 1,000�1,400○C
8.4 1,400�1,600○C
9 Thermal Ceramic Market, By End-Use Industry (Page No. - 52)
9.1 Introduction
9.2 Chemical & Petrochemical
9.2.1 Chemical
9.2.2 Petrochemical
9.3 Mining & Metal Processing
9.3.1 Iron & Steel
9.3.2 Aluminum
9.3.3 Others
9.4 Manufacturing
9.4.1 Cement
9.4.2 Glass
9.4.3 Others
9.4.3.1 Ceramics
9.5 Power Generation
9.6 Others
10 Thermal Ceramics Market, By Region (Page No. - 57)
10.1 Introduction
10.2 APAC
10.2.1 China
10.2.2 India
10.2.3 Japan
10.2.4 South Korea
10.2.5 Rest of APAC
10.3 North America
10.3.1 US
10.3.2 Canada
10.3.3 Mexico
10.4 Europe
10.4.1 Germany
10.4.2 UK
10.4.3 Russia
10.4.4 France
10.4.5 Rest of Europe
10.5 Middle East & Africa
10.5.1 Saudi Arabia
10.5.2 South Africa
10.5.3 Rest of the Middle East & Africa
10.6 South America
10.6.1 Brazil
10.6.2 Argentina
10.6.3 Rest of South America
11 Competitive Landscape (Page No. - 91)
11.1 Overview
11.2 Market Share Analysis of Key Players
11.3 Competitive Scenario
11.3.1 Investment & Expansion
11.3.2 Merger & Acquisition
11.3.3 New Product Launch
11.3.4 Agreement, Partnership & Joint Venture
12 Company Profiles (Page No. - 96)
(Business Overview, Products Offered, Recent Developments, SWOT Analysis, MnM View)
12.1 Morgan Advanced Materials
12.2 Unifrax
12.3 Luyang Energy-Saving Materials
12.4 Isolite Insulating Products
12.5 RHI Magnesita N.V.
12.6 3M
12.7 Ibiden
12.8 Mitsubishi Chemical Corporation
12.9 Rath Inc.
12.10 Yeso Insulating Products
Details on Business Overview, Products Offered, Recent Developments, SWOT Analysis, MnM View Might Not Be Captured in Case of Unlisted Companies.
12.11 Others
12.11.1 Bnz Materials
12.11.2 Pyrotek
12.11.3 Promat International
13 Appendix (Page No. - 118)
13.1 Insights From Industry Experts
13.2 Discussion Guide
13.3 Knowledge Store: Marketsandmarkets� Subscription Portal
13.4 Introducing RT: Real-Time Market Intelligence
13.5 Available Customizations
13.6 Related Reports
13.7 Author Details
List of Tables (77 Tables)
Table 1 Trends and Forecast of GDP, USD Billion (2017�2022)
Table 2 Motor Vehicle Production, By Key Country, 2015�2016
Table 3 Energy Consumption Data, By Key Country, 2015�2016
Table 4 Crude Oil Production Data, By Key Country, 2015�2016
Table 5 Steel Production Data, By Key Country, 2016
Table 6 Manufacturing GDP Growth Rate, By Key Country, 2016
Table 7 Thermal Ceramics Market Size, By Type, 2016�2023 (Kiloton)
Table 8 Thermal Ceramic Market Size, By Type, 2016�2023 (USD Million)
Table 9 Forms of Ceramic Fibers
Table 10 Thermal Ceramics Market Size, By Temperature Range, 2016�2023 (Kiloton)
Table 11 Thermal Ceramic Market Size, By Temperature Range, 2016�2023 (USD Million)
Table 12 Thermal Ceramics Market Size, By End-Use Industry, 2016�2023 (Kiloton)
Table 13 Thermal Ceramic Market Size, By End-Use Industry, 2016�2023 (USD Million)
Table 14 Thermal Ceramics Market Size, By Region, 2016�2023 (Kiloton)
Table 15 Thermal Ceramic Market Size, By Region, 2016�2023 (USD Million)
Table 16 APAC: Market Size, By Country, 2016�2023 (Kiloton)
Table 17 APAC: Market Size, By Country, 2016�2023 (USD Million)
Table 18 APAC: Market Size, By End-Use Industry, 2016�2023 (Kiloton)
Table 19 APAC: Market Size, By End-Use Industry, 2016�2023 (USD Million)
Table 20 China: Market Size, By End-Use Industry, 2016�2023 (Kiloton)
Table 21 China: Market Size, By End-Use Industry, 2016�2023 (USD Million)
Table 22 India: Market Size, By End-Use Industry, 2016�2023 (Kiloton)
Table 23 India: Market Size, By End-Use Industry, 2016�2023 (USD Million)
Table 24 Japan: Market Size, By End-Use Industry, 2016�2023 (Kiloton)
Table 25 Japan: Market Size, By End-Use Industry, 2016�2023 (USD Million)
Table 26 South Korea: Market Size, By End-Use Industry, 2016�2023 (Kiloton)
Table 27 South Korea: Market Size, By End-Use Industry, 2016�2023 (USD Million)
Table 28 Rest of APAC: Market Size, By End-Use Industry, 2016�2023 (Kiloton)
Table 29 Rest of APAC: Market Size, By End-Use Industry, 2016�2023 (USD Million)
Table 30 North America: Market Size, By Country, 2016�2023 (Kiloton)
Table 31 North America: Market Size, By Country, 2016�2023 (USD Million)
Table 32 North America: Market Size, By End-Use Industry, 2016�2023 (Kiloton)
Table 33 North America: Market Size, By End-Use Industry, 2016�2023 (USD Million)
Table 34 US: Market Size, By End-Use Industry, 2016�2023 (Kiloton)
Table 35 US: Market Size, By End-Use Industry, 2016�2023 (USD Million)
Table 36 Canada: Market Size, By End-Use Industry, 2016�2023 (Kiloton)
Table 37 Canada: Market Size, By End-Use Industry, 2016�2023 (USD Million)
Table 38 Mexico: Market Size, By End-Use Industry, 2016�2023 (Kiloton)
Table 39 Mexico: Market Size, By End-Use Industry, 2016�2023 (USD Million)
Table 40 Europe: Market Size, By Country, 2016�2023 (Kiloton)
Table 41 Europe: Market Size, By Country, 2016�2023 (USD Million)
Table 42 Europe: Market Size, By End-Use Industry, 2016�2023 (Kiloton)
Table 43 Europe: Market Size, By End-Use Industry, 2016�2023 (USD Million)
Table 44 Germany: Market Size, By End-Use Industry, 2016�2023 (Kiloton)
Table 45 Germany: Market Size, By End-Use Industry, 2016�2023 (USD Million)
Table 46 UK: Market Size, By End-Use Industry, 2016�2023 (Kiloton)
Table 47 UK: Market Size, By End-Use Industry, 2016�2023 (USD Million)
Table 48 Russia: Market Size, By End-Use Industry, 2016�2023 (Kiloton)
Table 49 Russia: Market Size, By End-Use Industry, 2016�2023 (USD Million)
Table 50 France: Market Size, By End-Use Industry, 2016�2023 (Kiloton)
Table 51 France: Market Size, By End-Use Industry, 2016�2023 (USD Million)
Table 52 Rest of Europe: Market Size, By End-Use Industry, 2016�2023 (Kiloton)
Table 53 Rest of Europe: Thermal Ceramics Market Size, By End-Use Industry, 2016�2023 (USD Million)
Table 54 Middle East & Africa: Market Size, By Country, 2016�2023 (Kiloton)
Table 55 Middle East & Africa: Market Size, By Country, 2016�2023 (USD Million)
Table 56 Middle East & Africa: Market Size, By End-Use Industry, 2016�2023 (Kiloton)
Table 57 Middle East & Africa: Market Size, By End-Use Industry, 2016�2023 (USD Million)
Table 58 Saudi Arabia: Market Size, By End-Use Industry, 2016�2023 (Kiloton)
Table 59 Saudi Arabia: Market Size, By End-Use Industry, 2016�2023 (USD Million)
Table 60 South Africa: Market Size, By End-Use Industry, 2016�2023 (Kiloton)
Table 61 South Africa: Market Size, By End-Use Industry, 2016�2023 (USD Million)
Table 62 Rest of the Middle East & Africa: Market Size, By End-Use Industry, 2016�2023 (Kiloton)
Table 63 Rest of the Middle East & Africa: Market Size, By End-Use Industry, 2016�2023 (USD Million)
Table 64 South America: Thermal Ceramics Market Size, By Country, 2016�2023 (Kiloton)
Table 65 South America: Market Size, By Country, 2016�2023 (USD Million)
Table 66 South America: Market Size, By End-Use Industry, 2016�2023 (Kiloton)
Table 67 South America: Market Size, By End-Use Industry, 2016�2023 (USD Million)
Table 68 Brazil: Thermal Ceramics Market Size, By End-Use Industry, 2016�2023 (Kiloton)
Table 69 Brazil: Market Size, By End-Use Industry, 2016�2023 (USD Million)
Table 70 Argentina: Market Size, By End-Use Industry, 2016�2023 (Kiloton)
Table 71 Argentina: Market Size, By End-Use Industry, 2016�2023 (USD Million)
Table 72 Rest of South America: Thermal Ceramics Market Size, By End-Use Industry, 2016�2023 (Kiloton)
Table 73 Rest of South America: Market Size, By End-Use Industry, 2016�2023 (USD Million)
Table 74 Investments & Expansions, 2014�2017
Table 75 Mergers & Acquisitions 2013�2018
Table 76 New Product Launches, 2014�2018
Table 77 Agreement, Partnership & Joint Ventures, 2014
List of Figures (37 Figures)
Figure 1 Thermal Ceramics Market Segmentation
Figure 2 Thermal Ceramic Market: Research Design
Figure 3 Market Size Estimation: Bottom-Up Approach
Figure 4 Market Size Estimation: Top-Down Approach
Figure 5 Thermal Ceramics Market: Data Triangulation
Figure 6 Thermal Ceramic Market Size, (Kiloton and USD Billion), 2016�2023
Figure 7 Ceramic Fibers to Dominate the Thermal Ceramics Market
Figure 8 1,400�1,600�C Temperature Range Segment to Witness the Highest CAGR During the Forecast Period
Figure 9 Mining & Metal Processing Led the Thermal Ceramic Market
Figure 10 China to Be the Largest Market of Thermal Ceramics Between 2018 and 2023
Figure 11 APAC Dominated Thermal Ceramics Market in 2017
Figure 12 Increased Demand From Mining & Metal Processing Industry to Drive the Market
Figure 13 Mining & Metal Processing Segment Dominated Thermal Eramics Market in APAC
Figure 14 1,000�1,400�C Temperature Range to Be the Fastest-Growing Segment
Figure 15 Manufacturing End-Use Industry to Register the Highest CAGR
Figure 16 APAC Dominated the Thermal Ceramics Market, 2017
Figure 17 Overview of Factors Governing the Thermal Ceramic Market
Figure 18 Thermal Ceramics Market: Porter�s Five Forces Analysis
Figure 19 Growth Rate of Chemical Industry (2015�2018)
Figure 20 Ceramic Fibers to Drive the Overall Thermal Ceramics Market
Figure 21 1,000�1,400�C Temperature Range Segment to Witness High Growth During the Forecast Period
Figure 22 Metal Processing End-Use Industry to Drive Thermal Ceramics Market
Figure 23 India to Register the Highest CAGR in the Thermal Ceramic Market
Figure 24 APAC: Thermal Ceramics Market Snapshot
Figure 25 North America: Thermal Ceramic Market Snapshot
Figure 26 Europe: Thermal Ceramics Market Snapshot
Figure 27 Companies Adopted New Product Launch as the Key Growth Strategy
Figure 28 Market Share Analysis, 2017
Figure 29 Morgan Advanced Materials: Company Snapshot
Figure 30 Morgan Advanced Materials: SWOT Analysis
Figure 31 Luyang Energy-Saving Materials: Company Snapshot
Figure 32 RHI Magnesita: Company Snapshot
Figure 33 RHI Magnesita: SWOT Analysis
Figure 34 3M: Company Snapshot
Figure 35 3M: SWOT Analysis
Figure 36 Ibiden: Company Snapshot
Figure 37 Ibiden: SWOT Analysis


Growth opportunities and latent adjacency in Thermal Ceramics Market