Magnesia Chrome Brick Market by Type (Direct Bonded, Fused/Rebonded, Chemically Bonded,Fused Cast), End-use Industry (Iron & Steel, Power generation, Non-Ferrous metals, Cement, Glass), and Region - Global Forecast to 2025
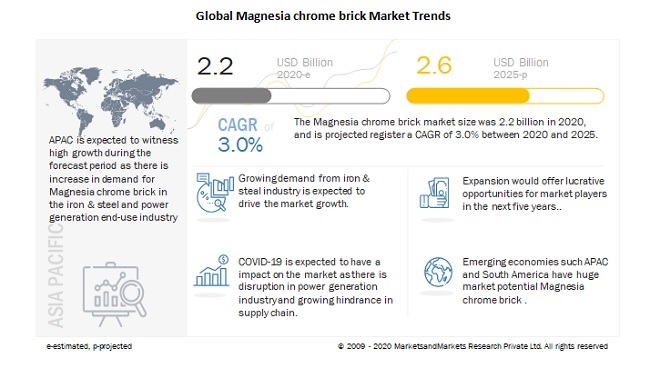
[ 129 Pages Report] The Magnesia chrome brick market size is expected to grow at a CAGR of 3.0%, by value, during the forecast period. The market is estimated to be USD 2.2 billion in 2020 and is projected to reach USD 2.6 billion by 2025. The driving factors for Magnesia chrome brick market is its growing demand from iron & steel industry.
To know about the assumptions considered for the study, download the pdf brochure
COVID-19 Impact on the Magnesia chrome brick Market
The global Magnesia chrome brick market includes major Tier I and II suppliers like as RHI Magnesita (Austria), Visuvius (UK), Shinagawa Refractories (Japan), HarbisonWalker International (US) and Caldarys (France). These suppliers have their manufacturing facilities spread across various countries across Asia Pacific, Europe, North America, South America, and Middle East & Africa. COVID-19 has impacted their businesses as well.
These players have announced the suspension of production due to the lowered demand, supply chain bottlenecks, and to protect the safety of their employees in the US, France, Germany, Italy, and Spain during the COVID-19 pandemic. As a result, the demand for magnesia chrome brick is expected to decline in 2020. Manufacturers are likely to adjust production to prevent bottlenecks and plan production according to demand from tier 1 manufacturers.
Magnesia Chrome Brick : Market Dynamics:
Driver: Increase in infrastructural development in emerging countries
Growing urbanization and industrialization, especially in emerging economies such as India and China, has led to significant investment in the construction of residential and commercial buildings. According to the Global Construction Perspective and Oxford Economics, the global construction market will grow by 85% to USD 15.55 trillion worldwide by 2030, with three countries China, India and the US accounting for 57% of the global growth.
China is one of the fastest-growing economies; rising travel demand requires constant development of railways and roadways in the country. This has also boosted the growth of the automotive industry in China. The increased pace of infrastructure development in these emerging countries has led to an increase in the construction of residential and commercial buildings, which is expected to drive the demand for magnesia chrome brick in the iron & steel and cement industries. Increasing construction activities in emerging economies are also expected to drive the glass industry, which, in turn, will drive the magnesia chrome brick demand.
Restraint: Restrictions on the use of magnesia chrome brick due to the growing environmental concerns
The manufacturing process of magnesia chrome brick leads to the emission of organic particulate matter (PM) and harmful gases such as sulfur dioxide (SO2), nitrogen oxides (NOx), carbon monoxide (CO), carbon dioxide (CO2), fluorides, and volatile organic compounds (VOCs). Processes, including crushing, grinding, calcining, and drying, lead to the emission of PM, while gases and VOCs are emitted during firing and tar & pitch operations, respectively.
In the US, regulations regarding refractory waste disposal and guidelines regarding the use of refractories encourage recycling of chrome-based refractories, which are largely used in the iron & steel industry. Similarly, in Europe, projects such as ReStaR (Review and improvement of testing Standards for Refractory products), have been implemented to ensure the reliability and precision of the current refractory testing standards in the region. Such environmental regulations and restrictions on the use of refractory materials act as a restraining factor for the growth of the magnesia chrome brick market.
Opportunity: Recycling of magnesia chrome brick
The used refractory materials, which are further recycled to form secondary raw materials, are known as refractory grogs. Various magnesite and chromite grogs are used in recycling. The usage of recycled magnesia chrome brick depends on the quality of the actual refractory; 100% of the high-quality recycled magnesia chrome brick can be used in other processes, but only 0–30% of the recycled magnesia chrome brick can be used which are obtained from low-quality magnesia chrome brick. The need for recycling of refractory products has increased owing to the increase in the cost of raw materials and freight and environmental pressures that have compelled the companies to look for more sustainable alternatives for refractory applications.
There are several factors which played a pivotal role in the shift toward refractory recycling. From 2008 to 2010, the refractory industry worldwide underwent a very volatile period, during which, certain raw materials became almost impossible to procure due to high demand coupled with low supply. Pressure has been mounting on companies to become environmentally responsible by reducing their respective carbon footprints. Increased taxes on landfill sites and emissions are being enforced, and tax incentives are also proposed to motivate companies to increase their waste recycling efforts. The economic recession during the early part of 2009 affected the refractory sales. The manufacturers are striving to reduce prices to retain their market share. Therefore, recycling of magnesia chrome brick helps to reduce the production cost for the manufacturers, thus offering lucrative opportunities for the growth of this market.
Challenges: Overdependence on the iron & steel industry
The magnesia chrome brick market is highly dependent on the iron & steel industry, which covers around 60% of the global market. The rest 40% share is covered by end-use industries such as power generation, cement, glass, non-ferrous metal, and chemical. Hence, the downfall of iron & steel industry would lead to a consequent decline in the magnesia chrome brick market.
The demand for magnesia chrome brick from the iron & steel industry has been volatile over the past few years, which has significantly affected the market. Even with the rising demand for magnesia chrome brick from other industries and recovery of the global economic situation, the dependence of magnesia chrome brick market on the iron & steel industry is expected to remain unchanged, thus posing a huge challenge for the growth of the magnesia chrome brick market.
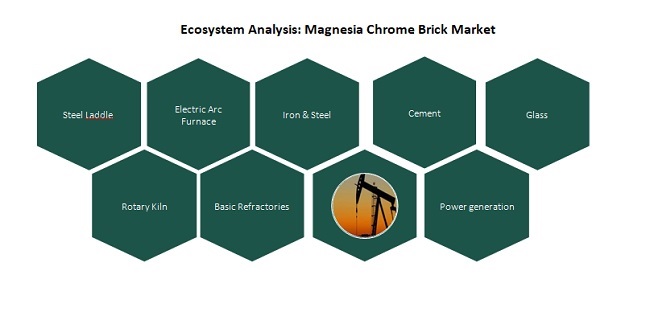
Ecosystem Analysis: Magnesia Chrome Brick Market
To know about the assumptions considered for the study, download the pdf brochure
Source: Secondary research, primary research, and MarketsandMarkets Analysis
“The Magnesia chrome brick market is projected to register a CAGR of 3.0% during the forecast period, in terms of value.”
The market is witnessing moderate growth, owing to increasing application, infrastructural development, and growing demand for these magnesia chrome brick in the Asia Pacific and Europe. Magnesia chrome brick are largely used in the iron & steel industry. The increasing use of magnesia chrome brick in iron & steel making and the rising construction activities is driving the Magnesia chrome brick market. Strict environmental and government regulations is the restraints for the Magnesia chrome brick market.
“Iron & Steel segment is expected to lead the Magnesia chrome brick market during the forecast period.”
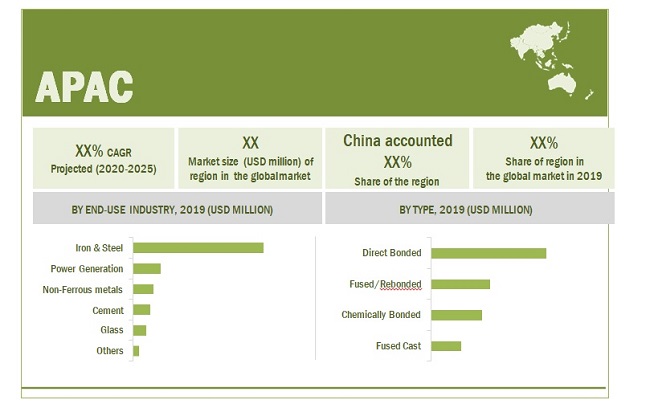
The iron & steel industry will continue to lead the Magnesia chrome brick market, , accounting for a share of 60.2% of the overall market, in 2019 terms of value. This was due to the increasing demand for infrastructure development and mounting demand for consumer goods such as automobiles. The increasing preference for high-cost, high-performance magnesia chrome brick is driven by its applications in the lining of various furnaces, ladles, and vessels, which are governed by the operating conditions at each stage in the process of manufacturing steel.
“Asia Pacific is the largest market for Magnesia chrome brick.”
Asia Pacific accounted for the largest share of the Magnesia chrome brick market in 2020. Factors such as the rapidly increasing consumption of Magnesia chrome brick in the iron & steel, power generation cement, and glass industries in countries such as China, Japan, India, South korea and Australia have led to an increased demand for Magnesia chrome brick in the Asia Pacific region.
Key Market Players
Magnesia chrome brick is a diversified and competitive market with a large number of global players and few regional and local players. RHI Magnesita (Austria), Visuvius (UK), Shinagawa Refractories (Japan), HarbisonWalker International (US) and Calderys(France). are some of the key players in the market.
Scope of the Report:
|
Report Metric |
Details |
|
Market Size Available for years |
2018-2025 |
|
Base year considered |
2019 |
|
Forecast period |
2020–2025 |
|
Forecast units |
Value (USD Billion) and Volume (Kiloton) |
|
Segments covered |
By Type, By End-use & By Region |
By Type
- Direct Bonded
- Fused/Rebonded
- Chemically bonded
- Fused Cast
By End-Use Industry
- Iron & Steel
- Power Generation
- Non-Ferrous metals
- Cement
- Glass
- Others
By Region
- North America
- Asia Pacific
- Europe
- South America
- Middle East and Africa
Recent Developments
- In January 2020, RHI Magnesita, acquired Missouri Refractories Co, Inc. (MORCO). MORCO perfectly fits into RHI Magnesita’s strategy to strengthen the company’s position in the North American refractory market.
- In March 2019, Vesuvius, acquired CCPI (US), a specialty refractory producer focused on tundish (steel continuous casting) applications and aluminum. This will help the company to expand presence in North America.
- In June 2019, Resco Products, announced the opening of its new R&D center in Greensboro in North Carolina. This R&D center is responsible for developing technical refractory capabilities to support customers requirement.
Frequently Asked Questions (FAQ):
Does this report cover volume tables in addition to the value tables?
Yes, volume tables are provided for each segment except offering.
Which countries are considered in the European region?
The report includes the following European countries
- Germany
- U.K.
- Turkey
- Italy
- Spain
- Russia
- France
- Rest of Europe
What is the COVID-19 impact on the Magnesia chrome brick market?
Industry experts believe that COVID-19 would have a impact on magnesia chrome brick market as there is an increase in demand for magnesia chrome brick in various industries such as cement, iron & steel and glass. Furthermore, they also believe that the market will rebound in Q4 in 2020.
What are some of the uses of Magnesia chrome brick?
Magnesia chrome brick are largely used in the cement applications by the construction industries, power generation and iron & steel l end-use industries. .
To speak to our analyst for a discussion on the above findings, click Speak to Analyst

TABLE OF CONTENTS
1 INTRODUCTION (Page No. - 17)
1.1 OBJECTIVES OF THE STUDY
1.2 MARKET DEFINITION
1.3 MARKET SCOPE
1.3.1 MARKET SEGMENTATION : MAGNESIA CHROME BRICK
1.3.2 REGIONS COVERED
1.3.3 YEARS CONSIDERED FOR THE STUDY
1.4 CURRENCY
1.5 UNIT CONSIDERED
1.6 LIMITATIONS
1.7 STAKEHOLDERS
2 RESEARCH METHODOLOGY (Page No. - 21)
2.1 RESEARCH DATA
2.1.1 SECONDARY DATA
2.1.1.1 Key data from secondary sources
2.1.2 PRIMARY DATA
2.1.2.1 Key data from primary sources
2.1.2.2 Breakdown of primary interviews
2.2 BASE NUMBER CALCULATION
2.2.1 SUPPLY-SIDE APPROACH
2.2.2 DEMAND-SIDE APPROACH
2.3 MARKET SIZE ESTIMATION
2.3.1 MARKET SIZE ESTIMATION METHODOLOGY: BOTTOM-UP AP
2.3.2 MARKET SIZE ESTIMATION METHODOLOGY: TOP-DOWN APPROACH
2.4 DATA TRIANGULATION
2.5 ASSUMPTIONS
3 EXECUTIVE SUMMARY (Page No. - 28)
4 PREMIUM INSIGHTS (Page No. - 32)
4.1 ATTRACTIVE OPPORTUNITIES IN THE MAGNESIA CHROME BRICK MARKET
4.2 MAGNESIA CHROME BRICK MARKET, BY REGION
4.3 ASIA PACIFIC MAGNESIA CHROME BRICK MARKET, BY COUNTRY AND TYPE
4.4 MAGNESIA CHROME BRICK MARKET: MAJOR COUNTRIES
5 MARKET OVERVIEW (Page No. - 36)
5.1 INTRODUCTION
5.2 MARKET DYNAMICS
5.2.1 DRIVERS
5.2.1.1 Increase in infrastructural development in emerging economies
5.2.1.2 Growing demand for high-grade magnesia chrome bricks from the iron & steel industry
5.2.1.3 High growth rate witnessed by the non-metallic minerals industry
5.2.2 RESTRAINTS
5.2.2.1 Restrictions on the use of magnesia chrome bricks due to growing environmental concerns
5.2.2.2 Monopoly of China over raw material supply
5.2.3 OPPORTUNITIES
5.2.3.1 Recycling of magnesia chrome bricks
5.2.4 CHALLENGES
5.2.4.1 Overdependence on the iron & steel industry
5.3 PORTER'S FIVE FORCES ANALYSIS
5.3.1 BARGAINING POWER OF SUPPLIERS
5.3.2 THREAT OF NEW ENTRANTS
5.3.3 THREAT OF SUBSTITUTES
5.3.4 BARGAINING POWER OF BUYERS
5.3.5 RIVALRY AMONG EXISTING PLAYERS
5.4 POLICY & REGULATIONS
5.4.1 ENVIRONMENTAL PROTECTION AGENCY
5.4.2 REACH
5.4.3 RESTAR
5.5 VALUE CHAIN ANALYSIS
5.5.1 VALUE CHAIN OF MAGNESIA CHROME BRICK
5.5.2 IMPACT OF COVID-19 ON SUPPLY CHAIN
5.6 MACROECONOMIC INDICATORS
6 MAGNESIA CHROME BRICK MARKET, BY TYPE (Page No. - 48)
6.1 INTRODUCTION
6.2 DIRECT BONDED
6.2.1 RISING USE OF DIRECT BONDED MAGNESIA CHROME BRICKS FROM VARIOUS END-USE INDUSTRIES
6.3 FUSED/REBONDED
6.3.1 INCREASED DEMAND FROM NON-FERROUS METAL SMELTING
6.4 CHEMICALLY BONDED
6.4.1 INCREASED STEEL PRODUCTION EXPECTED TO DRIVE DEMAND
6.5 FUSED CAST
6.5.1 EXCELLENT SLAG RESISTANCE PROPERTY TO DRIVE DEMAND FROM NON-FERROUS METALS INDUSTRY
7 MAGNESIA CHROME BRICK MARKET, BY END-USE INDUSTRY (Page No. - 55)
7.1 INTRODUCTION
7.2 IRON & STEEL
7.2.1 DEMAND FROM MAJOR STEEL MANUFACTURING COUNTRIES DRIVING THE MARKET
7.3 POWER GENERATION
7.3.1 DEMAND FOR MAGNESIA CHROME BRICK FROM THE POWER GENERATION INDUSTRY WITNESSING SLOW GROWTH
7.4 NON-FERROUS METALS
7.4.1 RISING DEMAND IN AUTOMOTIVE AND AVIATION INDUSTRIES
7.5 CEMENT
7.5.1 INFRASTRUCTURAL DEVELOPMENTS IN EMERGING ECONOMIES TO DRIVE DEMAND
7.6 GLASS
7.6.1 INCREASING RESIDENTIAL AND COMMERCIAL CONSTRUCTION IN EMERGING ECONOMIES
7.7 OTHERS
8 MAGNESIA CHROME BRICK MARKET, BY REGION (Page No. - 62)
8.1 INTRODUCTION
8.2 APAC
8.2.1 IMPACT OF COVID-19 IN APAC
8.2.2 CHINA
8.2.2.1 Increasing demand for iron and steel in the construction industry drive the market for magnesia chrome brick
8.2.3 JAPAN
8.2.3.1 High demand for steel from the automobile industry drive the market in the country
8.2.4 INDIA
8.2.4.1 Growth of iron & steel, glass, and power generation industries fuel the market
8.2.5 SOUTH KOREA
8.2.5.1 Demand from various end-use industries expected to boost the market in this country
8.2.6 AUSTRALIA
8.2.6.1 High demand for iron and steel in the construction industry fuel the market
8.2.7 REST OF APAC
8.3 EUROPE
8.3.1 IMPACT OF COVID-19 IN EUROPE
8.3.2 RUSSIA
8.3.2.1 Infrastructural development and growing urbanization boosting the demand
8.3.3 GERMANY
8.3.3.1 Growth of the construction industry drive the market
8.3.4 TURKEY
8.3.4.1 Rising demand for iron and steel to boost the market
8.3.5 ITALY
8.3.5.1 Demand from iron & steel and construction industries drive the market
8.3.6 FRANCE
8.3.6.1 Iron & steel and non-ferrous metals industries drive demand for magnesia chrome brick
8.3.7 SPAIN
8.3.7.1 Increased export of iron & steel has boosted the demand for magnesia chrome brick in Spain
8.3.8 UK
8.3.8.1 Rising demand from non-ferrous and iron & steel industries fuel the demand for magnesia chrome brick
8.3.9 REST OF EUROPE
8.4 NORTH AMERICA
8.4.1 IMPACT OF COVID-19 ON MAGNESIA CHROME BRICKS MARKET IN NORTH AMERICA
8.4.2 US
8.4.2.1 Growth of the iron & steel industry drive the market in the US
8.4.3 CANADA
8.4.3.1 Residential and public infrastructural developments fuel the demand for magnesia chrome brick in Canada
8.4.4 MEXICO
8.4.4.1 Increased demand from the manufacturing sector boost the market
8.5 MIDDLE EAST & AFRICA
8.5.1 IMPACT OF COVID-19 IN MIDDLE EAST & AFRICA
8.5.2 SAUDI ARABIA
8.5.2.1 Growth of the construction industry expected to drive the market
8.5.3 UAE
8.5.3.1 Development of the non-oil sector propel the market in the UAE
8.5.4 SOUTH AFRICA
8.5.4.1 Demand from the iron & steel industry to drive the market
8.5.5 REST OF MIDDLE EAST AND AFRICA
8.6 SOUTH AMERICA
8.6.1 IMPACT OF COVID-19 IN SOUTH AMERICA
8.6.2 BRAZIL
8.6.2.1 Growing demand from various end-use industries to boost the market
8.6.3 ARGENTINA
8.6.3.1 The increasing demand for non-ferrous metals expected to drive the market in Argentina
8.6.4 REST OF SOUTH AMERICA
9 COMPETITIVE LANDSCAPE (Page No. - 98)
9.1 OVERVIEW
9.2 MARKET SHARE ANALYSIS
9.3 COMPETITIVE SCENARIO
9.3.1 MERGERS & ACQUISITIONS
9.3.2 EXPANSIONS
10 COMPANY PROFILES (Page No. - 103)
10.1 RHI MAGNESITA
10.1.1 BUSINESS OVERVIEW
10.1.2 PRODUCTS OFFERED
10.1.3 RECENT DEVELOPMENTS
10.1.4 SWOT ANALYSIS
10.1.5 WINNING IMPERATIVES
10.1.6 CURRENT FOCUS AND STRATEGIES
10.1.7 THREAT FROM COMPETITION
10.1.8 RHI MAGNESITA'S RIGHT TO WIN
10.2 VESUVIUS
10.2.1 BUSINESS OVERVIEW
10.2.2 PRODUCTS OFFERED
10.2.3 RECENT DEVELOPMENTS
10.2.4 SWOT ANALYSIS
10.2.5 WINNING IMPERATIVES
10.2.6 CURRENT FOCUS AND STRATEGIES
10.2.7 THREAT FROM COMPETITION
10.2.8 VESUVIUS' RIGHT TO WIN
10.3 SHINAGAWA REFRACTORIES
10.3.1 BUSINESS OVERVIEW
10.3.2 PRODUCTS OFFERED
10.3.3 SWOT ANALYSIS
10.3.4 WINNING IMPERATIVES
10.3.5 CURRENT FOCUS AND STRATEGIES
10.3.6 THREAT FROM COMPETITION
10.3.7 SHINAGAWA REFRACTORIES' RIGHT TO WIN
10.4 HARBISONWALKER INTERNATIONAL
10.4.1 BUSINESS OVERVIEW
10.4.2 PRODUCTS OFFERED
10.4.3 RECENT DEVELOPMENTS
10.4.4 SWOT ANALYSIS
10.4.5 WINNING IMPERATIVES
10.4.6 CURRENT FOCUS AND STRATEGIES
10.4.7 THREAT FROM COMPETITION
10.4.8 HARBISONWALKER INTERNATIONAL'S RIGHT TO WIN
10.5 CALDERYS
10.5.1 BUSINESS OVERVIEW
10.5.2 PRODUCTS OFFERED
10.5.3 SWOT ANALYSIS
10.5.4 WINNING IMPERATIVES
10.5.5 CURRENT FOCUS AND STRATEGIES
10.5.6 THREAT FROM COMPETITION
10.5.7 CALDERYS' RIGHT TO WIN
10.6 CHOSUN REFRACTORIES CO. LTD
10.6.1 BUSINESS OVERVIEW
10.6.2 PRODUCTS OFFERED
10.7 MAGNEZIT GROUP
10.7.1 BUSINESS OVERVIEW
10.7.2 PRODUCTS OFFERED
10.8 RESCO PRODUCTS
10.8.1 BUSINESS OVERVIEW
10.8.2 PRODUCTS OFFERED
10.8.3 RECENT DEVELOPMENTS
10.9 RS KILN REFRACTORY COMPANY
10.9.1 BUSINESS OVERVIEW
10.9.2 PRODUCTS OFFERED
10.1 KT REFRACTORIES
10.10.1 BUSINESS OVERVIEW
10.10.2 PRODUCTS OFFERED
10.11 ADDITIONAL COMPANIES
10.11.1 PUYANG REFRACTORIES GROUP
10.11.2 TRL KROSAKI
10.11.3 MINEREX INDIA
10.11.4 RUITAI MATERIALS TECHNOLOGY
10.11.5 QINGHUA REFRACTORIES CO. LTD.
10.11.6 REFRACTECHNIK HOLDING GMBH
10.11.7 GITA REFRACTORIES
10.11.8 MAYERTON
10.11.9 LANEXIS
10.11.10 LIAONING LIAN REFRACTORIES CO. LTD
10.11.11 JBTC
11 APPENDIX (Page No. - 128)
11.1 DISCUSSION GUIDE
11.2 KNOWLEDGE STORE: MARKETSANDMARKETS' SUBSCRIPTION PORTAL
11.3 AVAILABLE CUSTOMIZATIONS
11.4 RELATED REPORTS
LIST OF TABLES (75 Tables)
TABLE 1 TRENDS AND FORECAST OF THE CONSTRUCTION INDUSTRY, BY COUNTRY, 2014-2018 (USD BILLION)
TABLE 2 WORLD CRUDE STEEL PRODUCTION, BY MAJOR COUNTRY, 2018-2019 (MILLION TON
TABLE 3 MAGNESIA CHROME BRICK MARKET SIZE, BY TYPE, 2018-2025 (USD MILLION)
TABLE 4 MAGNESIA CHROME BRICK MARKET SIZE, BY TYPE, 2018-2025 (KILOTON
TABLE 5 DIRECT BONDED: MAGNESIA CHROME BRICK MARKET SIZE, BY REGION, 2018-2025 (USD MILLION)
TABLE 6 DIRECT BONDED: MAGNESIA CHROME BRICK MARKET SIZE, BY REGION, 2018-2025 (KILOTON
TABLE 7 FUSED/REBONDED: MAGNESIA CHROME BRICK MARKET SIZE, BY REGION, 2018-2025 (USD MILLION)
TABLE 8 FUSED/REBONDED: MAGNESIA CHROME BRICK MARKET SIZE, BY REGION, 2018-2025 (KILOTON
TABLE 9 CHEMICALLY BONDED: MAGNESIA CHROME BRICK MARKET SIZE, BY REGION, 2018-2025 (USD MILLION)
TABLE 10 CHEMICALLY BONDED: MAGNESIA CHROME BRICK MARKET SIZE, BY REGION, 2018-2025 (KILOTON
TABLE 11 FUSED CAST: MAGNESIA CHROME BRICK MARKET SIZE, BY REGION, 2018-2025 (USD MILLION)
TABLE 12 FUSED CAST: MAGNESIA CHROME BRICK MARKET SIZE, BY REGION, 2018-2025 (KILOTON
TABLE 13 MAGNESIA CHROME BRICK MARKET SIZE, BY END-USE INDUSTRY, 2018-2025 (USD MILLION)
TABLE 14 IRON & STEEL: MAGNESIA CHROME BRICK MARKET SIZE, 2018-2025 (USD MILLION)
TABLE 15 POWER GENERATION: MAGNESIA CHROME BRICK MARKET SIZE, BY REGION 2018-2025 (USD MILLION)
TABLE 16 NON-FERROUS METALS: MAGNESIA CHROME BRICK MARKET SIZE, BY REGION 2018-2025 (USD MILLION)
TABLE 17 CEMENT: MAGNESIA CHROME BRICK MARKET SIZE, BY REGION 2018-2025 (USD MILLION)
TABLE 18 GLASS: MAGNESIA CHROME BRICK MARKET SIZE, BY REGION 2018-2025 (USD MILLION)
TABLE 19 OTHERS: MAGNESIA CHROME BRICK MARKET SIZE, BY REGION 2018-2025 (USD MILLION)
TABLE 20 MAGNESIA CHROME BRICK MARKET, BY REGION, 2018-2025 (USD MILLION)
TABLE 21 MAGNESIA CHROME BRICK MARKET, BY REGION, 2018-2025 (KILOTON
TABLE 22 MAGNESIA CHROME BRICK MARKET, BY TYPE, 2018-2025 (USD MILLION)
TABLE 23 MAGNESIA CHROME BRICK MARKET, BY TYPE, 2018-2025 (KILOTON
TABLE 24 MAGNESIA CHROME BRICK MARKET, BY END-USE INDUSTRY, 2018-2025 (USD MILLION)
TABLE 25 APAC: MAGNESIA CHROME BRICK MARKET SIZE, BY COUNTRY, 2018-2025 (USD MILLION)
TABLE 26 APAC: MAGNESIA CHROME BRICK MARKET SIZE, BY COUNTRY, 2018-2025 (KILOTON
TABLE 27 APAC: MAGNESIA CHROME BRICK MARKET SIZE, BY TYPE, 2018-2025 (USD MILLION)
TABLE 28 APAC: MAGNESIA CHROME BRICK MARKET SIZE, BY TYPE, 2018-2025 (KILOTON
TABLE 29 APAC: MAGNESIA CHROME BRICK MARKET SIZE, BY END-USE INDUSTRY, 2018-2025 (USD MILLION)
TABLE 30 CHINA: MAGNESIA CHROME BRICK MARKET SIZE, BY END-USE INDUSTRIES, 2018-2025 (USD MILLION)
TABLE 31 JAPAN: MAGNESIA CHROME BRICK MARKET SIZE, BY END-USE INDUSTRY, 2018-2025 (USD MILLION)
TABLE 32 INDIA: MAGNESIA CHROME BRICK MARKET SIZE, BY END-USE INDUSTRY, 2018-2025 (USD MILLION)
TABLE 33 SOUTH KOREA: MAGNESIA CHROME BRICK MARKET SIZE, BY END-USE INDUSTRY, 2018-2025 (USD MILLION)
TABLE 34 AUSTRALIA: MAGNESIA CHROME BRICK MARKET SIZE, BY END-USE INDUSTRY, 2018-2025 (USD MILLION)
TABLE 35 REST OF APAC: MAGNESIA CHROME BRICK MARKET SIZE, BY END-USE INDUSTRY, 2018-2025 (USD MILLION)
TABLE 36 EUROPE: MAGNESIA CHROME BRICK MARKET SIZE, BY COUNTRY, 2018-2025 (USD MILLION)
TABLE 37 EUROPE: MAGNESIA CHROME BRICK MARKET SIZE, BY COUNTRY, 2018-2025 (KILOTON
TABLE 38 EUROPE: MAGNESIA CHROME BRICK MARKET SIZE, BY TYPE, 2018-2025 (USD MILLION)
TABLE 39 EUROPE: MAGNESIA CHROME BRICK MARKET SIZE, BY TYPE, 2018-2025 (KILOTON
TABLE 40 EUROPE: MAGNESIA CHROME BRICK MARKET SIZE, BY END-USE INDUSTRY, 2018-2025 (USD MILLION)
TABLE 41 RUSSIA: MAGNESIA CHROME BRICK MARKET SIZE, BY END-USE INDUSTRY, 2020-2025 (USD MILLION)
TABLE 42 GERMANY: MAGNESIA CHROME BRICK MARKET SIZE, BY END-USE INDUSTRY, 2020-2025 (USD MILLION)
TABLE 43 TURKEY: MAGNESIA CHROME BRICK MARKET SIZE, BY END-USE INDUSTRY, 2020-2025 (USD MILLION)
TABLE 44 ITALY: MAGNESIA CHROME BRICK MARKET SIZE, BY END-USE INDUSTRY, 2020-2025 (USD MILLION)
TABLE 45 FRANCE: MAGNESIA CHROME BRICK MARKET SIZE, BY END-USE INDUSTRY, 2020-2025 (USD MILLION)
TABLE 46 SPAIN: MAGNESIA CHROME BRICK MARKET SIZE, BY END-USE INDUSTRY, 2020-2025 (USD MILLION)
TABLE 47 UK: MAGNESIA CHROME BRICK MARKET SIZE, BY END-USE INDUSTRY, 2020-2025 (USD MILLION)
TABLE 48 REST OF EUROPE: MAGNESIA CHROME BRICK MARKET SIZE, BY END-USE INDUSTRY, 2018-2025(USD MILLION
TABLE 49 NORTH AMERICA: MAGNESIA CHROME BRICK MARKET SIZE, BY COUNTRY, 2018-2025 (USD MILLION)
TABLE 50 NORTH AMERICA: MAGNESIA CHROME BRICK MARKET SIZE, BY COUNTRY, 2018-2025 (KILOTON
TABLE 51 NORTH AMERICA: MAGNESIA CHROME BRICK MARKET SIZE, BY TYPE, 2018-2025 (USD MILLION)
TABLE 52 NORTH AMERICA: MAGNESIA CHROME BRICK MARKET SIZE, BY TYPE, 2018-2025 (KILOTON
TABLE 53 NORTH AMERICA: MAGNESIA CHROME BRICK MARKET SIZE, BY END-USE INDUSTRY, 2018-2025 (USD MILLION)
TABLE 54 US: MAGNESIA CHROME BRICK MARKET SIZE, BY END-USE INDUSTRY, 2018-2025 (USD MILLION)
TABLE 55 CANADA: MAGNESIA CHROME BRICK MARKET SIZE, BY END-USE INDUSTRY, 2018-2025 (USD MILLION)
TABLE 56 MEXICO: MAGNESIA CHROME BRICK MARKET SIZE, BY END-USE INDUSTRY, 2018-2025 (USD MILLION)
TABLE 57 MIDDLE EAST & AFRICA: MAGNESIA CHROME BRICK MARKET SIZE, BY COUNTRY, 2018-2025 (USD MILLION)
TABLE 58 MIDDLE EAST & AFRICA: MAGNESIA CHROME BRICK MARKET SIZE, BY COUNTRY, 2018-2025 (KILOTON
TABLE 59 MIDDLE EAST & AFRICA: MAGNESIA CHROME BRICK MARKET SIZE, BY TYPE, 2018-2025 (USD MILLION)
TABLE 60 MIDDLE EAST & AFRICA: MAGNESIA CHROME BRICK MARKET SIZE, BY TYPE, 2018-2025 (KILOTON
TABLE 61 MIDDLE EAST & AFRICA: MAGNESIA CHROME BRICK MARKET SIZE, BY END-USE INDUSTRY, 2018-2025 (USD MILLION)
TABLE 62 SAUDI ARABIA: MAGNESIA CHROME BRICK MARKET SIZE, BY END-USE INDUSTRY, 2018-2025 (USD MILLION)
TABLE 63 UAE: MAGNESIA CHROME BRICK MARKET SIZE, BY END-USE INDUSTRY, 2018-2025 (USD MILLION)
TABLE 64 SOUTH AFRICA: MAGNESIA CHROME BRICK MARKET SIZE, BY END-USE INDUSTRY, 2018-2025 (USD MILLION)
TABLE 65 REST OF MIDDLE EAST & AFRICA: MAGNESIA CHROME BRICK MARKET SIZE, BY END-USE INDUSTRY, 2018-2025 (USD MILLION)
TABLE 66 SOUTH AMERICA: MAGNESIA CHROME BRICK MARKET SIZE, BY COUNTRY, 2018-2025 (USD MILLION)
TABLE 67 SOUTH AMERICA: MAGNESIA CHROME BRICK MARKET SIZE, BY COUNTRY, 2018-2025 (KILOTON
TABLE 68 SOUTH AMERICA: MAGNESIA CHROME BRICK MARKET SIZE, BY TYPE, 2018-2025 (USD MILLION)
TABLE 69 SOUTH AMERICA: MAGNESIA CHROME BRICK MARKET SIZE, BY TYPE, 2018-2025 (KILOTON
TABLE 70 SOUTH AMERICA: MAGNESIA CHROME BRICK MARKET SIZE, BY END-USE INDUSTRY, 2018-2025 (USD MILLION)
TABLE 71 BRAZIL: MAGNESIA CHROME BRICK MARKET SIZE, BY END-USE INDUSTRY, 2018-2025 (USD MILLION)
TABLE 72 ARGENTINA: MAGNESIA CHROME BRICK MARKET SIZE, BY END-USE INDUSTRY, 2018-2025 (USD MILLION)
TABLE 73 REST OF SOUTH AMERICA: MAGNESIA CHROME BRICK MARKET SIZE, BY END-USE INDUSTRY, 2018-2025 (USD MILLION)
TABLE 74 MERGERS & ACQUISITIONS, 2017-2020
TABLE 75 EXPANSIONS, 2017-2020
LIST OF FIGURES (31 Figures)
FIGURE 1 MAGNESIA CHROME BRICK MARKET: DATA TRIANGULATION
FIGURE 2 BY TYPE, DIRECT BONDED SEGMENT DOMINATED MAGNESIA CHROME BRICK MARKET IN 2019
FIGURE 3 BY END-USE INDUSTRY, IRON & STEEL SEGMENT DOMINATED MAGNESIA CHROME BRICK MARKET IN 2019
FIGURE 4 APAC DOMINATED MAGNESIA CHROME BRICK MARKET IN 2019
FIGURE 5 INCREASING USAGE OF MAGNESIA CHROME BRICK IN END-USE INDUSTRY APPLICATIONS TO DRIVE MARKET
FIGURE 6 ASIA PACIFIC TO BE LARGEST MARKET BETWEEN 2020 AND 2025
FIGURE 7 CHINA ACCOUNTED FOR LARGEST SHARE IN ASIA PACIFIC
FIGURE 8 INDIA TO BE FASTEST-GROWING MARKET BETWEEN 2020 AND 2025
FIGURE 1 DRIVERS, RESTRAINTS, OPPORTUNITIES, AND CHALLENGES IN THE MAGNESIA CHROME BRICK MARKET
FIGURE 2 PORTER'S FIVE FORCES ANALYSIS
FIGURE 9 BY TYPE, DIRECT BONDED TO LEAD MAGNESIA CHROME BRICK MARKET DURING FORECAST PERIOD
FIGURE 10 IRON & STEEL INDUSTRY PROJECTED TO DOMINATE THE MAGNESIA CHROME BRICK MARKET DURING THE FORECAST PERIOD
FIGURE 11 MAGNESIA CHROME BRICK MARKET IN APAC TO GROW AT THE HIGHEST RATE DURING THE FORECAST PERIOD
FIGURE 12 APAC: MAGNESIA CHROME BRICK MARKET SNAPSHOT
FIGURE 13 EUROPE: MAGNESIA CHROME BRICK MARKET SNAPSHOT
FIGURE 14 NORTH AMERICA: MAGNESIA CHROME BRICK MARKET SNAPSHOT
FIGURE 15 COMPANIES ADOPTED EXPANSIONS AS THE KEY GROWTH STRATEGY BETWEEN 2017 AND 2020
FIGURE 16 MARKET SHARE OF KEY PLAYERS IN THE MAGNESIA CHROME BRICK MARKET, 2019
FIGURE 17 RHI MAGNESITA: COMPANY SNAPSHOT
FIGURE 18 RHI MAGNESITA: SWOT ANALYSIS
FIGURE 19 VESUVIUS: COMPANY SNAPSHOT
FIGURE 20 VESUVIUS: SWOT ANALYSIS
FIGURE 21 SHINAGAWA REFRACTORIES: COMPANY SNAPSHOT
FIGURE 22 SHINAGAWA REFRACTORIES: SWOT ANALYSIS
FIGURE 23 HARBISONWALKER INTERNATIONAL: COMPANY SNAPSHOT
FIGURE 24 HARBISON WALKER INTERNATIONAL: SWOT ANALYSIS
FIGURE 25 CALDERYS: COMPANY SNAPSHOT
FIGURE 26 CALDERYS: SWOT ANALYSIS
FIGURE 27 CHOSUN REFRACTORIES: COMPANY SNAPSHOT
FIGURE 28 MAGNEZIT GROUP: COMPANY SNAPSHOT
FIGURE 29 RESCO PRODUCTS: COMPANY SNAPSHOT
FIGURE 30 RS KILN REFRACTORY COMPANY: COMPANY SNAPSHOT
FIGURE 31 KT REFRACTORIES: COMPANY SNAPSHOT
The study involved four major activities in estimating the size of the magnesia chrome brick market. Exhaustive secondary research was done to collect information on the market, peer market, and parent market. The next step was to validate these findings, assumptions, and sizing with industry experts across the value chain through primary research. Both top-down and bottom-up approaches were employed to estimate the total market size. After that, market breakdown and data triangulation were used to estimate the market size of segments and subsegments.
Secondary Research
In the secondary research process, various sources such as Hoovers, Bloomberg Businessweek, Factiva, World Bank, and Industry Journals were used. These secondary sources included annual reports, press releases & investor presentations of companies; white papers; certified publications; articles by recognized authors; and databases.
Primary Research
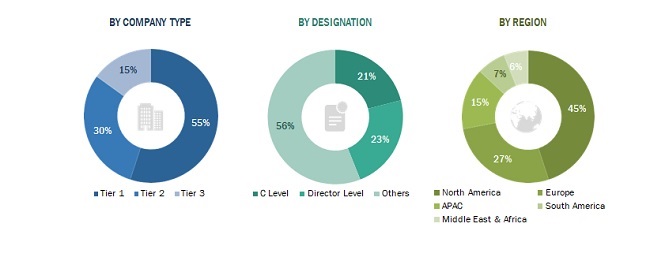
The magnesia chrome brick market comprises several stakeholders, such as raw material suppliers, end-product manufacturers, and regulatory organizations in the supply chain. Developments in the magnesia chrome brick market characterize the demand side. Market consolidation activities undertaken by manufacturers characterize the supply side. Various primary sources from both the supply and demand sides of the market were interviewed to obtain qualitative and quantitative information. Following is the breakdown of primary respondents:
To know about the assumptions considered for the study, download the pdf brochure
Market Size Estimation
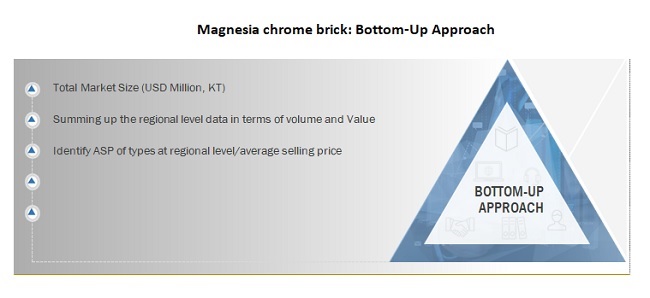
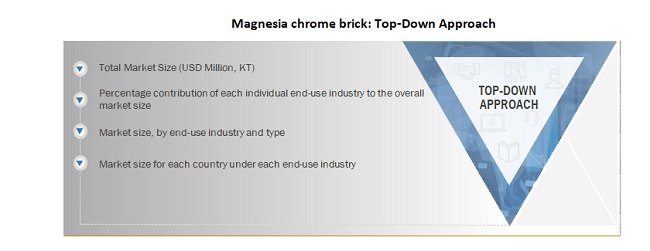
Both top-down and bottom-up approaches were used to estimate and validate the total size of the magnesia chrome brick market. These methods were also used extensively to determine the size of various subsegments in the market. The research methodology used to estimate the market size includes the following:
Magnesia chrome brick : Bottom-Up Approach
Magnesia chrome brick: Top-Down Approach
Data Triangulation
After arriving at the overall market size—using the market size estimation processes as explained above— the market was split into several segments and subsegments. To complete the overall market engineering process and arrive at the exact statistics of each market segment and subsegment, the data triangulation, and market breakdown procedures were employed, wherever applicable. The data was triangulated by studying various factors and trends from both the demand and supply sides in the magnesia chrome brick market.
Report Objectives
Note 1. Micromarkets are defined as subsegments of the magnesia chrome brick market included in the report.
Note 2 : Core competencies2 of the companies are determined in terms of product offerings and business strategies adopted by them to sustain in the market.
Available Customizations:
With the given market data, MarketsandMarkets offers customizations according to the specific needs of the companies.
The following customization options are available for the report:
Product Analysis
Regional Analysis
Company Information
-
- The key players in the industry and markets were identified through extensive secondary research.
- The industry’s supply chain and market size, in terms of value, were determined through primary and secondary research processes.
- All percentage shares, splits, and breakdowns were determined using secondary sources and verified through primary sources.
- To define, describe, and forecast the magnesia chrome brick market in terms of value and volume
- To provide detailed information about the key factors influencing the market growth, such as drivers, restraints, opportunities, and challenges
- To analyze and forecast the market size based on composition, chemistry, application, and technology
- To forecast the market size of five main regions, namely, North America, Europe, Asia Pacific (APAC), the Middle East & Africa, and South America (along with the key countries in each region)
- To strategically analyze the micromarkets1 with respect to individual growth trends, growth prospects, and contribution to the overall market
- To analyze the opportunities in the market for stakeholders and draw a competitive landscape for market leaders
- To analyze the competitive developments, such as expansion, mergers & acquisitions, new product developments, and agreement in the magnesia chrome brick market
- To strategically profile the key players and comprehensively analyze their core competencies2
-
Product matrix, which gives a detailed comparison of the product portfolio of each company
- Further breakdown of a region with respect to a particular country
- Detailed analysis and profiling of additional market players (up to five)


Growth opportunities and latent adjacency in Magnesia Chrome Brick Market