Tactical Communication Market Size, Share, Trends

Tactical Communication Market by Type (Soldier Radios, Manpacks, VIC, HCDR), Application (Command & Control, ISR, Communication, Combat), Platform, Frequency, Technology, Point of Sale, and Region -Global Forecast to 2027

Report Code: AS 4551 Aug, 2022, by marketsandmarkets.com

Update: 10/22/2024

Tactical Communication Market Size and Share

[236 Pages Report] The Tactical Communication Market Size is estimated to be USD 12.5 billion in 2022 and is projected to reach USD 16.0 billion by 2027, at a CAGR of 4.9% from 2022 to 2027. The Tactical Communication Industry Share is driven by factors such as transition of radio communication devices from analog to digital, customized communication on the move solutions for unmanned ground vehicles, etc.
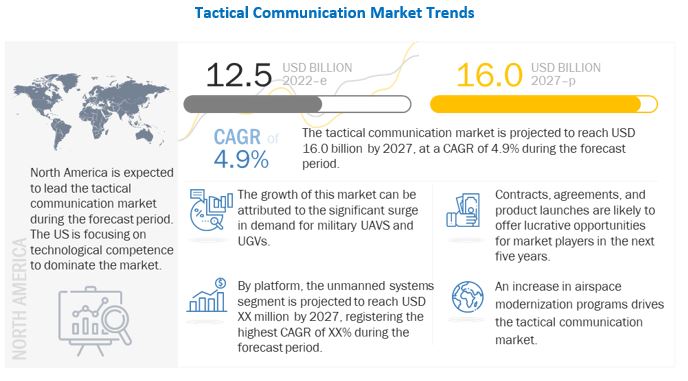
Tactical Communication Market

To know about the assumptions considered for the study, Request for Free Sample Report

The COVID-19 Outbreak has caused multiple challenges for defense industry. Though the industry was not severely affected but still has faced many economic downturns. The global manufacturing of tactical communication, components, and assembly lines have been impacted. The military budget allotted to the defense sector has been reduced by several countries due to the COVID-19 pandemic. This puts most research projects on hold. The export of tactical communication systems to several countries in the Middle East, Africa, and Latin America has also been reduced. All these scenarios affect the development of tactical communication.

Tactical Communication Market Dynamics

Drivers: Transition of radio communication devices from analog to digital

Due to advancements in software-defined platforms, land mobile radio products have transitioned from analog to digital. The rising demand for digitalized products and standards, including DMR, TETRA, and P25, owing to the various advantages over analog products, is expected to lead to the growth of the tactical communication market. Digital devices offer robust communication experiences and higher spectrum efficiency that facilitate machine-to-machine (M2M) and high-end IoT applications. Such digital systems can also support both, voice and data services such as M2M applications on highly reliable networks, providing coverage across a large service territory. The growing significance of digital radio systems, coupled with their advantages over analog systems, are expected to lead to market growth during the forecast period.

Restraints: Growing security concerns

The chances of a security breach are high when installing or loading new software in a tactical communication unit through an over-the-air update. There is high possibility of unauthorized and potentially malicious software being installed on the specified platform. The process is similar to the installation of software on laptops or personal computers wherein the prevention of any malicious functions is required.

Concerns related to unlicensed codes restrict market growth owing to the potential for compromising the security of the users’ assets along with threats to the communication capabilities of devices. Such security concerns are expected to lead to barriers to the growth in the sales of communication systems, including advanced tactical software-defined radios. Thus, security concerns act as a key restraining factor for the growth of the tactical communication market.

Opportunities: Demand for next-generation IP radio systems

Companies are focusing on increasing profitability by offering consumers a wide range of advanced IP radio systems due to the increasing demand across the globe. Sales of such products are also expected to provide new or enhanced services for the networking industry while at the same time, reducing transaction costs and further enhancing the end user experience. Next-generation frontline mobile communications also tend to shift away from high power single line contact methods towards mesh systems with low power, which enable higher numbers of operators to be linked together by means of multi-node mesh systems. Such systems have low susceptibility towards failures in single points and are also capable of self-healing, thereby enabling the communication packets to find the best transfer routes based on available system bandwidth and traffic levels. These next-generation IP radio systems are expected to provide opportunities for the usage of advanced tactical communication.

Challenges: High power consumption

Power consumption is considered to be one of the key challenges for the tactical communication industry. Tactical radios generally require high power for a specific function compared to other equipment designed specifically for analog or digital architectural partitioning. High power consumption is majorly challenging for small handheld radios and manpack radio units. The rapidly evolving field programmable gate arrays (FPGAs), digital signal processors (DSPs), and enhancements in parallel computation have helped increase the performance of communication systems.

Various technologies can be utilized in tactical communication radios including application-specific integrated circuits (ASICs), DSPs, general purpose processors (GPPs), and FPGAs. The GPP technology offers higher flexibility with low performance results in high power consumption, creating a challenge for market growth. However, the ASIC technology which delivers the least flexibility and high-performance can be used to minimize power consumption and maximize performance. Thus, reducing the high power consumption of various tactical radios is expected to be a challenge for the industry.

Tactical Communication Market Segments

Ground segment of the Tactical Communication Market by platform, to grow at highest market share during the forecast period

Based on platform, the ground segment is projected to grow from USD 5,131 million in 2022 to USD 6,601 million by 2027, at a CAGR of 5.2% during the forecast period. The growth can be attributed to the increasing demand of UGVs for both military application.

Soldier Radios segment to command the Tactical Communication Market Size by type, during the forecast period

Based on type, the Soldier Radios segment is projected to grow from USD 4,178 million in 2022 to USD 5,412 million by 2027, at a CAGR of 5.3% during the forecast period. The growth can be attributed to the higher adoption of technologically advanced Tactical Communication products owing to the ease of operation and maintenance.

Upgradation segment to dominate the Tactical Communication Market by point of sale, during the forecast period

Based on point of sale, the upgradation segment is projected to grow from USD 7,161 million in 2022 to USD 9,212 million by 2027, at a CAGR of 5.2% during the forecast period.

Tactical Communication Market Regions

The North America market is projected to contribute the largest market share from 2022 to 2027
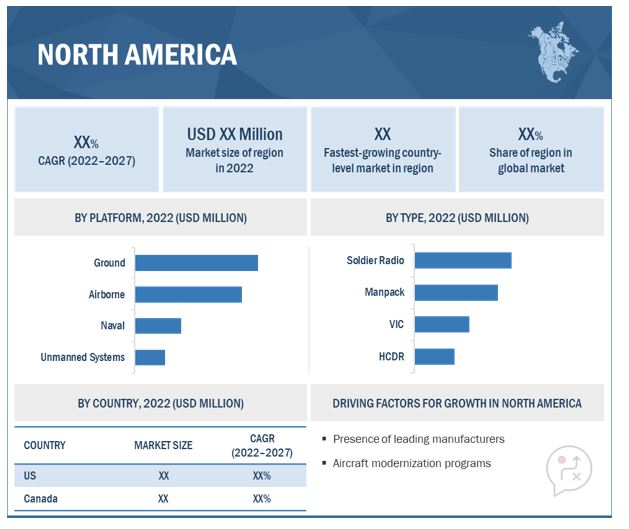
Tactical Communication Market by Region

To know about the assumptions considered for the study, download the pdf brochure

Emerging Industry Trends

GNU RADIO

GNU radio is one of the open-source software development frameworks or toolkits available for SDRs. It is one of the powerful frameworks for the streaming, development, and real-time signal processing of Software Defined Radio on general processors. This toolkit provides signal processing blocks for the implementation of software-defined radios. GNU radio can be used with readily available low-cost external RF hardware to create software-defined radios, or without hardware in a simulation-like environment. It is widely used in the research, academia, and government sectors.

Tactical Communication Companies: Top Key Market Players

The Tactical Communication Companies is dominated by globally established players such as:

  • Collins Aerospace (US)
  • L3harris Technologies (US)
  • Northrop Grumman Corporation (US)
  • Thales Group (France)
  • General Dynamics Corporation (US)

The report covers various industry trends and new technological innovations in the Tactical Communication Market for the period, 2018-2027.

Want to explore hidden markets that can drive new revenue in Tactical Communication Market?

Scope of the Report

Report Metric

Details

Estimated Market Size

USD 12.5 billion in 2022

Projected Market Size

USD 16.0 billion by 2027

Growth Rate

4.9%

Market size available for years

2018–2027

Base year considered

2021

Forecast period

2022-2027

Forecast units

Value (USD Million/Billion)

Segments covered

By Platform, By Application, By Type, By Frequency, By Technology, By Point of sale

Geographies covered

North America, Europe, Asia Pacific, Rest of the World.

Companies covered

L3harris Technologies (US), Honeywell International Inc (US), General Dynamics Corporation (US), Lockheed Martin Corporation (US), Northrop Grumman Corporation (US), Leonardo S.p.A. (Italy), BAE Systems (UK), among others. (23 Companies)

The study categorizes the Tactical communication Market based on platform, application, type, technology, and region

By Platform

  • Ground
    • Ground Control Stations/Command Centre
    • Armored vehicles
    • Soldiers
  • Airborne
    • Fixed
    • Rotary
  • Naval
    • Ships
    • Submarines
  • Unmanned Systems
    • Unmanned Ground Vehicles (UGVs)
    • Unmanned Aerial Vehicles (UAVs)
    • Underwater Vehicles

By Application

  • Command & Control
  • Intelligence, Surveillance & Reconnissance
  • Communication
  • Combat

By Type

  • Soldier Radios
  • Manpacks
  • Vehicular Intercommunication Radio (VIC)
  • High Capacity Data Radio (HCDR)

By Frequency

  • Single Frequency
  • Multi Frequency

By Technology

  • Time division multiplexing (TDM)
  • Next generation network (NGN)

By Point of Sale

  • New Installations
  • Upgradation

By Region

  • North America
  • Europe
  • Asia Pacific
  • Rest of the World

Recent Developments

  • In May 2022, Thales was one of two (2) vendors awarded an Indefinite Delivery, Indefinite Quantity (IDIQ) contract by the US Army to deliver advanced tactical radios under the US Army’s Combat Net Radio (CNR) modernization program. The competitive 10-year contract for the Combat Net Radio (CNR) program includes a five-year base ordering period and an additional five-year optional ordering period.
  • In May 2022, L3Harris Technologies received an IDIQ contract increase for its Falcon IV AN/PRC-167 radio systems from the US Special Operations Command (USSOCOM). USSOCOM increased the initial IDIQ ceiling from USD 255 million to USD 552 million.

Frequently Asked Questions (FAQ):

To speak to our analyst for a discussion on the above findings, click Speak to Analyst

Exclusive indicates content/data unique to MarketsandMarkets and not available with any competitors.

TABLE OF CONTENTS
 
1 INTRODUCTION (Page No. - 24)
    1.1 STUDY OBJECTIVES
    1.2 MARKET DEFINITION
    1.3 STUDY SCOPE
           1.3.1 MARKET SEGMENTATION
           1.3.2 REGIONAL SCOPE
           1.3.3 YEARS CONSIDERED
    1.4 INCLUSIONS AND EXCLUSIONS
           TABLE 1 INCLUSIONS AND EXCLUSIONS IN TACTICAL COMMUNICATIONS MARKET
    1.5 CURRENCY CONSIDERED
    1.6 STUDY LIMITATIONS
    1.7 MARKET STAKEHOLDERS
    1.8 SUMMARY OF CHANGES
 
2 RESEARCH METHODOLOGY (Page No. - 30)
    2.1 RESEARCH DATA
           FIGURE 1 REPORT PROCESS FLOW
           FIGURE 2 RESEARCH DESIGN
           2.1.1 SECONDARY DATA
           2.1.2 PRIMARY DATA
                    2.1.2.1 Key data from primary sources
                    2.1.2.2 Key primary sources
                               FIGURE 3 BREAKDOWN OF PRIMARY INTERVIEWS: BY COMPANY TYPE, DESIGNATION, AND REGION
           2.1.3 DEMAND-SIDE ANALYSIS
           2.1.4 SUPPLY-SIDE ANALYSIS
    2.2 MARKET SIZE ESTIMATION
           TABLE 2 SEGMENTS AND SUB-SEGMENTS
    2.3 RESEARCH APPROACH & METHODOLOGY
           2.3.1 BOTTOM-UP APPROACH
                    TABLE 3 TACTICAL COMMUNICATIONS MARKET ESTIMATION PROCEDURE
                    FIGURE 4 MARKET SIZE ESTIMATION METHODOLOGY: BOTTOM-UP APPROACH
           2.3.2 TOP-DOWN APPROACH
                    FIGURE 5 MARKET SIZE ESTIMATION METHODOLOGY: TOP-DOWN APPROACH
    2.4 DATA TRIANGULATION
           FIGURE 6 DATA TRIANGULATION
           2.4.1 TRIANGULATION THROUGH PRIMARY AND SECONDARY RESEARCH
    2.5 GROWTH RATE ASSUMPTIONS
    2.6 RESEARCH ASSUMPTIONS
    2.7 RISKS
 
3 EXECUTIVE SUMMARY (Page No. - 40)
    FIGURE 7 GROUND PLATFORM SEGMENT TO GROW AT HIGHEST CAGR
    FIGURE 8 SOLDIER RADIO SEGMENT TO LEAD MARKET
    FIGURE 9 UPGRADE POINT OF SALE SEGMENT TO GROW AT HIGHER CAGR
    FIGURE 10 SINGLE FREQUENCY SEGMENT TO LEAD MARKET
    FIGURE 11 COMMUNICATION APPLICATION SEGMENT TO GROW AT HIGHEST CAGR
    FIGURE 12 NORTH AMERICA TO ACCOUNT FOR LARGEST SHARE IN 2022
 
4 PREMIUM INSIGHTS (Page No. - 44)
    4.1 ATTRACTIVE GROWTH OPPORTUNITIES
           FIGURE 13 SURGE IN ADOPTION OF UNMANNED SYSTEMS
    4.2 MARKET, BY PLATFORM
           FIGURE 14 GROUND SEGMENT TO LEAD MARKET
    4.3 MARKET, BY APPLICATION
           FIGURE 15 COMMAND & CONTROL SEGMENT TO LEAD MARKET
    4.4 MARKET, BY TYPE
           FIGURE 16 SOLDIER RADIO SEGMENT TO LEAD MARKET
    4.5 MARKET, BY FREQUENCY
           FIGURE 17 SINGLE FREQUENCY SEGMENT TO LEAD MARKET
    4.6 MARKET, BY POINT OF SALE
           FIGURE 18 UPGRADE SEGMENT TO LEAD MARKET
    4.7 MARKET, BY COUNTRY
           FIGURE 19 US TO BE FASTEST-GROWING COUNTRY-LEVEL MARKET
 
5 MARKET OVERVIEW (Page No. - 48)
    5.1 INTRODUCTION
    5.2 MARKET DYNAMICS
           FIGURE 20 MARKET: DRIVERS, RESTRAINTS, OPPORTUNITIES, AND CHALLENGES
           5.2.1 DRIVERS
                    5.2.1.1 Rising military spending
                               TABLE 4 MILITARY EXPENDITURE OF MAJOR COUNTRIES, 2020 (USD BILLION)
                    5.2.1.2 Demand for mission-critical communication
                    5.2.1.3 Transition of radio communication devices from analog to digital
                    5.2.1.4 Customized communication-on-the-move solutions for unmanned ground vehicles
           5.2.2 RESTRAINTS
                    5.2.2.1 Rigorous military standards and stringent regulations
                    5.2.2.2 Growing security concerns
           5.2.3 OPPORTUNITIES
                    5.2.3.1 Demand for next-generation IP radio systems
                    5.2.3.2 Opportunities in derived technologies such as cognitive radios
                    5.2.3.3 Rise in adoption of unmanned vehicles
                               TABLE 5 UAVS MARKET, BY REGION, 2016 VS. 2021 (USD MILLION)
                    5.2.3.4 Growing demand for enhanced interoperability
           5.2.4 CHALLENGES
                    5.2.4.1 Interoperability between disparate communication technologies
                    5.2.4.2 High power consumption
    5.3 VALUE CHAIN ANALYSIS
           FIGURE 21 VALUE CHAIN ANALYSIS
    5.4 TRENDS/DISRUPTIONS IMPACTING CUSTOMER BUSINESSES
           5.4.1 REVENUE SHIFT AND NEW REVENUE POCKETS FOR MANUFACTURERS
                    FIGURE 22 REVENUE SHIFT FOR TACTICAL COMMUNICATIONS MARKET PLAYERS
    5.5 ECOSYSTEM
           5.5.1 PROMINENT COMPANIES
           5.5.2 PRIVATE AND SMALL ENTERPRISES
           5.5.3 MARKET ECOSYSTEM
                    FIGURE 23 TACTICAL COMMUNICATIONS MARKET: ECOSYSTEM
                    TABLE 6 TACTICAL COMMUNICATIONS MARKET: ECOSYSTEM
    5.6 PATENT ANALYSIS
    5.7 INNOVATIONS AND PATENT REGISTRATIONS
           TABLE 7 INNOVATIONS & PATENT REGISTRATIONS, 2013–2017
    5.8 AVERAGE SELLING PRICE OF TACTICAL COMMUNICATION PRODUCTS
           5.8.1 AVERAGE SELLING PRICE TRENDS OF TACTICAL COMMUNICATION RADIO SYSTEMS, 2020 (USD MILLION)
    5.9 PRICING ANALYSIS
           5.9.1 AVERAGE SELLING PRICE OF TACTICAL COMMUNICATION, BY SYSTEM
                    FIGURE 24 AVERAGE SELLING PRICES OF TACTICAL COMMUNICATION SYSTEMS
    5.10 PORTER’S FIVE FORCES ANALYSIS
           FIGURE 25 PORTER’S FIVE FORCES ANALYSIS OF TACTICAL COMMUNICATIONS MARKET
           TABLE 8 TACTICAL COMMUNICATIONS MARKET: PORTER’S FIVE FORCE ANALYSIS
           5.10.1 THREAT OF NEW ENTRANTS
           5.10.2 THREAT OF SUBSTITUTES
           5.10.3 BARGAINING POWER OF SUPPLIERS
           5.10.4 BARGAINING POWER OF BUYERS
           5.10.5 INTENSITY OF COMPETITIVE RIVALRY
    5.11 TRADE DATA ANALYSIS
           5.11.1 EXPORT DATA
                     TABLE 9 COUNTRY-WISE EXPORT VALUE OF RADAR APPARATUS, RADIO NAVIGATIONAL AID APPARATUS, AND RADIO REMOTE CONTROL APPARATUS, 2018–2019 (USD THOUSAND)
           5.11.2 IMPORT DATA
                     TABLE 10 COUNTRY-WISE IMPORT DATA, 2018–2019 (USD THOUSAND)
           5.11.3 KEY CONFERENCES AND EVENTS, 2022–2023
                     TABLE 11 TACTICAL COMMUNICATIONS MARKET: LIST OF CONFERENCES AND EVENTS
    5.12 TARIFF AND REGULATORY LANDSCAPE
           5.12.1 REGULATORY BODIES, GOVERNMENT AGENCIES, AND OTHER ORGANIZATIONS
                     TABLE 12 NORTH AMERICA: LIST OF REGULATORY BODIES, GOVERNMENT AGENCIES, AND OTHER ORGANIZATIONS
                     TABLE 13 EUROPE: LIST OF REGULATORY BODIES, GOVERNMENT AGENCIES, AND OTHER ORGANIZATIONS
                     TABLE 14 ASIA PACIFIC: LIST OF REGULATORY BODIES, GOVERNMENT AGENCIES, AND OTHER ORGANIZATIONS
                     TABLE 15 MIDDLE EAST: LIST OF REGULATORY BODIES, GOVERNMENT AGENCIES, AND OTHER ORGANIZATIONS
           5.12.2 REGULATORY LANDSCAPE
                    5.12.2.1 North America
                    5.12.2.2 Europe
    5.13 KEY STAKEHOLDERS AND BUYING CRITERIA
           5.13.1 KEY STAKEHOLDERS IN BUYING PROCESS
                     FIGURE 26 INFLUENCE OF STAKEHOLDERS IN BUYING PROCESS OF TACTICAL COMMUNICATION ACROSS APPLICATIONS
                     TABLE 16 INFLUENCE OF STAKEHOLDERS IN BUYING PROCESS OF TACTICAL COMMUNICATION ACROSS APPLICATIONS (%)
           5.13.2 BUYING CRITERIA
                     FIGURE 27 KEY BUYING CRITERIA FOR TACTICAL COMMUNICATION, BY APPLICATION
                     TABLE 17 KEY BUYING CRITERIA FOR TACTICAL COMMUNICATION, BY APPLICATION
 
6 INDUSTRY TRENDS (Page No. - 70)
    6.1 INTRODUCTION
    6.2 TECHNOLOGY TRENDS
           6.2.1 DEVELOPMENT OF COGNITIVE RADIO
           6.2.2 USE OF SOFTWARE-DEFINED RADIO
           6.2.3 DEVELOPMENT OF NEXT-GENERATION IP
           6.2.4 MANNED-UNMANNED TEAMING (MUMT)
           6.2.5 GNU RADIO
    6.3 TECHNOLOGY ANALYSIS
           6.3.1 MULTIBAND TACTICAL COMMUNICATION AMPLIFIERS
           6.3.2 ULTRA-COMPACT & HIGH THROUGHPUT ON-THE-MOVE (OTM) TERMINALS FOR TACTICAL UAVS
    6.4 MILITARY STANDARDS
           6.4.1 MIL STD 6011
           6.4.2 MIL STD 6016
           6.4.3 MIL STD 6017
           6.4.4 MIL STD 6020E
           6.4.5 MIL STD 3011
    6.5 USE CASE ANALYSIS
           6.5.1 DARPA BLACKJACK PROGRAM TARGETS TO EXPERIMENT ITS SOFTWARE-DEFINED RADIO BY LINKING IT WITH LEO ORBIT AND TACTICAL RADIOS
           6.5.2 RF AND MICROWAVE COMPONENTS TO ENABLE SOFTWARE-DEFINED RADIOS TO OPERATE IN CONTESTED ENVIRONMENTS
    6.6 IMPACT OF MEGATRENDS
           6.6.1 DISRUPTIVE TECHNOLOGIES IN SUPPLY CHAIN MANAGEMENT
           6.6.2 SHIFTING GLOBAL ECONOMIC POWERS
           6.6.3 TECHNOLOGICAL ADVANCEMENTS
 
7 TACTICAL COMMUNICATIONS MARKET, BY APPLICATION (Page No. - 75)
    7.1 INTRODUCTION
           FIGURE 28 COMMAND & CONTROL APPLICATION TO LEAD MARKET DURING FORECAST PERIOD
           TABLE 18 TACTICAL COMMUNICATIONS MARKET, BY APPLICATION, 2018–2021 (USD MILLION)
           TABLE 19 TACTICAL COMMUNICATIONS MARKET, BY APPLICATION, 2022–2027 (USD MILLION)
    7.2 COMMAND & CONTROL
    7.3 INTELLIGENCE, SURVEILLANCE & RECONNAISSANCE (ISR)
    7.4 COMMUNICATION
    7.5 COMBAT
 
8 TACTICAL COMMUNICATIONS MARKET, BY PLATFORM (Page No. - 79)
    8.1 INTRODUCTION
           FIGURE 29 GROUND PLATFORM TO REGISTER HIGHEST CAGR DURING FORECAST PERIOD
           TABLE 20 TACTICAL COMMUNICATIONS MARKET, BY PLATFORM, 2018–2021 (USD MILLION)
           TABLE 21 TACTICAL COMMUNICATIONS MARKET, BY PLATFORM, 2022–2027 (USD MILLION)
    8.2 GROUND
           8.2.1 GROUND CONTROL STATIONS/COMMAND CENTERS
           8.2.2 ARMORED VEHICLES
                    8.2.2.1 Combat vehicles
                    8.2.2.2 Combat support vehicles
           8.2.3 SOLDIERS
    8.3 AIRBORNE
           8.3.1 FIXED WING
                    8.3.1.1 Fighter aircraft
                    8.3.1.2 Transport aircraft
                    8.3.1.3 Special mission aircraft
           8.3.2 ROTARY WING
                    8.3.2.1 Attack helicopters
                    8.3.2.2 Maritime helicopters
                    8.3.2.3 Multi role helicopters
    8.4 NAVAL
           8.4.1 SHIPS
                    8.4.1.1 Destroyers
                    8.4.1.2 Frigates
                    8.4.1.3 Corvettes
                    8.4.1.4 Amphibious vessels
                    8.4.1.5 Survey vessels
                    8.4.1.6 Patrol & mine countermeasure vessels
                    8.4.1.7 Offshore support vessels (OSVs)
                    8.4.1.8 Other supporting vessels
           8.4.2 SUBMARINES
    8.5 UNMANNED SYSTEMS
           8.5.1 UNMANNED AERIAL VEHICLES (UAVS)
           8.5.2 UNMANNED GROUND VEHICLES (UGVS)
           8.5.3 UNMANNED UNDERWATER VEHICLES (UUVS)
 
9 TACTICAL COMMUNICATION MARKET, BY TYPE (Page No. - 89)
    9.1 INTRODUCTION
           FIGURE 30 MANPACK SEGMENT TO GROW AT HIGHEST CAGR DURING FORECAST PERIOD
           TABLE 22 MARKET, BY TYPE, 2018–2021 (USD MILLION)
           TABLE 23 MARKET, BY TYPE, 2022–2027 (USD MILLION)
    9.2 SOLDIER RADIO
    9.3 MANPACK
    9.4 VEHICULAR INTERCOMMUNICATION RADIO (VIC)
    9.5 HIGH-CAPACITY DATA RADIO (HCDR)
 
10 TACTICAL COMMUNICATION MARKET, BY TECHNOLOGY (Page No. - 93)
     10.1 INTRODUCTION
     10.2 TIME-DIVISION MULTIPLEXING (TDM)
     10.3 NEXT-GENERATION NETWORK (NGN)
 
11 TACTICAL COMMUNICATION MARKET, BY FREQUENCY (Page No. - 96)
     11.1 INTRODUCTION
             TABLE 24 DIFFERENT TYPES OF FREQUENCY BANDS
             FIGURE 31 MULTI FREQUENCY SEGMENT TO REGISTER HIGHER CAGR DURING FORECAST PERIOD
             TABLE 25 MARKET, BY FREQUENCY, 2018–2021 (USD MILLION)
             TABLE 26 MARKET, BY FREQUENCY, 2022–2027 (USD MILLION)
     11.2 SINGLE FREQUENCY
             11.2.1 HIGH FREQUENCY (HF) BAND
             11.2.2 VERY HIGH FREQUENCY (VHF) BAND
             11.2.3 ULTRA HIGH FREQUENCY (UHF) BAND
             11.2.4 L BAND
             11.2.5 S BAND
             11.2.6 C BAND
             11.2.7 X BAND
             11.2.8 K BAND
     11.3 MULTI FREQUENCY
 
12 TACTICAL COMMUNICATION MARKET, BY POINT OF SALE (Page No. - 101)
     12.1 INTRODUCTION
             FIGURE 32 UPGRADE SEGMENT TO GROW AT HIGHER CAGR DURING FORECAST PERIOD
             TABLE 27 MARKET, BY POINT OF SALE, 2018–2021 (USD MILLION)
             TABLE 28 MARKET, BY POINT OF SALE, 2022–2027 (USD MILLION)
             12.1.1 NEW INSTALLATIONS
                        12.1.1.1 Increasing advancement of military communication systems and procurement of military vehicles
             12.1.2 UPGRADE
                        12.1.2.1 Upgrade of existing fleet of military vehicles
 
13 TACTICAL COMMUNICATION MARKET, BY REGION (Page No. - 104)
     13.1 INTRODUCTION
           FIGURE 33 NORTH AMERICA TO ACCOUNT FOR LARGEST MARKET SHARE
           TABLE 29 MARKET, BY REGION, 2018–2021 (USD MILLION)
           TABLE 30 MARKET, BY REGION, 2022–2027 (USD MILLION)
           TABLE 31 MARKET, BY PLATFORM, 2018–2021 (USD MILLION)
           TABLE 32 MARKET, BY PLATFORM, 2022–2027 (USD MILLION)
           TABLE 33 MARKET, BY APPLICATION, 2018–2021 (USD MILLION)
           TABLE 34 MARKET, BY APPLICATION, 2022–2027 (USD MILLION)
           TABLE 35 MARKET, BY FREQUENCY, 2018–2021 (USD MILLION)
           TABLE 36 MARKET, BY FREQUENCY, 2022–2027 (USD MILLION)
           TABLE 37 MARKET, BY TYPE, 2018–2021 (USD MILLION)
           TABLE 38 MARKET, BY TYPE, 2022–2027 (USD MILLION)
           TABLE 39 MARKET, BY POINT OF SALE, 2018–2021 (USD MILLION)
           TABLE 40 MARKET, BY POINT OF SALE, 2022–2027 (USD MILLION)
     13.2 NORTH AMERICA
             13.2.1 PESTLE ANALYSIS: NORTH AMERICA
                        FIGURE 34 NORTH AMERICA: SNAPSHOT
                        TABLE 41 NORTH AMERICA: BY PLATFORM, 2018–2021 (USD MILLION)
                        TABLE 42 NORTH AMERICA: BY PLATFORM, 2022–2027 (USD MILLION)
                        TABLE 43 NORTH AMERICA: BY FREQUENCY, 2018–2021 (USD MILLION)
                        TABLE 44 NORTH AMERICA: BY FREQUENCY, 2022–2027 (USD MILLION)
                        TABLE 45 NORTH AMERICA: BY TYPE, 2018–2021 (USD MILLION)
                        TABLE 46 NORTH AMERICA: BY TYPE, 2022–2027 (USD MILLION)
                        TABLE 47 NORTH AMERICA: BY POINT OF SALE, 2018–2021 (USD MILLION)
                        TABLE 48 NORTH AMERICA: BY POINT OF SALE, 2022–2027 (USD MILLION)
                        TABLE 49 NORTH AMERICA: BY COUNTRY, 2018–2021 (USD MILLION)
                        TABLE 50 NORTH AMERICA: BY COUNTRY, 2022–2027 (USD MILLION)
             13.2.2 US
                        13.2.2.1 Increased spending by US defense organizations and private players
                                     TABLE 51 US: BY PLATFORM, 2018–2021 (USD MILLION)
                                     TABLE 52 US: BY PLATFORM, 2022–2027 (USD MILLION)
                                     TABLE 53 US: BY TYPE, 2018–2021 (USD MILLION)
                                     TABLE 54 US: BY TYPE, 2022–2027 (USD MILLION)
             13.2.3 CANADA
                        13.2.3.1 Increasing military procurements and growing demand for UAVs
                                     TABLE 55 CANADA: BY PLATFORM, 2018–2021 (USD MILLION)
                                     TABLE 56 CANADA: BY PLATFORM, 2022–2027 (USD MILLION)
                                     TABLE 57 CANADA: BY TYPE, 2018–2021 (USD MILLION)
                                     TABLE 58 CANADA: BY TYPE, 2022–2027 (USD MILLION)
     13.3 EUROPE
             13.3.1 PESTLE ANALYSIS: EUROPE
                        FIGURE 35 EUROPE: SNAPSHOT
                        TABLE 59 EUROPE: BY PLATFORM, 2018–2021 (USD MILLION)
                        TABLE 60 EUROPE: BY PLATFORM, 2022–2027 (USD MILLION)
                        TABLE 61 EUROPE: BY FREQUENCY, 2018–2021 (USD MILLION)
                        TABLE 62 EUROPE: BY FREQUENCY, 2022–2027 (USD MILLION)
                        TABLE 63 EUROPE: BY TYPE, 2018–2021 (USD MILLION)
                        TABLE 64 EUROPE: BY TYPE, 2022–2027 (USD MILLION)
                        TABLE 65 EUROPE: BY POINT OF SALE, 2018–2021 (USD MILLION)
                        TABLE 66 EUROPE: BY POINT OF SALE, 2022–2027 (USD MILLION)
                        TABLE 67 EUROPE: BY COUNTRY, 2018–2021 (USD MILLION)
                        TABLE 68 EUROPE: BY COUNTRY, 2022–2027 (USD MILLION)
             13.3.2 UK
                        13.3.2.1 Government initiatives supporting development of communication systems
                                     TABLE 69 UK: BY PLATFORM, 2018–2021 (USD MILLION)
                                     TABLE 70 UK: BY PLATFORM, 2022–2027 (USD MILLION)
                                     TABLE 71 UK: BY TYPE, 2018–2021 (USD MILLION)
                                     TABLE 72 UK: BY TYPE, 2022–2027 (USD MILLION)
             13.3.3 ITALY
                        13.3.3.1 Increasing development of secure communication systems
                                     TABLE 73 ITALY: BY PLATFORM, 2018–2021 (USD MILLION)
                                     TABLE 74 ITALY: BY PLATFORM, 2022–2027 (USD MILLION)
                                     TABLE 75 ITALY: BY TYPE, 2018–2021 (USD MILLION)
                                     TABLE 76 ITALY: BY TYPE, 2022–2027 (USD MILLION)
             13.3.4 GERMANY
                        13.3.4.1 Continuous focus on upgrading battle management and communications systems
                                     TABLE 77 GERMANY: BY PLATFORM, 2018–2021 (USD MILLION)
                                     TABLE 78 GERMANY: BY PLATFORM, 2022–2027 (USD MILLION)
                                     TABLE 79 GERMANY: BY TYPE, 2018–2021 (USD MILLION)
                                     TABLE 80 GERMANY: BY TYPE, 2022–2027 (USD MILLION)
             13.3.5 FRANCE
                        13.3.5.1 Presence of aircraft manufacturers and competition between various airlines
                                     TABLE 81 FRANCE: BY PLATFORM, 2018–2021 (USD MILLION)
                                     TABLE 82 FRANCE: BY PLATFORM, 2022–2027 (USD MILLION)
                                     TABLE 83 FRANCE: BY TYPE, 2018–2021 (USD MILLION)
                                     TABLE 84 FRANCE: BY TYPE, 2022–2027 (USD MILLION)
             13.3.6 POLAND
                        13.3.6.1 Deployment and modernization of armed forces
                                     TABLE 85 POLAND: BY PLATFORM, 2018–2021 (USD MILLION)
                                     TABLE 86 POLAND: BY PLATFORM, 2022–2027 (USD MILLION)
                                     TABLE 87 POLAND: BY TYPE, 2018–2021 (USD MILLION)
                                     TABLE 88 POLAND: BY TYPE, 2022–2027 (USD MILLION)
             13.3.7 REST OF EUROPE
                        TABLE 89 REST OF EUROPE: BY PLATFORM, 2018–2021 (USD MILLION)
                        TABLE 90 REST OF EUROPE: BY PLATFORM, 2022–2027 (USD MILLION)
                        TABLE 91 REST OF EUROPE: BY TYPE, 2018–2021 (USD MILLION)
                        TABLE 92 REST OF EUROPE: BY TYPE, 2022–2027 (USD MILLION)
     13.4 ASIA PACIFIC
             13.4.1 PESTLE ANALYSIS: ASIA PACIFIC
                        FIGURE 36 ASIA PACIFIC: SNAPSHOT
                        TABLE 93 ASIA PACIFIC: MARKET, BY PLATFORM, 2018–2021 (USD MILLION)
                        TABLE 94 ASIA PACIFIC: MARKET, BY PLATFORM, 2022–2027 (USD MILLION)
                        TABLE 95 ASIA PACIFIC: MARKET, BY FREQUENCY, 2018–2021 (USD MILLION)
                        TABLE 96 ASIA PACIFIC: MARKET, BY FREQUENCY, 2022–2027 (USD MILLION)
                        TABLE 97 ASIA PACIFIC: MARKET, BY TYPE, 2018–2021 (USD MILLION)
                        TABLE 98 ASIA PACIFIC: MARKET, BY TYPE, 2022–2027 (USD MILLION)
                        TABLE 99 ASIA PACIFIC: MARKET, BY POINT OF SALE, 2018–2021 (USD MILLION)
                        TABLE 100 ASIA PACIFIC: MARKET, BY POINT OF SALE, 2022–2027 (USD MILLION)
                        TABLE 101 ASIA PACIFIC: MARKET, BY COUNTRY, 2018–2021 (USD MILLION)
                        TABLE 102 ASIA PACIFIC: MARKET, BY COUNTRY, 2022–2027 (USD MILLION)
             13.4.2 CHINA
                        13.4.2.1 Instability across borders and neighboring countries
                                     TABLE 103 CHINA: MARKET, BY PLATFORM, 2018–2021 (USD MILLION)
                                     TABLE 104 CHINA: MARKET, BY PLATFORM, 2022–2027 (USD MILLION)
                                     TABLE 105 CHINA: MARKET, BY TYPE, 2018–2021 (USD MILLION)
                                     TABLE 106 CHINA: MARKET, BY TYPE, 2022–2027 (USD MILLION)
             13.4.3 INDIA
                        13.4.3.1 Military modernization, self-reliance campaign, and infrastructural revolution
                                     TABLE 107 INDIA: BY PLATFORM, 2018–2021 (USD MILLION)
                                     TABLE 108 INDIA: BY PLATFORM, 2022–2027 (USD MILLION)
                                     TABLE 109 INDIA: BY TYPE, 2018–2021 (USD MILLION)
                                     TABLE 110 INDIA: BY TYPE, 2022–2027 (USD MILLION)
             13.4.4 SINGAPORE
                        13.4.4.1 Focus on strengthening military capabilities
                                     TABLE 111 SINGAPORE: BY PLATFORM, 2018–2021 (USD MILLION)
                                     TABLE 112 SINGAPORE: BY PLATFORM, 2022–2027 (USD MILLION)
                                     TABLE 113 SINGAPORE: BY TYPE, 2018–2021 (USD MILLION)
                                     TABLE 114 SINGAPORE: BY TYPE, 2022–2027 (USD MILLION)
             13.4.5 SOUTH KOREA
                        13.4.5.1 Acquisition of surveillance and missile defense systems
                                     TABLE 115 SOUTH KOREA: BY PLATFORM, 2018–2021 (USD MILLION)
                                     TABLE 116 SOUTH KOREA: BY PLATFORM, 2022–2027 (USD MILLION)
                                     TABLE 117 SOUTH KOREA: BY TYPE, 2018–2021 (USD MILLION)
                                     TABLE 118 SOUTH KOREA: BY TYPE, 2022–2027 (USD MILLION)
             13.4.6 JAPAN
                        13.4.6.1 Enhancement of defense and surveillance capabilities
                                     TABLE 119 JAPAN: MARKET, BY PLATFORM, 2018–2021 (USD MILLION)
                                     TABLE 120 JAPAN: MARKET, BY PLATFORM, 2022–2027 (USD MILLION)
                                     TABLE 121 JAPAN: MARKET, BY TYPE, 2018–2021 (USD MILLION)
                                     TABLE 122 JAPAN: MARKET, BY TYPE, 2022–2027 (USD MILLION)
             13.4.7 AUSTRALIA
                        13.4.7.1 Rising incidences of violence resulting in upgrades
                                     TABLE 123 AUSTRALIA: MARKET, BY PLATFORM, 2018–2021 (USD MILLION)
                                     TABLE 124 AUSTRALIA: MARKET, BY PLATFORM, 2022–2027 (USD MILLION)
                                     TABLE 125 AUSTRALIA: MARKET, BY TYPE, 2018–2021 (USD MILLION)
                                     TABLE 126 AUSTRALIA: MARKET, BY TYPE, 2022–2027 (USD MILLION)
             13.4.8 REST OF ASIA PACIFIC
                        TABLE 127 REST OF ASIA PACIFIC: MARKET, BY PLATFORM, 2018–2021 (USD MILLION)
                        TABLE 128 REST OF ASIA PACIFIC: MARKET, BY PLATFORM, 2022–2027 (USD MILLION)
                        TABLE 129 REST OF ASIA PACIFIC: MARKET, BY TYPE, 2018–2021 (USD MILLION)
                        TABLE 130 REST OF ASIA PACIFIC: MARKET, BY TYPE, 2022–2027 (USD MILLION)
     13.5 REST OF THE WORLD
             13.5.1 PESTLE ANALYSIS: REST OF THE WORLD
                        TABLE 131 REST OF THE WORLD: TACTICAL COMMUNICATION MARKET, BY PLATFORM, 2018–2021 (USD MILLION)
                        TABLE 132 REST OF THE WORLD: TACTICAL COMMUNICATION MARKET, BY PLATFORM, 2022–2027 (USD MILLION)
                        TABLE 133 REST OF THE WORLD: TACTICAL COMMUNICATION MARKET, BY FREQUENCY, 2018–2021 (USD MILLION)
                        TABLE 134 REST OF THE WORLD: TACTICAL COMMUNICATION MARKET, BY FREQUENCY, 2022–2027 (USD MILLION)
                        TABLE 135 REST OF THE WORLD: TACTICAL COMMUNICATION MARKET, BY TYPE, 2018–2021 (USD MILLION)
                        TABLE 136 REST OF THE WORLD: TACTICAL COMMUNICATION MARKET, BY TYPE, 2022–2027 (USD MILLION)
                        TABLE 137 REST OF THE WORLD: TACTICAL COMMUNICATION MARKET, BY POINT OF SALE, 2018–2021 (USD MILLION)
                        TABLE 138 REST OF THE WORLD: TACTICAL COMMUNICATION MARKET, BY POINT OF SALE, 2022–2027 (USD MILLION)
                        TABLE 139 REST OF THE WORLD: TACTICAL COMMUNICATION MARKET, BY REGION, 2018–2021 (USD MILLION)
                        TABLE 140 REST OF THE WORLD: TACTICAL COMMUNICATION MARKET, BY REGION, 2022–2027 (USD MILLION)
             13.5.2 MIDDLE EAST
                        13.5.2.1 Technological advancements in tactical communication
                                     TABLE 141 MIDDLE EAST: TACTICAL COMMUNICATION MARKET, BY PLATFORM, 2018–2021 (USD MILLION)
                                     TABLE 142 MIDDLE EAST: TACTICAL COMMUNICATION MARKET, BY PLATFORM, 2022–2027 (USD MILLION)
                                     TABLE 143 MIDDLE EAST: TACTICAL COMMUNICATION MARKET, BY TYPE, 2018–2021 (USD MILLION)
                                     TABLE 144 MIDDLE EAST: TACTICAL COMMUNICATION MARKET, BY TYPE, 2022–2027 (USD MILLION)
             13.5.3 LATIN AMERICA & AFRICA
                        13.5.3.1 Increased demand for military UAVs
                                     TABLE 145 LATIN AMERICA & AFRICA: TACTICAL COMMUNICATION MARKET, BY PLATFORM, 2018–2021 (USD MILLION)
                                     TABLE 146 LATIN AMERICA & AFRICA: TACTICAL COMMUNICATION MARKET, BY PLATFORM, 2022–2027 (USD MILLION)
                                     TABLE 147 LATIN AMERICA & AFRICA: TACTICAL COMMUNICATION MARKET, BY TYPE, 2018–2021 (USD MILLION)
                                     TABLE 148 LATIN AMERICA & AFRICA: TACTICAL COMMUNICATION MARKET, BY TYPE, 2022–2027 (USD MILLION)
 
14 COMPETITIVE LANDSCAPE (Page No. - 153)
     14.1 INTRODUCTION 
     14.2 MARKET SHARE ANALYSIS, 2021 
             TABLE 149 DEGREE OF COMPETITION
             FIGURE 37 SHARE OF TOP PLAYERS IN TACTICAL COMMUNICATION MARKET, 2021(%)
     14.3 REVENUE ANALYSIS, 2021 
             FIGURE 38 REVENUE ANALYSIS OF TOP 5 MARKET PLAYERS, 2021
     14.4 MARKET RANKING ANALYSIS, 2021 
             FIGURE 39 RANKING ANALYSIS OF 5 PLAYERS: TACTICAL COMMUNICATION MARKET, 2021
     14.5 COMPANY PRODUCT FOOTPRINT ANALYSIS 
             TABLE 150 COMPANY PRODUCT FOOTPRINT
             TABLE 151 COMPANY PLATFORM FOOTPRINT
             TABLE 152 COMPANY REGION FOOTPRINT
     14.6 COMPANY EVALUATION QUADRANT 
             14.6.1 STARS
             14.6.2 EMERGING LEADERS
             14.6.3 PERVASIVE PLAYERS
             14.6.4 PARTICIPANTS
                        FIGURE 40 COMPETITIVE LEADERSHIP MAPPING, 2021
     14.7 START-UP EVALUATION QUADRANT 
             14.7.1 PROGRESSIVE COMPANIES
             14.7.2 RESPONSIVE COMPANIES
             14.7.3 STARTING BLOCKS
             14.7.4 DYNAMIC COMPANIES
                        FIGURE 41 COMPETITIVE LEADERSHIP MAPPING OF START-UPS, 2021
             14.7.5 COMPETITIVE BENCHMARKING
                        TABLE 153 TACTICAL COMMUNICATION MARKET: DETAILED LIST OF KEY START-UPS/SMES
                        TABLE 154 TACTICAL COMMUNICATION MARKET: COMPETITIVE BENCHMARKING OF KEY START-UPS/SMES
     14.8 COMPETITIVE SCENARIO AND TRENDS 
             14.8.1 PRODUCT LAUNCHES
                        TABLE 155 TACTICAL COMMUNICATION MARKET: PRODUCT LAUNCHES, JANUARY 2019–MARCH 2022
             14.8.2 DEALS
                        TABLE 156 TACTICAL COMMUNICATION MARKET: DEALS, MARCH 2019–APRIL 2021
             14.8.3 OTHER DEALS/DEVELOPMENTS
                        TABLE 157 TACTICAL COMMUNICATION MARKET: OTHER DEALS/DEVELOPMENTS, JANUARY 2019–MARCH 2022
 
15 COMPANY PROFILES (Page No. - 171)
     15.1 KEY PLAYERS 
(Business Overview, Products/Solutions/Services offered, Recent Developments, MnM View)*  
             15.1.1 BAE SYSTEMS
                        TABLE 158 BAE SYSTEMS: COMPANY OVERVIEW
                        FIGURE 42 BAE SYSTEMS: COMPANY SNAPSHOT
                        TABLE 159 BAE SYSTEMS: PRODUCTS/SOLUTIONS/SERVICES OFFERED
                        TABLE 160 BAE SYSTEMS: DEALS
             15.1.2 GENERAL DYNAMICS CORPORATION
                        TABLE 161 GENERAL DYNAMICS CORPORATION: COMPANY OVERVIEW
                        FIGURE 43 GENERAL DYNAMICS CORPORATION: COMPANY SNAPSHOT
                        TABLE 162 GENERAL DYNAMICS CORPORATION: PRODUCTS/SOLUTIONS/SERVICES OFFERED
                        TABLE 163 GENERAL DYNAMICS CORPORATION: DEALS
             15.1.3 COLLINS AEROSPACE
                        TABLE 164 COLLINS AEROSPACE: COMPANY OVERVIEW
                        TABLE 165 COLLINS AEROSPACE: PRODUCTS/SOLUTIONS/SERVICES OFFERED
                        TABLE 166 COLLINS AEROSPACE.: DEALS
                        TABLE 167 COLLINS AEROSPACE: NEW PRODUCT DEVELOPMENTS
                        TABLE 168 COLLINS AEROSPACE.: OTHERS
             15.1.4 HONEYWELL INTERNATIONAL INC.
                        TABLE 169 HONEYWELL INTERNATIONAL INC.: COMPANY OVERVIEW
                        FIGURE 44 HONEYWELL INTERNATIONAL INC.: COMPANY SNAPSHOT
                        TABLE 170 HONEYWELL INTERNATIONAL INC.: PRODUCTS/SOLUTIONS/SERVICES OFFERED
                        TABLE 171 HONEYWELL INTERNATIONAL INC.: NEW PRODUCT DEVELOPMENTS
             15.1.5 NORTHROP GRUMMAN CORPORATION
                        TABLE 172 NORTHROP GRUMMAN CORPORATION: COMPANY OVERVIEW
                        FIGURE 45 NORTHROP GRUMMAN CORPORATION: COMPANY SNAPSHOT
                        TABLE 173 NORTHROP GRUMMAN CORPORATION: PRODUCTS/SOLUTIONS/SERVICES OFFERED?
                        TABLE 174 NORTHROP GRUMMAN CORPORATION: DEALS
             15.1.6 L3HARRIS TECHNOLOGIES, INC.
                        TABLE 175 L3HARRIS TECHNOLOGIES, INC.: COMPANY OVERVIEW
                        FIGURE 46 L3HARRIS TECHNOLOGIES, INC.: COMPANY SNAPSHOT
                        TABLE 176 L3HARRIS TECHNOLOGIES, INC.: PRODUCTS/SERVICES/SOLUTIONS OFFERED?
                        TABLE 177 L3HARRIS TECHNOLOGIES, INC.: DEALS
             15.1.7 VIASAT INC.
                        TABLE 178 VIASAT INC.: COMPANY OVERVIEW
                        FIGURE 47 VIASAT INC.: COMPANY SNAPSHOT
                        TABLE 179 VIASAT INC.: PRODUCTS/SERVICES/SOLUTIONS OFFERED
                        TABLE 180 VIASAT INC.: DEALS
             15.1.8 THALES GROUP
                        TABLE 181 THALES GROUP: COMPANY OVERVIEW
                        FIGURE 48 THALES GROUP: COMPANY SNAPSHOT
                        TABLE 182 THALES GROUP: PRODUCTS/SOLUTIONS/SERVICES OFFERED?
                        TABLE 183 THALES GROUP: DEALS
             15.1.9 LOCKHEED MARTIN CORPORATION
                        TABLE 184 LOCKHEED MARTIN CORPORATION: COMPANY OVERVIEW
                        FIGURE 49 LOCKHEED MARTIN CORPORATION: COMPANY SNAPSHOT
             15.1.10 LEONARDO S.P.A.
                        TABLE 185 LEONARDO S.P.A.: COMPANY OVERVIEW
                        FIGURE 50 LEONARDO S.P.A.: COMPANY SNAPSHOT
                        TABLE 186 LEONARDO S.P.A.: PRODUCTS/SOLUTIONS/SERVICES OFFERED
                        TABLE 187 LEONARDO S.P.A.: DEALS
             15.1.11 ELBIT SYSTEMS LTD.
                        TABLE 188 ELBIT SYSTEMS LTD.: BUSINESS OVERVIEW
                        FIGURE 51 ELBIT SYSTEMS LTD.: COMPANY SNAPSHOT
                        TABLE 189 ELBIT SYSTEMS LTD.: PRODUCTS/SOLUTIONS/SERVICES OFFERED
                        TABLE 190 ELBIT SYSTEMS LTD.: DEALS
             15.1.12 SAAB AB
                        TABLE 191 SAAB AB: COMPANY OVERVIEW
                        FIGURE 52 SAAB AB: COMPANY SNAPSHOT
                        TABLE 192 SAAB AB: PRODUCTS/SOLUTIONS/SERVICES OFFERED
             15.1.13 CURTISS-WRIGHT CORPORATION
                        TABLE 193 CURTISS-WRIGHT CORPORATION: COMPANY OVERVIEW
                        FIGURE 53 CURTISS-WRIGHT CORPORATION: COMPANY SNAPSHOT
                        TABLE 194 CURTISS-WRIGHT CORPORATION: PRODUCTS/SOLUTIONS/SERVICES OFFERED
                        TABLE 195 CURTISS-WRIGHT CORPORATION: DEALS
     15.2 OTHER PLAYERS 
             15.2.1 ASELSAN A.S.
                        TABLE 196 ASELSAN A.S.: COMPANY OVERVIEW
                        FIGURE 54 ASELSAN A.S.: COMPANY SNAPSHOT
                        TABLE 197 ASELSAN A.S.: PRODUCTS/SOLUTIONS/SERVICES OFFERED
             15.2.2 BHARAT ELECTRONICS LTD.
                        TABLE 198 BHARAT ELECTRONICS LTD.: COMPANY OVERVIEW
                        FIGURE 55 BHARAT ELECTRONICS LTD.: COMPANY SNAPSHOT
                        TABLE 199 BHARAT ELECTRONICS LTD.: PRODUCTS/SOLUTIONS/SERVICES OFFERED
                        TABLE 200 BHARAT ELECTRONICS LTD.: NEW PRODUCT DEVELOPMENTS
                        TABLE 201 BHARAT ELECTRONICS LTD.: DEALS
             15.2.3 COBHAM ADVANCED ELECTRONIC SOLUTIONS INC.
                        TABLE 202 COBHAM ADVANCED ELECTRONIC SOLUTIONS INC.: COMPANY OVERVIEW
                        TABLE 203 COBHAM ADVANCED ELECTRONIC SOLUTIONS INC.: PRODUCTS/SOLUTIONS/ SERVICES OFFERED
                        TABLE 204 COBHAM ADVANCED ELECTRONIC SOLUTIONS INC.: DEALS
             15.2.4 RHODE & SCHWARZ
                        TABLE 205 RHODE & SCHWARZ: COMPANY OVERVIEW
                        TABLE 206 RHODE & SCHWARZ: PRODUCTS/SOLUTIONS/SERVICES OFFERED
                        TABLE 207 RHODE & SCHWARZ: NEW PRODUCT DEVELOPMENTS
                        TABLE 208 RHODE & SCHWARZ: DEALS
             15.2.5 DATA LINK SOLUTIONS
                        TABLE 209 DATA LINK SOLUTIONS: COMPANY OVERVIEW
                        TABLE 210 DATA LINK SOLUTIONS: PRODUCTS/SOLUTIONS/SERVICES OFFERED
                        TABLE 211 DATA LINK SOLUTIONS: DEALS
             15.2.6 KONGSBERG
                        TABLE 212 KONGSBERG: COMPANY OVERVIEW
                        FIGURE 56 KONGSBERG: COMPANY SNAPSHOT
                        TABLE 213 KONGSBERG: PRODUCTS/SOLUTIONS/SERVICES OFFERED
             15.2.7 ULTRA ELECTRONICS
                        TABLE 214 ULTRA ELECTRONICS: COMPANY OVERVIEW
                        FIGURE 57 ULTRA ELECTRONICS: COMPANY SNAPSHOT
                        TABLE 215 ULTRA ELECTRONICS: PRODUCTS/SOLUTIONS/SERVICES OFFERED?
                        TABLE 216 ULTRA ELECTRONICS: DEALS
             15.2.8 ROLTA INDIA LIMITED
                        TABLE 217 ROLTA INDIA LIMITED: COMPANY OVERVIEW
                        TABLE 218 ROLTA INDIA LIMITED: PRODUCTS/SOLUTIONS/SERVICES OFFERED?
             15.2.9 RAFAEL ADVANCED DEFENSE SYSTEMS LTD.
                        TABLE 219 RAFAEL ADVANCED DEFENSE SYSTEMS LTD.: COMPANY OVERVIEW
                        TABLE 220 RAFAEL ADVANCED DEFENSE SYSTEMS LTD.: PRODUCTS/SOLUTIONS/ SERVICES OFFERED?
                        TABLE 221 RAFAEL ADVANCED DEFENSE SYSTEMS LTD.: DEALS
             15.2.10 BARRETT COMMUNICATIONS
                        TABLE 222 BARRETT COMMUNICATIONS: COMPANY OVERVIEW
                        TABLE 223 BARRETT COMMUNICATIONS: PRODUCTS/SOLUTIONS/SERVICES OFFERED?
                        TABLE 224 BARRETT COMMUNICATIONS: DEALS
*Details on Business Overview, Products/Solutions/Services offered, Recent Developments, MnM View might not be captured in case of unlisted companies.  
 
16 APPENDIX (Page No. - 230)
     16.1 DISCUSSION GUIDE 
     16.2 KNOWLEDGESTORE: MARKETSANDMARKETS’ SUBSCRIPTION PORTAL 
     16.3 CUSTOMIZATION OPTIONS 
     16.4 RELATED REPORTS 
     16.5 AUTHOR DETAILS 
 

The study involved four major activities in estimating the current size of the tactical communication market. Exhaustive secondary research was done to collect information on the market, peer market, and parent market. The next step was to validate these findings, assumptions, and sizing with industry experts across the value chain through primary research. Both top-down and bottom-up approaches were employed to estimate the complete market size. After that, market breakdown and data triangulation were used to estimate the market size of segments and subsegments.

Secondary Research

The market share of companies offering tactical communication systems was arrived at based on the secondary data available through paid and unpaid sources and analyzing the product portfolios of major companies and rating them based on their performance and quality. In the secondary research process, sources such as government databases; SIPRI, corporate filings such as annual reports, press releases, and investor presentations of companies; white papers, journals, and certified publications; articles by recognized authors; and directories and databases were used to identify and collect information for this study.

Secondary research was mainly used to obtain key information about the industry’s value and supply chain. Secondary research was also used to identify the key players through the various products offered, market classifications, and segmentation. Secondary information helped in understanding the different industry trends related to tactical communication components, platforms, frequencies, data link types, and regions, as well as key developments from both, market and technology-oriented perspectives.

Primary Research

In the primary research process, various sources from the supply and demand sides were interviewed to obtain qualitative and quantitative information on the market. Primary sources from the supply side included industry experts such as vice presidents (VPs); directors from business development, marketing, and product development/innovation teams; related key executives from marine vessel manufacturers; aircraft manufacturers; tactical communication manufacturers; integrators; and key opinion leaders.
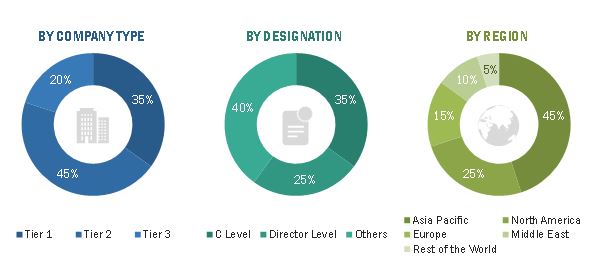
Tactical Communication Market Size, and Share

To know about the assumptions considered for the study, download the pdf brochure

Market Size Estimation

The top-down and bottom-up approaches were used to estimate and validate the size of the tactical communication market. The research methodology used to estimate the size of the market included the following details.

Key players in the tactical communication market were identified through secondary research and their market share was determined through primary and secondary research. This included the study of the annual and financial reports of the top market players and extensive interviews with leaders such as directors, engineers, marketing executives, and other stakeholders of leading companies operating in the tactical communication market.

All percentage shares, splits, and breakdowns were determined using secondary sources and verified through primary sources. All possible parameters that affect the markets covered in this research study were accounted for, viewed in extensive detail, verified through primary research, and analyzed to obtain the final quantitative and qualitative data on the tactical communication market. This data was consolidated, enhanced with detailed inputs, analyzed by MarketsandMarkets, and presented in this report.

Tactical communication Market Size: Bottom-Up Approach
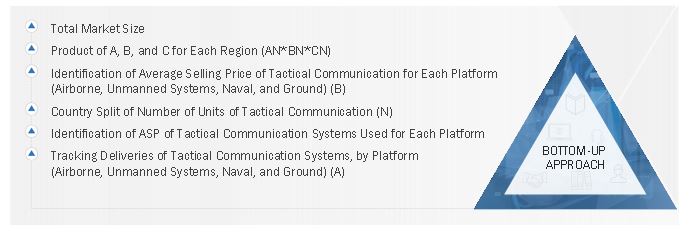
Tactical Communication Market Size, and Bottom-Up Approach

Data Triangulation

After arriving at the overall market size, the total market was split into several segments and subsegments. The data triangulation and market breakdown procedures explained below were implemented, wherever applicable, to complete the overall market engineering process and arrive at the estimated market numbers for tactical communication segments and subsegments. The data was triangulated by studying various factors and trends from both, the demand and supply sides. Along with this, the market size was validated using the top-down and bottom-up approaches.

The following figure indicates the market breakdown structure and the data triangulation procedure implemented in the market engineering process used to develop this report.

Report Objectives

  • To define, describe, segment, and forecast the size of the tactical communication market based on platform, application, type, frequency, technology, point of sale, and region for the forecast period from 2022 to 2027
  • To forecast the size of various segments of the tactical communication market with respect to 6 major regions namely, North America, Europe, Asia Pacific, Rest of the World which consists of the Middle East and Latin America & Africa
  • To identify and analyze key drivers, restraints, opportunities, and challenges influencing the growth of the tactical communication market
  • To identify the opportunities for stakeholders in the market by identifying key market and technology trends
  • To analyze competitive developments such as contracts, agreements, acquisitions & partnerships, new product launches & developments, and Research & Development (R&D) activities in the tactical communication market.
  • To anticipate the status of the tactical communication market procurements by different countries, technological advancements in tactical data links; and joint developments undertaken by leading players to analyze the degree of competition in the market
  • To provide a comprehensive competitive landscape of the tactical communication market, along with an overview of the different strategies adopted by the key market players to strengthen their position in the market

Available Customizations

MarketsandMarkets offers the following customizations for this market report:

  • Market sizing and forecast for additional countries
  • By platform, by type breakdown at country level
  • Additional five companies profiling

Product Analysis

  • Product matrix, which provides a detailed comparison of the product portfolio of each company in the tactical communication market
Custom Market Research Services

We will customize the research for you, in case the report listed above does not meet with your exact requirements. Our custom research will comprehensively cover the business information you require to help you arrive at strategic and profitable business decisions.

Request Customization

Instant Answers with GPT - Ask Now!

Ask real questions. Get complete answers !
Report Code
AS 4551
Published ON
Aug, 2022
Choose License Type
BUY NOW
  • SHARE
X
Request Customization
Speak to Analyst
Speak to Analyst
OR FACE-TO-FACE MEETING
PERSONALIZE THIS RESEARCH
  • Triangulate with your Own Data
  • Get Data as per your Format and Definition
  • Gain a Deeper Dive on a Specific Application, Geography, Customer or Competitor
  • Any level of Personalization
REQUEST A FREE CUSTOMIZATION
LET US HELP YOU!
  • What are the Known and Unknown Adjacencies Impacting the Tactical Communication Market
  • What will your New Revenue Sources be?
  • Who will be your Top Customer; what will make them switch?
  • Defend your Market Share or Win Competitors
  • Get a Scorecard for Target Partners
CUSTOMIZED WORKSHOP REQUEST
knowledgestore logo

Want to explore hidden markets that can drive new revenue in Tactical Communication Market?

Find Hidden Markets
  • Call Us
  • +1-888-600-6441 (Corporate office hours)
  • +1-888-600-6441 (US/Can toll free)
  • +44-800-368-9399 (UK office hours)
CONNECT WITH US
ABOUT TRUST ONLINE
©2024 MarketsandMarkets Research Private Ltd. All rights reserved
DMCA.com Protection Status
Website Feedback