Solar Encapsulation Market by Material (EVA, PVB, PDMS, Ionomer, TPU, Polyolefin), Technology (Crystalline Silicon, Thin-film Solar), Application (Ground-mounted, Building-integrated Photovoltaic, Floating Photovoltaic) & Region - Global Forecast to 2028
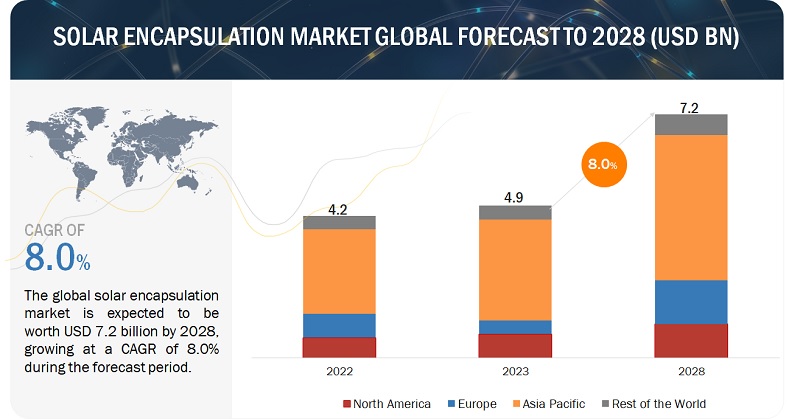
[192 Pages Report] The global solar encapsulation market is estimated to grow from USD 4.9 billion in 2023 to USD 7.2 billion by 2028; it is expected to record a CAGR of 8.0% during the forecast period. Government regulations that encourage research and development and applications such as thin film solar are critical to the growth of the solar encapsulation market. Furthermore, due to the widespread commercialization of solar technology in the region, Japan and South Korea are the leading country-level markets in the Asia Pacific.
To know about the assumptions considered for the study, Request for Free Sample Report
To know about the assumptions considered for the study, download the pdf brochure
Solar Encapsulation Market Dynamics
Driver: Favorable government incentives and schemes supporting solar installations
Various strategies and initiatives are being implemented by governments around the world to encourage the usage of inverters in industrial applications. The UK government has set a net-zero electricity grid objective for 2035, and it intends to phase out the use of fossil fuels in energy generation. To attain this goal, the country has implemented beneficial policies. The market for distributed PV in Europe has been pushed by government incentives to promote residential and small business PV installations in several countries. To encourage the use of solar PV panels for residential applications, the UK government cut the tax on solar PV panels and other renewable energy-producing items in January 2022. The value-added tax on the installation of home solar PV panel systems has been decreased by 5%. Also, solar energy is being vigorously promoted by countries such as China, Canada, the US, and France.
Restraint: Recycling complexity of solar encapsulations
Solar PV recycling is relatively complex from a technical standpoint. The EoL solar PV module flow is not homogeneous in size, technology, composition or condition. Moreover, existing solar PV panels were not designed to be recycled: durability and performance requirements have led to sandwich-like, sealed and encapsulated structures, making the separation of constituent materials difficult. Solar encapsulation materials, such as Ethylene-vinyl acetate (EVA) or Polyvinyl Butyral (PVB), are often difficult to separate from other components in a solar panel during recycling. These materials are designed to be durable and resistant to environmental factors, making their separation and recovery more challenging. Over time, encapsulation materials can degrade due to prolonged exposure to sunlight and environmental factors. This degradation can make separation even more challenging, and contaminated materials might not meet the required quality standards for reuse. Hence, the lack of established recycling infrastructure and cost-effective recycling processes for these materials limits their reusability, impacting the sustainability of solar panel production which hampers the growth of the solar encapsulation market.
Opportunities: Economic encapsulation techniques
With the continuous cost reduction in solar modules, it is becoming important to incorporate less expensive encapsulation technologies. The cost pressure in the industry may support panel manufacturers to make a switch toward more economical encapsulation strategies. The PV industry is trying to acquire some new encapsulation technologies which have a performance edge as well as cost saving quality. This indicates that there is a genuine opportunity for encapsulant suppliers and manufacturers to derive some improved encapsulant that serves both the above stated requirements and starts a new trend. Although susceptible to UV degradation, EVA remains the most cost-effective encapsulant with good optical properties and adhesion. Consider replacing the front sheet with a cheaper material like fluoropolymer or PET while maintaining EVA at the back for structural stability.
Challenges: Potential Problems with ethylene-vinyl acetate photovoltaic encapsulation
EVA is the most commonly used encapsulating material due to its great mechanical features, such as good light transmittance and flexibility, excellent melt fluidity, adhesive properties, and inexpensive cost. The rising solar energy penetration worldwide, drives market demand for EVA. There are certain disadvantages to using EVA copolymers for encapsulation. When exposed to ambient water or UV radiation, EVA copolymers begin degrading and slowly produce acetic acid, resulting in a decreased pH level and enhanced surface corrosion. Despite this, it creates acetic acid at a relatively slow rate; this decomposition may quickly lead to component deterioration, offering a substantial obstacle to the usage of EVA copolymers in encapsulation.
Solar Encapsulation Market Ecosystem
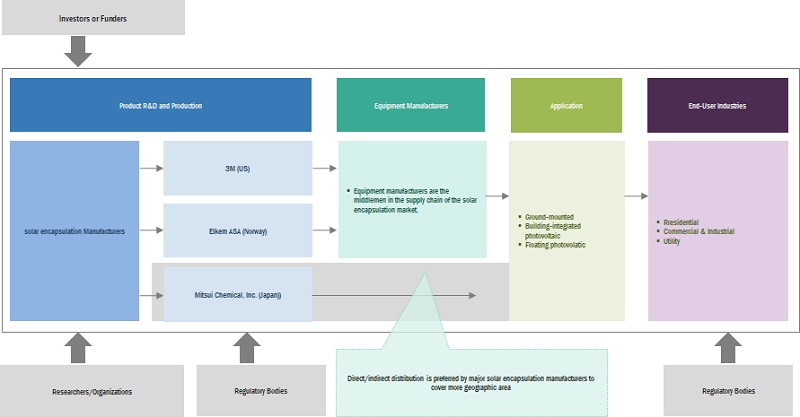
Well-established, financially reliable Solar encapsulation manufacturers are prominent players in this market. These companies have been in the market for a number of years and have a diverse product range, cutting-edge technologies, and powerful global sales and marketing networks. Mitsui Chemicals, Inc. (Japan), Elkem ASA (Norway), Dow (US), 3M (US), and DuPont (US) are among the industry leaders in this market
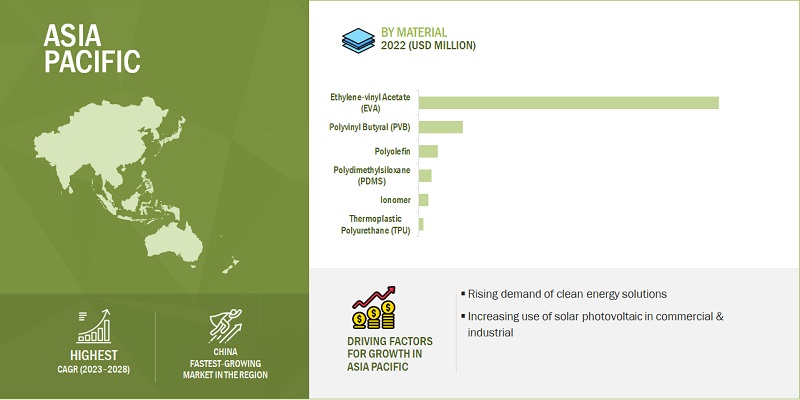
The ethylene-vinyl acetate, by materials, is expected to be the largest segment during the forecast period.
This report segments the solar encapsulant market based on type into six types: Ethylene-vinyl Acetate (EVA), Polyvinyl Butyral (PVB), Polydimethylsiloxane (PDMS), Ionomer, Polyolefin, Thermoplastic Polyurethane (TPU). The ethylene-vinyl acetate segment is expected to be the largest segment during the forecast period. EVA copolymers are largely used in food and medical packaging applications due to their non-toxic nature. EVA packaging films exhibit excellent mechanical properties, such as low shrink temperature, greater adhesion, enhanced flexibility, good impact strength, improved puncture resistance, and excellent flex crack resistance. EVA is used in solar modules as an encapsulating agent to provide good radiation transmission and low degradability to sunlight. Also, it is used to form sealing and insulating film around the solar cells.
By technology, crystalline silicon is expected to be the fastest growing during the forecast period.
Based on technology, the solar encapsulation market is segmented into technology into crystalline silicon and thin-film solar technology. The crystalline silicon technology segment is further sub-segmented into mono-crystalline and polycrystalline silicon solar technology. The thin-film solar technology segment is sub-segmented into Cadmium telluride (CdTe), Copper-Indium-gallanium-selenide (CIGS) and Amorphous Silicon. The crystalline silicon technology will exhibit the highest CAGR during forecast period. Monocrystalline cells, also known as single-crystalline cells, are made from single-crystalline silicon. They have a unique appearance as they are often colored and cylindrical. Monocrystalline cells tend to have a higher efficiency level and require less space than other types of solar cells.
"Asia Pacific": The largest in the Solar encapsulation market.
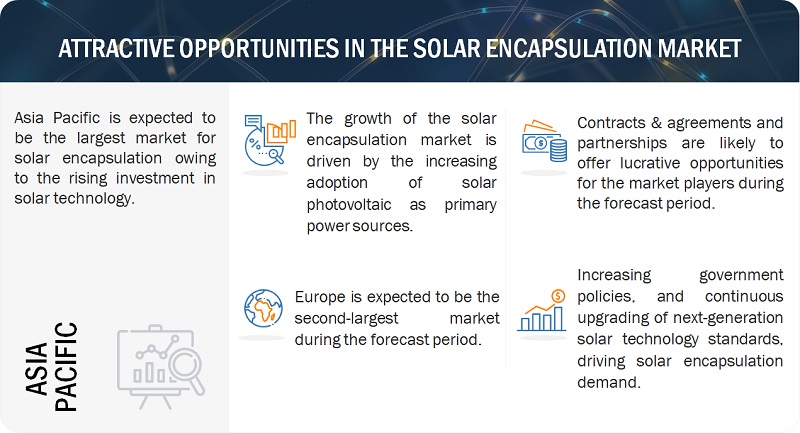
Asia Pacific is expected to have the largest market share in the Solar encapsulation market during the forecast period, followed by Europe. PV module demand is increasing in nations such as China, Japan, India, and South Korea, according to worldwide market participants. India and China are driving the expansion of the PV market in Asia Pacific. These two countries are making rapid growth in the global PV market. Favorable government policies are also aiding the expansion of the Asia Pacific PV industry. According to the International and Renewable Energy Agency (IRENA), rising urbanization and industrialization are boosting energy consumption, providing opportunities for the region's governments to increase their renewable energy potential.
Key Market Players
The solar encapsulation market is dominated by a few major players that have a wide regional presence. The major players in the Solar encapsulation market include Mitsui Chemicals, Inc. (Japan), Elkem ASA (Norway), Dow (US), 3M (US), and DuPont (US) Between 2018 and 2023. These companies followed strategies such as contracts, agreements, partnerships, mergers, acquisitions, and expansions to capture a larger share of the Solar encapsulation market.
Scope of the report
|
Report Metric |
Details |
|
Market size available for years |
2019–2028 |
|
Base year considered |
2022 |
|
Forecast period |
2023–2028 |
|
Forecast units |
Value (USD Million/Billion), Volume (Metric tons) |
|
Segments Covered |
Solar encapsulation Market by Materials, Technology, Application, and Region. |
|
Geographies covered |
Asia Pacific, North America, Europe, and Rest of the World |
|
Companies covered |
First Solar (US), H.B. Fuller Company (US), Dow (US), DuPont (US), Mitsui Chemicals, Inc. (Japan), 3M (US), Exxon Mobil Corporation (US), Avantor, Inc. (US), HANGZHOU FIRST APPLIED MATERIAL CO., LTD. (China), LG Chem (South Korea), RenewSys India Pvt. Ltd. (India), JA SOLAR Technology Co.,Ltd. (China), dnpSolar (Japan), Isovoltaic AG (Austria), Vishakha Renewables Pvt. Ltd. (India), NOVOPOLYMERS (Belgium), Shin-Etsu Chemical Co., Ltd. (Japan), Betterial (South Korea) |
This research report categorizes the solar encapsulation market based on materials, technology, application, and region.
On the basis of materials:
- Ethylene Vinyl Acetate (EVA)
- Thermoplastic Polyurethane (TPU)
- Polyvinyl Butyral (PVB)
- Polydimethylsiloxane (PDMS)
- Ionomer
- Polyolefin
On the basis of technology:
- Crystalline Silicon Solar
- Thin-Film Solar
On the basis of application:
- Ground-mounted
- Building-integrated photovoltaic
- Floating photovoltaic
- Others (Automotive, Construction, and Electronics)
Based on region:
- Europe
- Asia Pacific
- North America
- Rest of the World
Recent Developments
- In February 2021, RenewSys India Pvt. Ltd. launched CONSERV Giga Fast Cure, a revolutionary EVA Encapsulant that can reduce the ‘curing’ stage of module manufacturing by 2-3 minutes per module.
- In January 2021, H.B. Fuller Company announced that the company had completed the acquisition of the U.S.-based Solar Encapsulant business of STR Holdings, Inc.
- In June 2019, Mitsui Chemicals, Inc. inaugurated a new plant to produce its high-performance polyolefin elastomer at its Singapore-based wholly owned subsidiary Mitsui Elastomers. This move will better serve new markets, such as solar module encapsulation film.
- In June 2019, DuPont announced that the company had added a new brand DuPont Fortasun Solar Silicones. The new silicone-based product line features sealants, adhesives, potting agents, encapsulants and electrically conductive adhesives.
Frequently Asked Questions (FAQ):
What is the current size of the Solar encapsulation market?
The current market size of the Solar encapsulation market is USD 4.9 billion in 2023.
What are the major drivers for the Solar encapsulation market?
Increasing stringent government regulations on greenhouse gas emissions and rising demand for solar PV modules will be major drivers for the Solar encapsulation market.
Which is the largest region during the forecasted period in the Solar encapsulation market?
Asia Pacific is expected to dominate the Solar encapsulation market between 2023–2028, followed by Europe and North America. The increase in demand for ethylene vinyl acetate in recent years is driving the region's market.
Which is the largest segment, by technology, during the forecasted period in the Solar encapsulation market?
The crystalline silicon segment is expected to be the largest market during the forecast period. The growth of crystalline silicon is attributed to the low cost and simpler manufacturing process of the technology.
Which is the fastest growing application segment during the forecasted period in the Solar encapsulation market?
The gound-mounted segment is expected to be the fastest market during the forecast period. The favorable government policies and subsidies are helping to grow the solar encapsulation segment. .
To speak to our analyst for a discussion on the above findings, click Speak to Analyst


- 5.1 INTRODUCTION
-
5.2 MARKET DYNAMICSDRIVERS- Rising adoption of solar PVs owing to growing electricity demand- Favorable government incentives and schemes supporting solar PV installations- Low operational costs of solar PV systemsRESTRAINTS- High raw material prices and supply chain constraints- Lack of established recycling infrastructureOPPORTUNITIES- Requirement for more cost-effective encapsulation techniques compared to present ones- Increasing investments in renewable power projects- Continuous R&D and technological advancements in PV technologyCHALLENGES- Space availability concerns to deploy solar infrastructure
-
5.3 TRENDS/DISRUPTIONS IMPACTING CUSTOMERS’ BUSINESSES
-
5.4 SUPPLY CHAIN ANALYSISRAW MATERIAL PROVIDERSENCAPSULANT MANUFACTURERSPV MODULE MANUFACTURERSEND USERS
-
5.5 ECOSYSTEM/MARKET MAP
- 5.6 TECHNOLOGY ANALYSIS
-
5.7 PATENT ANALYSISLIST OF MAJOR PATENTS
-
5.8 TRADE ANALYSISEXPORT SCENARIOIMPORT SCENARIO
-
5.9 PORTER'S FIVE FORCES ANALYSISTHREAT OF SUBSTITUTESTHREAT OF NEW ENTRANTSBARGAINING POWER OF SUPPLIERSBARGAINING POWER OF BUYERSINTENSITY OF COMPETITIVE RIVALRY
- 6.1 INTRODUCTION
-
6.2 CRYSTALLINE SILICON SOLARINCREASING NEED FOR ECONOMICAL AND SUSTAINABLE RENEWABLE RESOURCES FOR INDUSTRIAL SOLAR POWER GENERATION TO BOOST MARKET GROWTHSINGLE CRYSTALLINE- High efficiency in different environmental conditions and minimum space requirement to drive marketPOLYCRYSTALLINE- Low production costs to increase demand
-
6.3 THIN-FILM SOLARFABRICATION OF HIGHLY EFFICIENT FLEXIBLE SOLAR PANELS TO FOSTER MARKET GROWTHCADMIUM TELLURIDE (CDTE)- High efficiency in low-light environments to fuel segmental growthCOPPER-INDIUM-GALLIUM-SELENIDE (CIGS)- Exceptionally stable performance in harsh weather conditions to drive marketAMORPHOUS SILICON- Use in small PV modules for residential applications to propel market
- 7.1 INTRODUCTION
-
7.2 ETHYLENE-VINYL ACETATE (EVA)LOW COST AND PROPERTIES SUCH AS TENSILE STRENGTH AND TRANSPARENCY TO SOLAR RADIATION TO DRIVE SEGMENTAL GROWTH
-
7.3 POLYVINYL BUTYRAL (PVB)INCREASING USE IN BUILDING-INTEGRATED PVS AND SOLAR INDUSTRY TO BOOST SEGMENTAL GROWTH
-
7.4 POLYDIMETHYLSILOXANE (PDMS)LOWER OPTICAL ABSORPTION AND MECHANICAL ROBUSTNESS TO CONTRIBUTE TO HIGH ADOPTION
-
7.5 IONOMERREQUIREMENT FOR FASTER AND COST-EFFICIENT LAMINATION PROCESS OF SOLAR CELLS TO PROPEL SEGMENTAL GROWTH
-
7.6 POLYOLEFINHIGH ELECTRIC INSULATION PROPERTIES TO DRIVE DEMAND
-
7.7 THERMOPLASTIC POLYURETHANE (TPU)NEED TO INCREASE EFFICIENCY AND DURABILITY OF SOLAR MODULES TO FOSTER SEGMENTAL GROWTH
- 8.1 INTRODUCTION
-
8.2 GROUND-MOUNTED PVINCREASE IN UTILITY-SCALE PROJECTS TO BOOST DEMAND
-
8.3 BUILDING-INTEGRATED PVRISING DEMAND FOR COST-EFFICIENT AND AESTHETICALLY APPEALING POWER GENERATION SYSTEMS TO SUPPORT SEGMENTAL GROWTHROOFTOPSWINDOWS
-
8.4 FLOATING PVHIGH POWER GENERATION AT LOW COST, ALONG WITH WATER MANAGEMENT BENEFITS, TO CONTRIBUTE TO SEGMENTAL GROWTH
- 8.5 OTHERS
- 9.1 INTRODUCTION
-
9.2 ASIA PACIFICIMPACT OF RECESSION ON SOLAR ENCAPSULATION MARKET IN ASIA PACIFIC- Japan- China- India- Australia- South Korea- Rest of Asia Pacific
-
9.3 NORTH AMERICAIMPACT OF RECESSION ON SOLAR ENCAPSULATION MARKET IN NORTH AMERICA- US- Canada- Mexico
-
9.4 EUROPEIMPACT OF RECESSION ON SOLAR ENCAPSULATION MARKET IN EUROPE- Germany- Italy- France- UK- Netherlands- Spain- Rest of Europe
-
9.5 ROWIMPACT OF RECESSION ON SOLAR ENCAPSULATION MARKET IN ROW- UAE- Brazil- Chile- Israel- Other GCC countries- Other countries

- 10.1 OVERVIEW
- 10.2 KEY STRATEGIES ADOPTED BY MAJOR PLAYERS
- 10.3 MARKET SHARE ANALYSIS
- 10.4 MARKET EVALUATION FRAMEWORK
- 10.5 FIVE-YEAR REVENUE ANALYSIS OF KEY PLAYERS
-
10.6 COMPANY EVALUATION MATRIXSTARSEMERGING LEADERSPERVASIVE PLAYERSPARTICIPANTSCOMPANY FOOTPRINT
-
10.7 COMPETITIVE SCENARIOS AND TRENDSPRODUCT LAUNCHESOTHERS
-
11.1 KEY PLAYERSMITSUI CHEMICALS, INC.- Business overview- Products/Solutions/Services offered- Recent developments- MnM viewELKEM ASA- Business overview- Products/Solutions/Services offered- MnM viewDOW- Business overview- Products/Solutions/Services offered.- MnM viewDUPONT- Business overview- Products/Solutions/Services offered- Recent developments- MnM view3M- Business overview- Products/Solutions/Services offered- MnM viewH.B. FULLER COMPANY- Business overview- Products/Solutions/Services offered- Recent developmentsEXXON MOBIL CORPORATION- Business overview- Products/Solutions/Services offeredAVANTOR, INC.- Business overview- Products/Solutions/Services offeredHANGZHOU FIRST APPLIED MATERIAL CO.,LTD.- Business overview- Products/Solutions/Services offeredLG CHEM- Business overview- Products/Solutions/Services offeredRENEWSYS INDIA PVT. LTD.- Business overview- Products/Solutions/Services offered- Recent developmentsNOVOPOLYMERS- Business overview- Products/Solutions/Services offeredJA SOLAR TECHNOLOGY CO.,LTD.- Business overview- Products/Solutions/Services offeredSHIN-ETSU CHEMICAL CO., LTD.- Business overview- Products/Solutions/Services offered- Recent developmentsGUANGZHOU LUSHAN NEW MATERIALS CO., LTD.- Business overview- Products/Solutions/Services offered
-
11.2 OTHER PLAYERSJIANGSU SVECK PHOTOVOLTAIC NEW MATERIAL CO.,LTD.VISHAKHA RENEWABLES PVT. LTD.FILMTECBETTERIALDNPSOLAR
- 12.1 INSIGHTS FROM INDUSTRY EXPERTS
- 12.2 DISCUSSION GUIDE
- 12.3 KNOWLEDGESTORE: MARKETSANDMARKETS’ SUBSCRIPTION PORTAL
- 12.4 CUSTOMIZATION OPTIONS
- 12.5 RELATED REPORTS
- 12.6 AUTHOR DETAILS
- TABLE 1 SOLAR ENCAPSULATION MARKET: SNAPSHOT
- TABLE 2 ROLE OF PARTICIPANTS IN SOLAR ENCAPSULATION ECOSYSTEM
- TABLE 3 SOLAR ENCAPSULATION: INNOVATIONS AND PATENT REGISTRATIONS, AUGUST 2018–NOVEMBER 2022
- TABLE 4 EXPORT DATA FOR HS CODE 854140-COMPLIANT PRODUCTS, BY COUNTRY, 2020–2022 (USD THOUSAND)
- TABLE 5 IMPORT DATA FOR HS CODE 854140-COMPLIANT PRODUCTS, BY COUNTRY, 2020–2022 (USD THOUSAND)
- TABLE 6 SOLAR ENCAPSULATION MARKET: PORTER'S FIVE FORCES ANALYSIS
- TABLE 7 MARKET, BY TECHNOLOGY, 2019–2022 (USD MILLION)
- TABLE 8 MARKET, BY TECHNOLOGY, 2023–2028 (USD MILLION)
- TABLE 9 CRYSTALLINE SILICON SOLAR: MARKET, BY REGION, 2019–2022 (USD MILLION)
- TABLE 10 CRYSTALLINE SILICON SOLAR: MARKET, BY REGION, 2023–2028 (USD MILLION)
- TABLE 11 SINGLE CRYSTALLINE: MARKET FOR CRYSTALLINE SILICON SOLAR, BY REGION, 2019–2022 (USD MILLION)
- TABLE 12 SINGLE CRYSTALLINE: MARKET FOR CRYSTALLINE SILICON SOLAR, BY REGION, 2023–2028 (USD MILLION)
- TABLE 13 POLYCRYSTALLINE: MARKET FOR CRYSTALLINE SILICON SOLAR, BY REGION, 2019–2022 (USD MILLION)
- TABLE 14 POLYCRYSTALLINE: MARKET FOR CRYSTALLINE SILICON SOLAR, BY REGION, 2023–2028 (USD MILLION)
- TABLE 15 THIN-FILM SOLAR: MARKET, BY REGION, 2019–2022 (USD MILLION)
- TABLE 16 THIN-FILM SOLAR: MARKET, BY REGION, 2023–2028 (USD MILLION)
- TABLE 17 CADMIUM TELLURIDE (CDTE): MARKET FOR THIN-FILM SOLAR, BY REGION, 2019–2022 (USD MILLION)
- TABLE 18 CADMIUM TELLURIDE (CDTE): MARKET FOR THIN-FILM SOLAR, BY REGION, 2023–2028 (USD MILLION)
- TABLE 19 COPPER-INDIUM-GALLIUM-SELENIDE (CIGS): MARKET FOR THIN-FILM SOLAR, BY REGION, 2019–2022 (USD MILLION)
- TABLE 20 COPPER-INDIUM-GALLIUM-SELENIDE (CIGS): MARKET FOR THIN-FILM SOLAR, BY REGION, 2023–2028 (USD MILLION)
- TABLE 21 AMORPHOUS SILICON: MARKET FOR THIN-FILM SOLAR, BY REGION, 2019–2022 (USD MILLION)
- TABLE 22 AMORPHOUS SILICON: MARKET FOR THIN-FILM SOLAR, BY REGION, 2023–2028 (USD MILLION)
- TABLE 23 MARKET, BY MATERIAL, 2019–2022 (KILOTON)
- TABLE 24 MARKET, BY MATERIAL, 2023–2028 (KILOTON)
- TABLE 25 MARKET, BY MATERIAL, 2019–2022 (USD MILLION)
- TABLE 26 MARKET, BY MATERIAL, 2023–2028 (USD MILLION)
- TABLE 27 ETHYLENE-VINYL ACETATE: MARKET, BY REGION, 2019–2022 (KILOTON)
- TABLE 28 ETHYLENE-VINYL ACETATE: MARKET, BY REGION, 2023–2028 (KILOTON)
- TABLE 29 ETHYLENE-VINYL ACETATE: MARKET, BY REGION, 2019–2022 (USD MILLION)
- TABLE 30 ETHYLENE-VINYL ACETATE: MARKET, BY REGION, 2023–2028 (USD MILLION)
- TABLE 31 POLYVINYL BUTYRAL (PVB): MARKET, BY REGION, 2019–2022 (KILOTON)
- TABLE 32 POLYVINYL BUTYRAL (PVB): MARKET, BY REGION, 2023–2028 (KILOTON)
- TABLE 33 POLYVINYL BUTYRAL (PVB): MARKET, BY REGION, 2019–2022 (USD MILLION)
- TABLE 34 POLYVINYL BUTYRAL (PVB): MARKET, BY REGION, 2023–2028 (USD MILLION)
- TABLE 35 POLYDIMETHYLSILOXANE (PDMS): MARKET, BY REGION, 2019–2022 (KILOTON)
- TABLE 36 POLYDIMETHYLSILOXANE (PDMS): MARKET, BY REGION, 2023–2028 (KILOTON)
- TABLE 37 POLYDIMETHYLSILOXANE (PDMS): MARKET, BY REGION, 2019–2022 (USD MILLION)
- TABLE 38 POLYDIMETHYLSILOXANE (PDMS): MARKET, BY REGION, 2023–2028 (USD MILLION)
- TABLE 39 IONOMER: MARKET, BY REGION, 2019–2022 (KILOTON)
- TABLE 40 IONOMER: MARKET, BY REGION, 2023–2028 (KILOTON)
- TABLE 41 IONOMER: MARKET, BY REGION, 2019–2022 (USD MILLION)
- TABLE 42 IONOMER: MARKET, BY REGION, 2023–2028 (USD MILLION)
- TABLE 43 POLYOLEFIN: MARKET, BY REGION, 2019–2022 (KILOTON)
- TABLE 44 POLYOLEFIN: MARKET, BY REGION, 2023–2028 (KILOTON)
- TABLE 45 POLYOLEFIN: MARKET, BY REGION, 2019–2022 (USD MILLION)
- TABLE 46 POLYOLEFIN: MARKET, BY REGION, 2023–2028 (USD MILLION)
- TABLE 47 THERMOPLASTIC POLYURETHANE (TPU): MARKET, BY REGION, 2019–2022 (KILOTON)
- TABLE 48 THERMOPLASTIC POLYURETHANE (TPU): MARKET, BY REGION, 2023–2028 (KILOTON)
- TABLE 49 THERMOPLASTIC POLYURETHANE (TPU): MARKET, BY REGION, 2019–2022 (USD MILLION)
- TABLE 50 THERMOPLASTIC POLYURETHANE (TPU): MARKET, BY REGION, 2023–2028 (USD MILLION)
- TABLE 51 MARKET: BY APPLICATION, 2019–2022 (USD MILLION)
- TABLE 52 MARKET: BY APPLICATION, 2023–2028 (USD MILLION)
- TABLE 53 GROUND-MOUNTED PV: MARKET, BY REGION, 2019–2022 (USD MILLION)
- TABLE 54 GROUND-MOUNTED PV: MARKET, BY REGION, 2023–2028 (USD MILLION)
- TABLE 55 BUILDING-INTEGRATED PV: MARKET, BY REGION, 2019–2022 (USD MILLION)
- TABLE 56 BUILDING-INTEGRATED PV: MARKET, BY REGION, 2023–2028 (USD MILLION)
- TABLE 57 FLOATING PV: MARKET, BY REGION, 2019–2022 (USD MILLION)
- TABLE 58 FLOATING PV: MARKET, BY REGION, 2023–2028 (USD MILLION)
- TABLE 59 OTHERS: MARKET, BY REGION, 2019–2022 (USD MILLION)
- TABLE 60 OTHERS: MARKET, BY REGION, 2023–2028 (USD MILLION)
- TABLE 61 MARKET, BY REGION, 2019–2022 (KILOTON)
- TABLE 62 MARKET, BY REGION, 2023–2028 (KILOTON)
- TABLE 63 MARKET, BY REGION, 2019–2022 (USD MILLION)
- TABLE 64 MARKET, BY REGION, 2023–2028 (USD MILLION)
- TABLE 65 ASIA PACIFIC: MARKET, BY MATERIAL, 2019–2022 (KILOTON)
- TABLE 66 ASIA PACIFIC: MARKET, BY MATERIAL, 2023–2028 (KILOTON)
- TABLE 67 ASIA PACIFIC: MARKET, BY MATERIAL, 2019–2022 (USD MILLION)
- TABLE 68 ASIA PACIFIC: MARKET, BY MATERIAL, 2023–2028 (USD MILLION)
- TABLE 69 ASIA PACIFIC: MARKET, BY TECHNOLOGY, 2019–2022 (USD MILLION)
- TABLE 70 ASIA PACIFIC: MARKET, BY TECHNOLOGY, 2023–2028 (USD MILLION)
- TABLE 71 ASIA PACIFIC: MARKET, BY APPLICATION, 2019–2022 (USD MILLION)
- TABLE 72 ASIA PACIFIC: MARKET, BY APPLICATION, 2023–2028 (USD MILLION)
- TABLE 73 ASIA PACIFIC: MARKET, BY COUNTRY, 2019–2022 (USD MILLION)
- TABLE 74 ASIA PACIFIC: MARKET, BY COUNTRY, 2023–2028 (USD MILLION)
- TABLE 75 JAPAN: MARKET, BY TECHNOLOGY, 2019–2022 (USD MILLION)
- TABLE 76 JAPAN: MARKET, BY TECHNOLOGY, 2023–2028 (USD MILLION)
- TABLE 77 CHINA: MARKET, BY TECHNOLOGY, 2019–2022 (USD MILLION)
- TABLE 78 CHINA: MARKET, BY TECHNOLOGY, 2023–2028 (USD MILLION)
- TABLE 79 INDIA: MARKET, BY TECHNOLOGY, 2019–2022 (USD MILLION)
- TABLE 80 INDIA: MARKET, BY TECHNOLOGY, 2023–2028 (USD MILLION)
- TABLE 81 AUSTRALIA: MARKET, BY TECHNOLOGY, 2019–2022 (USD MILLION)
- TABLE 82 AUSTRALIA: MARKET, BY TECHNOLOGY, 2023–2028 (USD MILLION)
- TABLE 83 SOUTH KOREA: MARKET, BY TECHNOLOGY, 2019–2022 (USD MILLION)
- TABLE 84 SOUTH KOREA: MARKET, BY TECHNOLOGY, 2023–2028 (USD MILLION)
- TABLE 85 REST OF ASIA PACIFIC: MARKET, BY TECHNOLOGY, 2019–2022 (USD MILLION)
- TABLE 86 REST OF ASIA PACIFIC: MARKET, BY TECHNOLOGY, 2023–2028 (USD MILLION)
- TABLE 87 NORTH AMERICA: MARKET, BY MATERIAL, 2019–2022 (KILOTON)
- TABLE 88 NORTH AMERICA: MARKET, BY MATERIAL, 2023–2028 (KILOTON)
- TABLE 89 NORTH AMERICA: MARKET, BY MATERIAL, 2019–2022 (USD MILLION)
- TABLE 90 NORTH AMERICA: MARKET, BY MATERIAL, 2023–2028 (USD MILLION)
- TABLE 91 NORTH AMERICA: MARKET, BY TECHNOLOGY, 2019–2022 (USD MILLION)
- TABLE 92 NORTH AMERICA: MARKET, BY TECHNOLOGY, 2023–2028 (USD MILLION)
- TABLE 93 NORTH AMERICA: MARKET, BY APPLICATION, 2019–2022 (USD MILLION)
- TABLE 94 NORTH AMERICA: MARKET, BY APPLICATION, 2023–2028 (USD MILLION)
- TABLE 95 NORTH AMERICA: MARKET, BY COUNTRY, 2019–2022 (KILOTON)
- TABLE 96 NORTH AMERICA: MARKET, BY COUNTRY, 2023–2028 (KILOTON)
- TABLE 97 NORTH AMERICA: MARKET, BY COUNTRY, 2019–2022 (USD MILLION)
- TABLE 98 NORTH AMERICA: MARKET, BY COUNTRY, 2023–2028 (USD MILLION)
- TABLE 99 US: MARKET, BY TECHNOLOGY, 2019–2022 (USD MILLION)
- TABLE 100 US: MARKET, BY TECHNOLOGY, 2023–2028 (USD MILLION)
- TABLE 101 CANADA: MARKET, BY TECHNOLOGY, 2019–2022 (USD MILLION)
- TABLE 102 CANADA: MARKET, BY TECHNOLOGY, 2023–2028 (USD MILLION)
- TABLE 103 MEXICO: MARKET, BY TECHNOLOGY, 2019–2022 (USD MILLION)
- TABLE 104 MEXICO: MARKET, BY TECHNOLOGY, 2023–2028 (USD MILLION)
- TABLE 105 EUROPE: MARKET, BY MATERIAL, 2019–2022 (KILOTON)
- TABLE 106 EUROPE: MARKET, BY MATERIAL, 2023–2028 (KILOTON)
- TABLE 107 EUROPE: MARKET, BY MATERIAL, 2019–2022 (USD MILLION)
- TABLE 108 EUROPE: MARKET, BY MATERIAL, 2023–2028 (USD MILLION)
- TABLE 109 EUROPE: MARKET, BY TECHNOLOGY, 2019–2022 (USD MILLION)
- TABLE 110 EUROPE: MARKET, BY TECHNOLOGY, 2023–2028 (USD MILLION)
- TABLE 111 EUROPE: MARKET, BY APPLICATION, 2019–2022 (USD MILLION)
- TABLE 112 EUROPE: MARKET, BY APPLICATION, 2023–2028 (USD MILLION)
- TABLE 113 EUROPE: MARKET, BY COUNTRY, 2019–2022 (USD MILLION)
- TABLE 114 EUROPE: MARKET, BY COUNTRY, 2023–2028 (USD MILLION)
- TABLE 115 GERMANY: MARKET, BY TECHNOLOGY, 2019–2022 (USD MILLION)
- TABLE 116 GERMANY: MARKET, BY TECHNOLOGY, 2023–2028 (USD MILLION)
- TABLE 117 ITALY: MARKET, BY TECHNOLOGY, 2019–2022 (USD MILLION)
- TABLE 118 ITALY: MARKET, BY TECHNOLOGY, 2023–2028 (USD MILLION)
- TABLE 119 FRANCE: MARKET, BY TECHNOLOGY, 2019–2022 (USD MILLION)
- TABLE 120 FRANCE: MARKET, BY TECHNOLOGY, 2023–2028 (USD MILLION)
- TABLE 121 UK: MARKET, BY TECHNOLOGY, 2019–2022 (USD MILLION)
- TABLE 122 UK: MARKET, BY TECHNOLOGY, 2023–2028 (USD MILLION)
- TABLE 123 NETHERLANDS: MARKET, BY TECHNOLOGY, 2019–2022 (USD MILLION)
- TABLE 124 NETHERLANDS: MARKET, BY TECHNOLOGY, 2023–2028 (USD MILLION)
- TABLE 125 SPAIN: MARKET, BY TECHNOLOGY, 2019–2022 (USD MILLION)
- TABLE 126 SPAIN: MARKET, BY TECHNOLOGY, 2023–2028 (USD MILLION)
- TABLE 127 REST OF EUROPE: MARKET, BY TECHNOLOGY, 2019–2022 (USD MILLION)
- TABLE 128 REST OF EUROPE: MARKET, BY TECHNOLOGY, 2023–2028 (USD MILLION)
- TABLE 129 ROW: MARKET, BY MATERIAL, 2019–2022 (KILOTON)
- TABLE 130 ROW: MARKET, BY MATERIAL, 2023–2028 (KILOTON)
- TABLE 131 ROW: MARKET, BY MATERIAL, 2019–2022 (USD MILLION)
- TABLE 132 ROW: MARKET, BY MATERIAL, 2023–2028 (USD MILLION)
- TABLE 133 ROW: MARKET, BY TECHNOLOGY, 2019–2022 (USD MILLION)
- TABLE 134 ROW: MARKET, BY TECHNOLOGY, 2023–2028 (USD MILLION)
- TABLE 135 ROW: MARKET, BY APPLICATION, 2019–2022 (USD MILLION)
- TABLE 136 ROW: MARKET, BY APPLICATION, 2023–2028 (USD MILLION)
- TABLE 137 ROW: MARKET, BY REGION, 2019–2022 (KILOTON)
- TABLE 138 ROW: MARKET, BY REGION, 2023–2028 (KILOTON)
- TABLE 139 ROW: MARKET, BY REGION, 2019–2022 (USD MILLION)
- TABLE 140 ROW: MARKET, BY REGION, 2023–2028 (USD MILLION)
- TABLE 141 UAE: MARKET, BY TECHNOLOGY, 2019–2022 (USD MILLION)
- TABLE 142 UAE: MARKET, BY TECHNOLOGY, 2023–2028 (USD MILLION)
- TABLE 143 BRAZIL: MARKET, BY TECHNOLOGY, 2019–2022 (USD MILLION)
- TABLE 144 BRAZIL: MARKET, BY TECHNOLOGY, 2023–2028 (USD MILLION)
- TABLE 145 CHILE: MARKET, BY TECHNOLOGY, 2019–2022 (USD MILLION)
- TABLE 146 CHILE: MARKET, BY TECHNOLOGY, 2023–2028 (USD MILLION)
- TABLE 147 ISRAEL: MARKET, BY TECHNOLOGY, 2019–2022 (USD MILLION)
- TABLE 148 ISRAEL: MARKET, BY TECHNOLOGY, 2023–2028 (USD MILLION)
- TABLE 149 OTHER GCC COUNTRIES: MARKET, BY TECHNOLOGY, 2019–2022 (USD MILLION)
- TABLE 150 OTHER GCC COUNTRIES: MARKET, BY TECHNOLOGY, 2023–2028 (USD MILLION)
- TABLE 151 OTHER COUNTRIES: MARKET, BY TECHNOLOGY, 2019–2022 (USD MILLION)
- TABLE 152 OTHER COUNTRIES: MARKET, BY TECHNOLOGY, 2023–2028 (USD MILLION)
- TABLE 153 STRATEGIES ADOPTED BY MAJOR PLAYERS, 2019–2023
- TABLE 154 MARKET SHARE ANALYSIS, 2022
- TABLE 155 MARKET EVALUATION FRAMEWORK, 2019–2023
- TABLE 156 COMPANY OVERALL FOOTPRINT
- TABLE 157 COMPANY MATERIAL FOOTPRINT
- TABLE 158 COMPANY TECHNOLOGY FOOTPRINT
- TABLE 159 COMPANY REGION FOOTPRINT
- TABLE 160 MARKET: PRODUCT LAUNCHES, 2021–2023
- TABLE 161 MARKET: OTHERS, 2019–2023
- TABLE 162 MITSUI CHEMICALS, INC.: COMPANY OVERVIEW
- TABLE 163 MITSUI CHEMICALS, INC.: PRODUCTS/SOLUTIONS/SERVICES OFFERED
- TABLE 164 MITSUI CHEMICALS, INC.: OTHERS
- TABLE 165 ELKEM ASA: COMPANY SNAPSHOT
- TABLE 166 ELKEM ASA: PRODUCTS/SOLUTIONS/SERVICES OFFERED
- TABLE 167 DOW: COMPANY OVERVIEW
- TABLE 168 DOW: PRODUCTS/SOLUTIONS/SERVICES OFFERED
- TABLE 169 DUPONT: COMPANY OVERVIEW
- TABLE 170 DUPONT: PRODUCTS/SOLUTIONS/SERVICE OFFERED
- TABLE 171 DUPONT: OTHERS
- TABLE 172 3M: COMPANY OVERVIEW
- TABLE 173 3M: PRODUCTS/SOLUTIONS/SERVICES OFFERED
- TABLE 174 H.B. FULLER COMPANY: COMPANY OVERVIEW
- TABLE 175 H.B. FULLER COMPANY: PRODUCTS/SOLUTIONS/SERVICES OFFERED
- TABLE 176 H.B. FULLER COMPANY: DEALS
- TABLE 177 EXXON MOBIL CORPORATION: COMPANY OVERVIEW
- TABLE 178 EXXON MOBIL CORPORATION: PRODUCTS/SOLUTIONS/SERVICES OFFERED
- TABLE 179 AVANTOR, INC.: BUSINESS OVERVIEW
- TABLE 180 AVANTOR, INC.: PRODUCTS/SOLUTIONS/SERVICES OFFERED
- TABLE 181 HANGZHOU FIRST APPLIED MATERIAL CO.,LTD.: COMPANY OVERVIEW
- TABLE 182 HANGZHOU FIRST APPLIED MATERIAL CO.,LTD.: PRODUCTS/SOLUTIONS/SERVICES OFFERED
- TABLE 183 LG CHEM: COMPANY OVERVIEW
- TABLE 184 LG CHEM: PRODUCTS/SOLUTIONS/SERVICES OFFERED
- TABLE 185 RENEWSYS INDIA PVT. LTD.: COMPANY OVERVIEW
- TABLE 186 RENEWSYS INDIA PVT. LTD.: PRODUCTS/SOLUTIONS/SERVICES OFFERED
- TABLE 187 RENEWSYS INDIA PVT. LTD.: PRODUCT LAUNCHES
- TABLE 188 RENEWSYS INDIA PVT. LTD.: OTHERS
- TABLE 189 NOVOPOLYMERS: COMPANY OVERVIEW
- TABLE 190 NOVOPOLYMERS: PRODUCTS/SOLUTIONS/SERVICES OFFERED
- TABLE 191 JA SOLAR TECHNOLOGY CO.,LTD.: COMPANY OVERVIEW
- TABLE 192 JA SOLAR TECHNOLOGY CO.,LTD.: PRODUCTS/SOLUTIONS/SERVICES OFFERED
- TABLE 193 SHIN-ETSU CHEMICAL CO., LTD.: COMPANY OVERVIEW
- TABLE 194 SHIN-ETSU CHEMICAL CO., LTD.: PRODUCTS/SOLUTIONS/SERVICES OFFERED
- TABLE 195 SHIN-ETSU CHEMICAL CO., LTD.: OTHERS
- TABLE 196 GUANGZHOU LUSHAN NEW MATERIALS CO., LTD.: COMPANY OVERVIEW
- TABLE 197 GUANGZHOU LUSHAN NEW MATERIALS CO., LTD.: PRODUCTS/SOLUTIONS/SERVICES OFFERED
- FIGURE 1 MARKET: SEGMENTATION
- FIGURE 2 MARKET: RESEARCH DESIGN
- FIGURE 3 DATA TRIANGULATION
- FIGURE 4 MARKET SIZE ESTIMATION METHODOLOGY: BOTTOM-UP APPROACH
- FIGURE 5 MARKET SIZE ESTIMATION METHODOLOGY: TOP-DOWN APPROACH
- FIGURE 6 MAIN METRICS CONSIDERED TO ANALYZE DEMAND FOR SOLAR ENCAPSULATION
- FIGURE 7 KEY METRICS CONSIDERED TO ASSESS SUPPLY OF SOLAR ENCAPSULATION
- FIGURE 8 MARKET: SUPPLY-SIDE ANALYSIS
- FIGURE 9 MARKET: MARKER SHARE ANALYSIS, 2022
- FIGURE 10 ASIA PACIFIC HELD LARGEST SHARE OF MARKET IN 2022
- FIGURE 11 ETHYLENE-VINYL ACETATE (EVA) SEGMENT TO LEAD MARKET, BY MATERIAL, IN 2028
- FIGURE 12 CRYSTALLINE SILICON SOLAR SEGMENT TO HOLD LARGEST SHARE OF MARKET, BY TECHNOLOGY, IN 2028
- FIGURE 13 GROUND-MOUNTED PV SEGMENT TO DOMINATE MARKET, BY APPLICATION, IN 2028
- FIGURE 14 INCREASING DEMAND FOR CLEAN POWER GENERATION TO BOOST MARKET GROWTH BETWEEN 2023 AND 2028
- FIGURE 15 EUROPE TO BE FASTEST-GROWING MARKET DURING FORECAST PERIOD
- FIGURE 16 ETHYLENE-VINYL ACETATE (EVA) SEGMENT TO ACCOUNT FOR LARGEST MARKET SHARE IN 2028
- FIGURE 17 CRYSTALLINE SILICON SOLAR SEGMENT TO HOLD LARGEST MARKET SHARE IN 2028
- FIGURE 18 GROUND-MOUNTED PV SEGMENT TO DOMINATE MARKET IN 2028
- FIGURE 19 GROUND-MOUNTED PV AND CHINA ACCOUNTED FOR LARGEST MARKET SHARES IN 2022
- FIGURE 20 MARKET: DRIVERS, RESTRAINTS, OPPORTUNITIES, AND CHALLENGES
- FIGURE 21 SHARE OF CUMULATIVE POWER CAPACITY, BY TECHNOLOGY, 2012–2027
- FIGURE 22 RENEWABLE POWER INVESTMENTS, 2015–2023
- FIGURE 23 TRENDS/DISRUPTIONS IMPACTING CUSTOMERS’ BUSINESSES
- FIGURE 24 MARKET: SUPPLY CHAIN ANALYSIS
- FIGURE 25 MARKET MAP
- FIGURE 26 MARKET: PATENTS APPLIED AND GRANTED, 2012–2022
- FIGURE 27 EXPORT DATA FOR HS CODE 854140-COMPLIANT PRODUCTS, BY COUNTRY, 2020–2022 (USD THOUSAND)
- FIGURE 28 IMPORT DATA FOR HS CODE 854140-COMPLIANT PRODUCTS, BY COUNTRY, 2020–2022 (USD THOUSAND)
- FIGURE 29 MARKET: PORTER'S FIVE FORCES ANALYSIS
- FIGURE 30 MARKET, BY TECHNOLOGY, 2022
- FIGURE 31 MARKET, BY MATERIAL, 2022
- FIGURE 32 MARKET, BY APPLICATION, 2022
- FIGURE 33 EUROPE TO EXHIBIT HIGHEST CAGR DURING FORECAST PERIOD
- FIGURE 34 MARKET, BY REGION, 2022
- FIGURE 35 ASIA PACIFIC: MARKET SNAPSHOT
- FIGURE 36 EUROPE: MARKET SNAPSHOT
- FIGURE 37 MARKET SHARE ANALYSIS OF TOP PLAYERS, 2022
- FIGURE 38 REVENUE ANALYSIS OF KEY PLAYERS, 2018–2022
- FIGURE 39 MARKET: COMPANY EVALUATION MATRIX, 2022
- FIGURE 40 MITSUI CHEMICALS, INC.: COMPANY SNAPSHOT
- FIGURE 41 ELKEM ASA: COMPANY SNAPSHOT
- FIGURE 42 DOW: COMPANY SNAPSHOT
- FIGURE 43 DUPONT: COMPANY SNAPSHOT
- FIGURE 44 3M: COMPANY SNAPSHOT
- FIGURE 45 H.B. FULLER COMPANY: COMPANY SNAPSHOT
- FIGURE 46 EXXON MOBIL CORPORATION: COMPANY SNAPSHOT
- FIGURE 47 AVANTOR, INC.: COMPANY SNAPSHOT
- FIGURE 48 LG CHEM: COMPANY SNAPSHOT
- FIGURE 49 SHIN-ETSU CHEMICAL CO., LTD.: COMPANY SNAPSHOT
The study involved major activities in estimating the current size of the solar encapsulation market. Exhaustive secondary research was done to collect information on the peer and parent markets. The next step was to validate these findings, assumptions, and sizing with industry experts across the value chain through primary research. Both top-down and bottom-up approaches were employed to estimate the total market size. Thereafter, market breakdown and data triangulation were used to estimate the market size of the segments and subsegments.
Secondary Research
This research study on the solar encapsulation market involved the use of extensive secondary sources, directories, and databases, such as Hoover’s, Bloomberg, Factiva, IRENA, International Energy Agency, and Statista Industry Journal, to collect and identify information useful for a technical, market-oriented, and commercial study of the solar encapsulation market. The other secondary sources included annual reports, press releases & investor presentations of companies, white papers, certified publications, articles by recognized authors, manufacturer associations, trade directories, and databases.
Primary Research
The solar encapsulation market comprises several stakeholders, such as solar encapsulation manufacturers, technology providers, and technical support providers in the supply chain. The demand side of this market is characterized by the rising demand for solar encapsulation in various applications such as ground-mounted, building-integrated photovoltaic, floating photovoltaic and other applications. The supply side is characterized by rising demand for contracts from the industrial sector and mergers & acquisitions among big players. Various primary sources from both the supply and demand sides of the market were interviewed to obtain qualitative and quantitative information. Following is the breakdown of primary respondents:
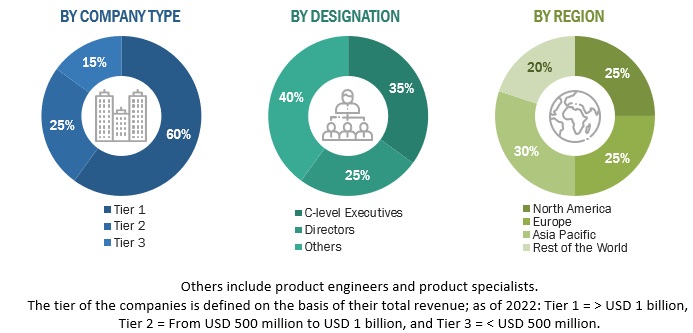
To know about the assumptions considered for the study, download the pdf brochure
Market Size Estimation
Both top-down and bottom-up approaches were used to estimate and validate the total size of the solar encapsulation market. These methods were also used extensively to estimate the size of various subsegments in the market. The research methodology used to estimate the market size includes the following:
- The key players in the industry and market have been identified through extensive secondary research, and their market share has been determined through primary and secondary research.
- The industry’s value chain and market size, in terms of value, have been determined through both primary and secondary research processes.
- All percentage shares, splits, and breakdowns have been determined using secondary sources and verified through primary sources.
Solar encapsulation Market Size: Top-Down Approach
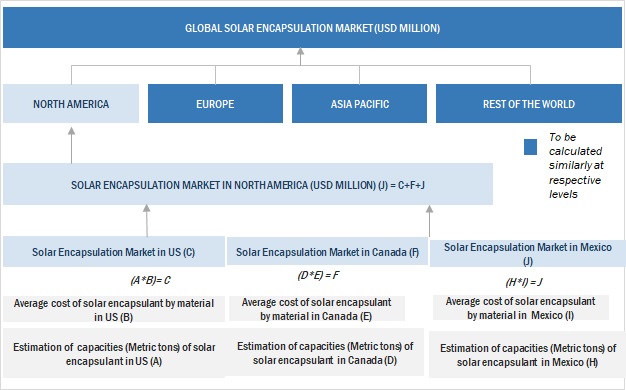
To know about the assumptions considered for the study, Request for Free Sample Report
Solar encapsulation Market Size: Bottom-Up Approach
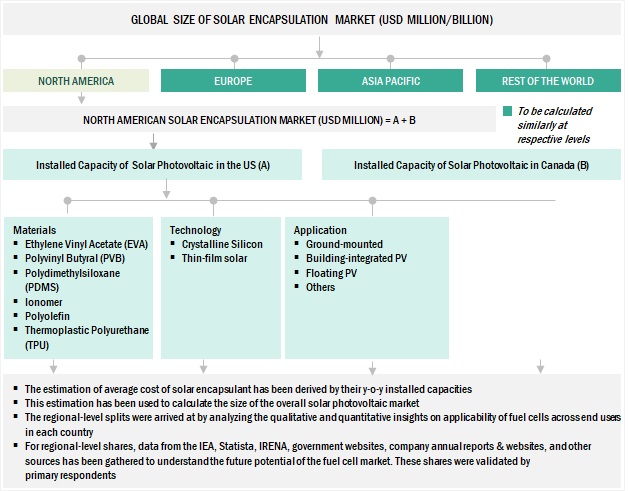
Data Triangulation
After arriving at the overall market size from the above estimation process, the total market has been split into several segments and subsegments. Data triangulation and market breakdown processes have been employed to complete the overall market engineering process and arrive at the exact statistics for all the segments and sub-segments, wherever applicable. The data has been triangulated by studying various factors and trends from both the demand- and supply sides. Along with this, the market has been validated using both the top-down and bottom-up approaches.
Market Definition
Solar encapsulation is the technique of applying specific polymeric materials for sealing photovoltaic (PV) cells and other components within a solar panel. This protective layer plays an essential role in preserving the panel's long-term durability and performance. Ethylene Vinyl Acetate (EVA), Thermoplastic Polyurethane (TPU), Polyvinyl Butyral (PVB), Polydimethylsiloxane (PDMS), Ionomer, and Polyolefin are the main types of materials used in the solar encapsulation process.
The solar encapsulation market size can be estimated by adding the revenues generated by the global companies manufacturing solar encapsulants.
Key Stakeholders
- PV Cell Manufacturer
- PV Module Manufacturer
- PV Market Technical Consultants
- Energy & power consulting companies
- Environmental research institutes
- Government and research organizations
- Institutional investors/shareholders
- Power and energy associations
- Repair and maintenance service providers
- Organizations, forums, alliances, and associations
- Clean energy generation research & consulting companies
- State and national regulatory authorities
Objectives of the Study
- To describe, segment, and forecast the solar encapsulation market by materials, technology, and application in terms of value
- To forecast the market across four key regions, namely, North America, Europe, Asia Pacific, and the Rest of the World (RoW), along with country-level analysis in terms of value and volume
- To provide detailed information about key drivers, restraints, opportunities, and challenges influencing the solar encapsulation market growth
- To strategically analyze the solar encapsulation market with respect to individual growth trends, prospects, and contributions of each segment to the market
- To analyze the supply chain, trends/disruptions impacting customer business, market/ecosystem map, pricing analysis, and regulatory landscape pertaining to solar encapsulations
- To strategically analyze micromarkets1 with respect to individual growth trends, expansions, and their contribution to the overall market
- To analyze opportunities for stakeholders in the solar encapsulation market and draw a competitive landscape for market players
- To benchmark players within the market using the company evaluation matrix, which analyzes market players based on several parameters within the broad categories of business and product strategies
- To analyze the key market players with respect to their market share, product specifications, and applications
- To strategically profile the key players and comprehensively analyze their market ranking and core competencies
- To analyze competitive developments in the solar encapsulation market, such as product launches, sales contracts, agreements, investments, expansions, and partnerships
Available Customizations:
With the given market data, MarketsandMarkets offers customizations according to the specific requirements of companies. The following customization options are available for the report:
Product Analysis
- Product Matrix, which provides a detailed comparison of the product portfolio of each company
Company Information
- Detailed analyses and profiling of additional market players


Growth opportunities and latent adjacency in Solar Encapsulation Market