Silage Inoculants & Enzymes Market by Type (Homofermentative & Heterofermentative), Species (Lactobacillus, Pediococcus & Enterococcus), Enzymes (Fibre-digesting & Starch-digesting), Crop-type, & by Geography - Global Trends and Forecast to 2020


Silage inoculants are used to increase the fermentation rate in silage and enzymes and to break down some of the fibre and starch in the silage. The silage inoculants & enzymes market is projected to exhibit a growth potential (4.0%) in the next five years., Factors such as increasing feed grain and compound feed prices, increasing livestock population, decreasing grazing and pasture land area, and increasing demand for livestock production are increasing the market globally. However, high set-up cost of ensiling and unawareness of the benefits of silage are a few restraining factors for this market, especially in the Asia-Pacific and Latin American region.
The global market is projected to reach $489.05 Million by 2020, at a CAGR of 4.0% from 2015 to 2020. It is projected to grow significantly for the next five years in almost all parts of the world, especially in the North American and European countries. High rate of adoption of silage inoculants & enzymes and increasing demand for animal products are projected to drive the market
The silage inoculants & enzymes industry has many players (small, medium, and large) however the industry is dominated by a few. ADDCON GROUP GmbH (Germany), E. I. du Pont de Nemours and Company (U.S.), Archer Daniels Midland Company (U.S.), Kemin Industries (U.S.),and Chr. Hansen A/S (Denmark) collectively accounted for a cumulative share of about 77.8% in 2014 in the silage inoculants & enzymes market. Other players include companies such as Volac International Ltd. (U.K.), Agri-King Inc. (U.S.), Biomin Holding GmbH (Austria), Lallemand Inc. (Canada), Schamann BioEnergy GmbH (Germany) which together accounted for 22.2% share in 2014 in this market and also have a strong presence in the market.
Silage Inoculants & Enzymes Market Share, by Region, 2015
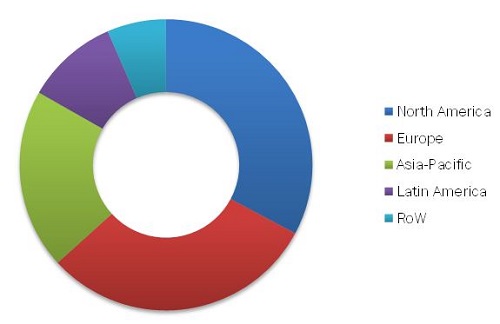
Source: Expert Interviews and MarketsandMarkets Analysis
This report estimates the market size of the global silage inoculants & enzymes market in terms of value ($Million). The market is segmented based on inoculant type, species, enzyme type, crop-type, and region. Market drivers, restraints, opportunities, and challenges, are discussed in detail. Market shares of the industry players are also discussed.
Scope of the Report
This research categorizes the global market based on type, species, enzyme, crop-type, and geography:
On the basis of inoculant type, the market has been segmented as follows:
- Homofermentative
- Heterofermentative
On the basis of species, the market has been segmented as follows:
- Lactobacillus
- Pediococcus
- Enterococcus
On the basis of enzyme, the market has been segmented as follows:
- Fiber-digesting
- Starch-digesting
On the basis of crop-type, the market has been segmented as follows:
- Corn
- Sorghum
- Alfalfa
- Clovers
- Others (barley, oats, rye, legumes and grasses)
On the basis of region, the market has been segmented as follows:
- North America
- Europe
- Asia-Pacific
- Latin America
- RoW
Silage inoculants consist of bacteria which are used to dominate the fermentation of the silage and further aid in better crop preservation. Silage inoculants are divided into two groups depending on how they ferment a common plant sugar, or glucose. A good silage inoculant helps in faster and more efficient fermentation. It further results in less energy and dry matter loss and better animal performance. Inoculants can decrease the silage shrink, increase silage quality, and result in the enhancement in the efficiency of milk or meat production.
The global silage inoculants & enzymes market is projected to reach $489.05 Million by 2020, at a CAGR of 4.0% from 2015 to 2020.
The global market is projected to grow significantly for the next five years in almost all parts of the world, especially in the North American and European countries. Increasing feed grains and compound feed prices, rising livestock population and decreasing grazing and pasture land area are some of the major drivers for silage inoculants and enzymes market globally. On the other hand, increasing R&D and investments in animal feed industry have also boasted the market growth. However, unawareness and low adoption rate of silage inoculants & enzymes and high set-up cost for ensiling are the major restraining factors to the growth of the market.
Silage Inoculants Market Size, by Type, 2015 vs 2020 ($Million)
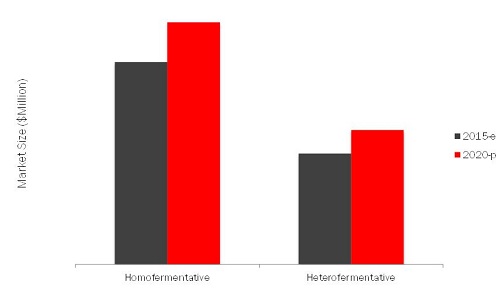
Source: Expert Interviews and MarketsandMarkets Analysis
The global market is projected to grow at a CAGR of 4.0% between 2015 and 2020. The market was dominated by North America which accounted for around 33% of the total share in 2014. There is an increasing popularity of processed corn silage since there has been a wider use of custom harvesters, larger farms, and availability of processing equipment in North America. The U.S. is the largest silage inoculants & enzymes market in the North America. In the U.S., nearly 10% of corn along with legumes and grass forages, sorghum, and small grains are reaped as silage.
The global silage inoculants & enzymes market is marked with intense competition due to the presence of a large number of both, big and small firms. New product launches, mergers & acquisitions, and partnerships and expansions are the key strategies adopted by market players to ensure their growth in the market. The market is dominated by players such as ADDCON GROUP GmbH (Germany), E. I. du Pont de Nemours and Company (U.S.), Archer Daniels Midland Company (U.S.), Kemin Industries (U.S.), and Chr. Hansen A/S (Denmark). Other players include companies such as Volac International Ltd. (U.K.), Agri-King Inc. (U.S.), Biomin Holding GmbH (Austria), Lallemand Inc. (Canada), and Schamann BioEnergy GmbH (Germany).
 Exclusive indicates content/data unique to MarketsandMarkets and not available with any competitors.
Table of Contents
1 Introduction (Page No. - 16)
1.1 Objectives of the Study
1.2 Market Definition
1.3 Market Scope
1.3.1 Markets Covered
1.3.2 Years Considered for the Study
1.4 Currency Considered for the Study
1.5 Limitations
1.6 Stakeholders
2 Research Methodology (Page No. - 21)
2.1 Research Data
2.1.1 Secondary Data
2.1.1.1 Key Data From Secondary Sources
2.1.2 Primary Data
2.1.2.1 Key Data From Primary Sources
2.1.2.2 Key Industry Insights
2.1.2.3 Breakdown of Primary Interviews
2.2 Factor Analysis
2.2.1 Introduction
2.2.2 Demand-Side Analysis
2.2.2.1 Ruminants Population & Increasing Demand for Milk & Meat Products
2.2.3 Supply-Side Analysis
2.2.3.1 Parent Market Analysis: Animal Feed Market Growth
2.2.3.2 Rising Cost of Natural Feed Products
2.3 Market Size Estimation
2.3.1 Bottom-Up Approach
2.3.2 Top-Down Approach
2.4 Market Breakdown & Data Triangulation
2.5 Research Assumptions & Limitations
2.5.1 Assumptions
2.5.2 Limitations
3 Executive Summary (Page No. - 34)
4 Premium Insights (Page No. - 39)
4.1 Attractive Opportunities in this Market
4.2 Silage Inoculants and Enzymes Market, By Crop Type
4.3 Silage Enzymes Market, By Type
4.4 North America Silage Inoculants & Enzymes Market
4.5 Silage Inoculants and Enzymes Market, By Species
4.6 Silage Inoculants & Enzymes: Market Shares of Top Countries 2014
4.7 Lifecycle Analysis: North America & Europe North America are Best Markets for Investments
5 Market Overview (Page No. - 46)
5.1 Introduction
5.2 Evolution
5.3 Market Segmentation
5.3.1 By Inoculants Type
5.3.2 By Species
5.3.3 By Enzymes Type
5.3.4 By Crop Type
5.4 Market Dynamics
5.4.1 Drivers
5.4.1.1 Increasing Feed Grain and Compound Feed Prices
5.4.1.2 Rising Livestock Number and Decreasing Pasture Land Area
5.4.1.3 Silage Increases Livestock Production
5.4.1.4 Increasing Demand for Animal Products
5.4.1.5 Growing Dairy Industry
5.4.1.6 Increasing Meat Consumption
6 Industry Trends (Page No. - 60)
6.1 Introduction
6.2 Value Chain Analysis
6.3 Supply Chain Analysis
6.3.1 Prominent Companies:
6.3.2 Small & Medium Enterprises:
6.3.3 End Users (Manufacturers/Consumers):
6.3.4 Key Influencers
6.4 Industry Insights
6.4.1 Lactobacillus Species Segment Dominated the Silage Inoculants Market in 2014
6.4.2 Lactobacillus Species: Projected to Be the Fastest-Growing Segment in the Silage Inoculants Market
6.5 Porter’s Five Forces Analysis
6.5.1 Intensity of Competitive Rivalry
6.5.2 Bargaining Power of Buyers
6.5.3 Bargaining Power of Suppliers
6.5.4 Threat of New Entrants
6.5.5 Threat of Substitutes
6.6 Strategic Benchmarking
6.6.1 Expansion & Product Portfolio Enhancement
6.6.2 Expanding Business By Investments, Agreements,Acquisitions, Collaborations, and Partnerships
7 Silage Inoculants Market, By Type (Page No. - 73)
7.1 Introduction
7.2 Homofermentative
7.3 Heterofermentative
8 Silage Inoculants Market, By Species (Page No. - 78)
8.1 Introduction
8.2 Silage Inoculants Market, By Species, 2013-2020
8.3 Lactobacillus Species
8.4 Pediococcus Species
8.5 Enterococcus Species
9 Silage Enzymes Market, By Type (Page No. - 84)
9.1 Introduction
9.2 Silage Enzymes Market, By Type, 2013-2020
9.3 Fiber-Digesting
9.4 Starch-Digesting
10 Silage Inoculants & Enzymes Market, By Crop Type (Page No. - 89)
10.1 Introduction
10.2 Corn
10.3 Sorghum
10.4 Alfalfa
10.5 Clover
10.6 Others (Crop Type)
11 Silage Inoculants & Enzymes Market, By Region (Page No. - 102)
11.1 Introduction
11.2 North America
11.2.1 U.S.
11.2.2 Canada
11.2.3 Mexico
11.3 Europe
11.3.1 Germany
11.3.2 France
11.3.3 Russia
11.3.4 Poland
11.3.5 Italy
11.3.6 Rest of Europe
11.4 Asia-Pacific
11.4.1 China
11.4.2 India
11.4.3 Australia
11.4.4 Japan
11.4.5 Rest of Asia-Pacific
11.5 Latin America
11.5.1 Brazil
11.5.2 Argentina
11.5.3 Rest of Latin America
11.6 Rest of the World (RoW)
11.6.1 South Africa
11.6.2 Others in RoW
12 Competitive Landscape (Page No. - 140)
12.1 Overview
12.2 Silage Inoculants & Enzymes Market: Market Share Analysis
12.3 Competitive Situation & Trends
12.3.1 Expansions
12.3.2 New Product Launches
12.3.3 Collaborations, Partnerships, Joint Ventures & Agreements
12.3.4 Acquisitions
12.3.5 Investments, Divestments & Dissolutions
13 Company Profiles (Page No. - 148)
(Company at A Glance, Recent Financials, Products & Services, Strategies & Insights, & Recent Developments)*
13.1 Introduction
13.2 Archer Daniels Midland Company
13.3 Chr. Hansen A/S
13.4 E. I. Du Pont De Nemours and Company
13.5 Kemin Industries
13.6 Volac International Ltd.
13.7 Addcon Group GnbH
13.8 Agri-King Inc.
13.9 Biomin Holding GnbH
13.10 Lallemand Inc.
13.11 Schaumann Bioenergy GnbH
*Details on Company at A Glance, Recent Financials, Products & Services, Strategies & Insights, & Recent Developments Might Not Be Captured in Case of Unlisted Companies.
14 Appendix (Page No. - 175)
14.1 Insights of Industry Experts
14.2 Discussion Guide
14.3 More Company Developments
14.3.1 New Product Launches/Developments
14.3.2 Mergers & Acquisitions
14.3.3 Expansions & Investments
14.4 Introducing RT: Real Time Market Intelligence
14.5 Available Customizations
14.6 Related Reports
List of Tables (77 Tables)
Table 1 World Livestock Numbers (Million Head)
Table 2 Effect of Inoculant on Silage Fermentation, Aerobic Stability, Intake Growth and Milk Production
Table 3 Silage Inoculants Market Size, By Type, 2013-2020 ($Million)
Table 4 Homofermentative Market Size, By Region, 2013-2020 ($Million)
Table 5 Heterofermentative Market Size, By Region, 2013-2020 ($Million)
Table 6 Silage Inoculants Market Size, By Species, 2013-2020 ($Million)
Table 7 Lactobacillus Species Market Size, By Region, 2013-2020 ($Million)
Table 8 Pediococcus Species Market Size, By Region, 2013-2020 ($Million)
Table 9 Enterococcus Species Market Size, By Region, 2013-2020 ($Million)
Table 10 Silage Enzymes Market Size, By Type, 2013-2020 ($Million)
Table 11 Fiber-Digesting Market Size, By Region, 2013-2020 ($Million)
Table 12 Starch-Digesting Market Size, By Region, 2013-2020 ($Million)
Table 13 Silage Inoculants & Enzymes Market Size, By Crop Type, 2013-2020 ($Million)
Table 14 Evaluation of Corn Silage: Typical Corn Silage Nutrient Values & Causes for Values Outside the Normal Range
Table 15 Corn Silage Inoculants & Enzymes Market Size, By Region, 2013-2020 ($Million)
Table 16 Sorghum Silage Inoculants & Enzymes Market Size, By Region, 2013-2020 ($Million)
Table 17 Percentage Dry Matter Losses of Alfalfa From Field to Feeding
Table 18 Average Alfalfa Protein Content
Table 19 Alfalfa Silage Inoculants & Enzymes Market Size, By Region, 2013-2020 ($Million)
Table 20 Clover Silage Inoculants & Enzymes Market Size, By Region, 2013-2020 ($Million)
Table 21 Quality of Silage
Table 22 Other Crop Silage Inoculants & Enzymes Market Size, By Region, 2013-2020 ($Million)
Table 23 Silage Inoculants & Enzymes Market Size, By Region, 2013-2020 ($Million)
Table 24 North America: Silage Inoculants & Enzymes Market Size, By Country, 2013-2020 ($Million)
Table 25 North America: Market Size, By Type, 2013-2020 ($Million)
Table 26 North America: Silage Inoculants Market Size, By Type, 2013-2020 ($Million)
Table 27 North America: Silage Inoculants Market Size, By Species, 2013-2020 ($Million)
Table 28 North America: Silage Enzymes Market Size, By Type, 2013-2020 ($Million)
Table 29 North America: Market Size, By Crop Type, 2013-2020 ($Million)
Table 30 U.S.: Silage Inoculants & Enzymes Market Size, By Type, 2013-2020 ($Million)
Table 31 Canada: Silage Inoculants & Enzymes Market Size, By Type, 2013-2020 ($Million)
Table 32 Mexico: Silage Inoculants & Enzymes Market Size, By Type, 2013-2020 ($Million)
Table 33 Europe: Silage Inoculants & Enzymes Market Size, By Country, 2013-2020 ($Million)
Table 34 Europe: Market Size, By Type, 2013-2020 ($Million)
Table 35 Europe: Silage Inoculants Market Size, By Type, 2013-2020 ($Million)
Table 36 Europe: Silage Inoculants Market Size, By Species, 2013-2020 ($Million)
Table 37 Europe: Silage Enzymes Market Size, By Type, 2013-2020 ($Million)
Table 38 Europe: Silage Inoculants & Enzymes Market Size, By Crop Type, 2013-2020 ($Million)
Table 39 Germany: Silage Inoculants & Enzymes Market Size, By Type, 2013-2020 ($Million)
Table 40 France: Silage Inoculants & Enzymes Market Size, By Type, 2013-2020 ($Million)
Table 41 Russia: Silage Inoculants & Enzymes Market Size, By Type, 2013-2020 ($Million)
Table 42 Poland: Silage Inoculants & Enzymes Market Size, By Type, 2013-2020 ($Million)
Table 43 Italy: Silage Inoculants & Enzymes Market Size, By Type, 2013-2020 ($Million)
Table 44 Russia: Silage Inoculants & Enzymes Market Size, By Type, 2013-2020 ($Million)
Table 45 Asia-Pacific: Silage Inoculants & Enzymes Market Size, By Country, 2013-2020 ($Million)
Table 46 Asia-Pacific: Market Size, By Type, 2013-2020 ($Million)
Table 47 Asia-Pacific: Silage Inoculants Market Size, By Type, 2013-2020 ($Million)
Table 48 Asia-Pacific: Silage Inoculants Market Size, By Species, 2013-2020 ($Million)
Table 49 Asia-Pacific: Silage Enzymes Market Size, By Type, 2013-2020 ($Million)
Table 50 Asia-Pacific: Silage Inoculants & Enzymes Market Size, By Crop Type, 2013-2020 ($Million)
Table 51 China: Silage Inoculants & Enzymes Market Size, By Type, 2013-2020 ($Million)
Table 52 India: Silage Inoculants & Enzymes Market Size, By Type, 2013-2020 ($Million)
Table 53 Australia: Silage Inoculants & Enzymes Market Size, By Type, 2013-2020 ($Million)
Table 54 Japan: Silage Inoculants & Enzymes Market Size, By Type, 2013-2020 ($Million)
Table 55 Rest of Asia-Pacific: Silage Inoculants & Enzymes Market Size, By Type, 2013-2020 ($Million)
Table 56 Latin America: Silage Inoculants & Enzymes Market Size, By Country, 2013-2020 ($Million)
Table 57 Latin America: Market Size, By Type, 2013-2020 ($Million)
Table 58 Latin America: Silage Inoculants Market Size, By Type, 2013-2020 ($Million)
Table 59 Latin America: Silage Inoculants Market Size, By Species, 2013-2020 ($Million)
Table 60 Latin America: Silage Enzymes Market Size, By Type, 2013-2020 ($Million)
Table 61 Latin America: Silage Inoculants & Enzymes Market Size, By Crop Type, 2013-2020 ($Million)
Table 62 Brazil: Silage Inoculants & Enzymes Market Size, By Type, 2013-2020 ($Million)
Table 63 Argentina: Silage Inoculants & Enzymes Market Size, By Type, 2013-2020 ($Million)
Table 64 Rest of Latin America: Silage Inoculants & Enzymes Market Size, By Type, 2013-2020 ($Million)
Table 65 RoW: Silage Inoculants & Enzymes Market Size, By Country, 2013-2020 ($Million)
Table 66 RoW: Market Size, By Type, 2013-2020 ($Million)
Table 67 RoW: Silage Inoculants Market Size, By Type, 2013-2020 ($Million)
Table 68 RoW: Silage Inoculants Market Size, By Species, 2013-2020 ($Million)
Table 69 RoW: Silage Enzymes Market Size, By Type, 2013-2020 ($Million)
Table 70 RoW: Silage Inoculants & Enzymes Market Size, By Crop Type, 2013-2020 ($Million)
Table 71 South Africa: Silage Inoculants & Enzymes Market Size, By Type, 2013-2020 ($Million)
Table 72 Others in RoW: Silage Inoculants & Enzymes Market Size, By Type, 2013-2020 ($Million)
Table 73 Expansions, 2010–2015
Table 74 New Product Launches, 2010–2015
Table 75 Collaborations, Partnerships, Joint Ventures & Agreements, 2010–2015
Table 76 Acquisitions, 2010–2015
Table 77 Investments, Divestments, and Dissolutions, 2010–2015
List of Figures (68 Figures)
Figure 1 Silage Inoculants & Enzymes Market Segmentation
Figure 2 Research Design
Figure 3 Global Cattle Population, 2000-2013, Billion Heads
Figure 4 Per Capita Consumption of Livestock Products
Figure 5 Price Trend for Soybean & Soybean Meal, 2000-2013 ($/MT)
Figure 6 Price Trend for Chicken, Sheep Meat & Beef, 2000-2013 ($/Kg)
Figure 7 Market Size Estimation Methodology: Bottom-Up Approach
Figure 8 Market Size Estimation Methodology: Top-Down Approach
Figure 9 Data Triangulation
Figure 10 Silage Inoculants Market Size, By Type, 2015 vs 2020 ($Million)
Figure 11 Silage Inoculants Market Size, By Species, 2015 vs 2020 ($Million)
Figure 12 Silage Enzymes Market Size, By Type, 2015 vs 2020 ($Million)
Figure 13 Silage Inoculants & Enzymes Market Size, By Crop Type, 2015 vs 2020 ($Million)
Figure 14 Silage Inoculants & Enzymes Market Trend, By Region, 2014
Figure 15 Attractive Opportunities in Silage Inoculants & Enzymes Market
Figure 16 Corn is Projected to Be the Largest Segment Throughout the Forecast Period
Figure 17 Fiber-Digesting Segment Would Be the Largest and Fastest- Growing Market During the Forecast Period
Figure 18 Corn Segment Accounted for Largest Share in the North American Silage Inoculants & Enzymes Market, 2014
Figure 19 Silage Inoculants Market: North America Will Continue to Dominate All Species Segments
Figure 20 U.S. Dominated the Global Silage Inoculants & Enzymes Market
Figure 21 North America & European Regions to Provide Immense Opportunities for Silage Inoculants & Enzymes Market Growth
Figure 22 Evolution of the Silage Inoculants & Enzymes Market
Figure 23 Silage Inoculants Market, By Type
Figure 24 Silage Inoculants Market, By Species
Figure 25 Silage Enzymes Market, By Type
Figure 26 Silage Inoculants & Enzymes Market, By Crop Type
Figure 27 Silage Inoculants and Enzymes:Drivers, Restraints, Opportunities and Challenges
Figure 28 Feed Grain Prices, 2004 to 2012 ($/MT)
Figure 29 Decreasing Area of Grazing Land, 2004 to 2012 ($/MT)
Figure 30 Annual Per Capita Milk Consumption, 2001 to 2007 (Kg)
Figure 31 Annual Average Population Growth Rate, 1980-2010
Figure 32 Heterofermentative Segment Projected to Be the Fasest-Growing Market Between 2015 and 2020
Figure 33 Silage Inoculants & Enzymes: Value Chan
Figure 34 Silage Inoculants & Enzymes Market: Supply Chain
Figure 35 Lactobacillus Species: Accounted for the Largest in the Silage Inoculants Market, By Species, 2014
Figure 36 North America is the Largest Market for Lactobacillus Species Segment
Figure 37 Porter’s Five Forces Analysis: Silage Inoculants & Enzymes Market
Figure 38 Strategic Benchmarking: Addcon & Dupont Largely Adopted Organic Growth Strategies for Expanding the Silage Inoculants & Enzymes Market
Figure 39 Strategic Benchmarking: ADM, Chr.Hansen & Volac Adopted Inorganic Growth Strategies for Expanding the Silage Inoculants & Enzymes Market
Figure 40 Silage Inoculants & Enzymes Market Size, By Type ($Million): A Snapshot
Figure 41 Homofermentative Market Growth (2015-2020)
Figure 42 Lactobacillus Species: Projected to Be the Largest and the Fastest-Growing Market Between 2015 and 2020
Figure 43 Silage Inoculants Market, By Species: Lactobacillus Had the Maximum Share in 2014
Figure 44 Silage Enzymes Market, By Type: Market Snapshot 2015 vs 2020 ($Million)
Figure 45 Silage Inoculants & Enzymes Market Size, By Crop-Type ($Million): A Snapshot
Figure 46 Corn Market Growth (2015-2020)
Figure 47 Corn Usage By Different Segments in 2012
Figure 48 Production of Sorghum for Silage in the U.S., 2000-2014 (Thousand Tons)
Figure 49 Geographic Snapshot (2014-2020): Rapidly Growing Markets are Emerging as New Hot Spots
Figure 50 North American Silage Inoculants & Enzymes Market: A Snapshot
Figure 51 U.S. States Based on Corn Production for Silage in 2013 & 2014 (Thousand Tons)
Figure 52 U.S. Projected to Have Largest Share in Global Silage Inoculants & Enzymes Market, 2015-2020
Figure 53 European Silage Inoculants & Enzymes Market: A Snapshot
Figure 54 European Silage Inoculants & Enzymes Market Share, By Type: A Snapshot, 2014
Figure 55 China: Market Leader in Asia-Pacific Region in 2014
Figure 56 Expansions and New Product Launches Were Preferred By Key Silage Inoculants & Enzymes Companies in the Last Five Years
Figure 57 Silage Inoculants & Enzymes Market Share, By Key Player, January 2010 to June 2015
Figure 58 Expansions Fueled Growth & Innovation of Silage Inoculants & Enzymes Between 2010 to 2015
Figure 59 Expansions & New Product Launches: the Key Strategies, 2010-2015
Figure 60 Geographic Revenue Mix of Top 5 Market Players
Figure 61 Archer Daniels Midland Company: Company Snapshot
Figure 62 Archer Daniels Midland Company(ADM): SWOT Analysis
Figure 63 Chr. Hansen A/S: Company Snapshot
Figure 64 Chr. Hansen A/S: SWOT Analysis
Figure 65 E. I. Du Pont De Nemours and Company : Company Snapshot
Figure 66 E. I. Du Pont De Nemours and Company : SWOT Analysis
Figure 67 Kemin Industries: SWOT Analysis
Figure 68 Volac International: SWOT Analysis


Growth opportunities and latent adjacency in Silage Inoculants & Enzymes Market