Silage Additives Market by Type (Inoculants, Organic Acids, Sugars, Absorbents, NPN Nutrients), Silage Crop (Corn, Alfalfa, Sorghum, Oats, Barley, Rye) Function (Stimulation, Inhibition), Form, and Region - Global Forecast to 2022


[148 Pages Report] The global silage additives market was valued at USD 1.55 Billion in 2016; this market is projected to reach USD 2.00 Billion by 2022, at a CAGR of 4.40% from 2017 to 2022.
The global market has been segmented on the basis of type, silage crop, function, and form. It has been further segmented on the basis of region into North America, Europe, Asia Pacific, South America, and the Rest of the World (RoW). The main objectives of the report are to define, segment, and project the market size of the silage additives market with respect to the above-mentioned segmentations and provide a detailed study of key factors influencing the growth of the market, along with profiling the key players in the market and their core competencies.
The years considered for the study are as follows:
|
Report Metric |
Details |
|
Base year considered |
2016 |
|
Estimated Year |
2017 |
|
Projected Year |
2022 |
|
Forecast Period |
2017 - 2022 |
Research Methodology
This report includes estimations of market sizes for value (USD million) with the base year as 2016 and forecast period from 2017 to 2022. Top-down and bottom-up approaches have been used to estimate and validate the size of the silage additives market and to estimate the size of various other dependent submarkets. Key players in the market have been identified through secondary sources such as the Agriculture and Horticulture Development Board (AHDB), the US Department of Agriculture (USDA), and the Food and Agriculture Organization (FAO), and their market share in respective regions have been determined through primary and secondary research. All percentage shares, splits, and breakdowns have been determined using secondary sources and were verified through primary sources.
To know about the assumptions considered for the study, download the pdf brochure
Market Ecosystem
The market ecosystem includes key manufacturers and service providers in this report such as Volac (UK), Trouw Nutrition (Netherlands), Schaumann BioEnergy (Germany), ADDCON (Germany), Chr. Hansen (Denmark), BASF (Germany), Lallemand (US), DuPont Pioneer (US), Micron Bio-Systems (US), Biomin (Germany), American Farm Products (US), and Josera (Germany).
Target Audience
The stakeholders for the report include the following:
- Silage manufacturers
- Silage additive manufacturers
- Silage additive importers and exporters
- Silage traders/distributors/suppliers
- Cattle farms and associations
- Inoculants and chemical traders/distributors/suppliers
- Government regulatory authorities and research organizations
- Organic certification agencies
- Crop producers and exporters
- Raw material suppliers and technology providers to manufacturers
“The study answers several questions for stakeholders, primarily which market segments to focus on in the next two to five years for prioritizing efforts and investments.”
Scope of the silage additives market report
The silage additives market has been segmented as follows:
On the basis of Type, the market is segmented as follows:
- Inoculants (homofermentative, heterofermentative, and combination products)
- Organic acids
- Sugars
- Enzymes
- NPN nutrients
- Other additives (absorbents and mineral acids)
On the basis of Silage Crop, the market is segmented as follows
- Corn
- Alfalfa
- Sorghum
- Oats
- Barley
- Rye
- Other crops (legumes, wheat, clovers, and other forage grasses)
On the basis of Function, the market is segmented as follows:
- Stimulation
- Inhibition
- Other functions (nutritive value addition, moisture absorption, and prevention of effluent loss)
On the basis of Form, the market is segmented as follows:
- Dry
- Liquid
On the basis of Region, the silage additives market is segmented as follows:
- North America
- Europe
- Asia Pacific
- South America
- RoW (South Africa and Others in RoW)
Available Customizations
With the given market data, MarketsandMarkets offers customizations according to the company’s specific scientific needs.
The following customization options are available for the report:
Product Analysis
- Product Matrix, which gives a detailed comparison of the product portfolio of each company
Geographic Analysis
- Further breakdown of the Rest of Europe market for silage additives into Poland, Denmark, and the UK.
- Further breakdown of the Rest of Asia Pacific market for silage additives into Indonesia, the Philippines, Pakistan, Thailand, and South Korea.
- Further breakdown of the Rest of South America market for silage additives into Chile, Venezuela, and Uruguay.
- Further breakdown of other countries in the RoW market for silage additives into the Middle Eastern and African countries.
Company Information
- Detailed analysis and profiling of additional market players (up to five)
Due to the increase in production of silage across the globe, silage additives have been gaining preference for their characteristics of improving silage quality, the shelf life of silage, and enhancing the productivity of livestock.
On the basis of type, the inoculants segment is projected to grow at the highest CAGR in the market from 2017 to 2022, due to the growth in demand for homofermentative inoculants among silage farmers and the advent of combination products in the market by key manufacturers.
On the basis of silage crop, the corn segment is projected to grow at the highest CAGR during the forecast period, as crop growers prefer the efficiency of corn silage over other crops in gaining better results, abundant production of corn silage in North American and European countries, enhanced productivity, and increase in application of corn silage in biofuel industry.
On the basis of form, the liquid segment accounted for the largest market share in 2016, due to the increased preference for liquid additives owing to their ease in handling, storage, and transport. Liquid concentrates are highly preferred for application, owing to the increased use of chemical additives in developing countries.
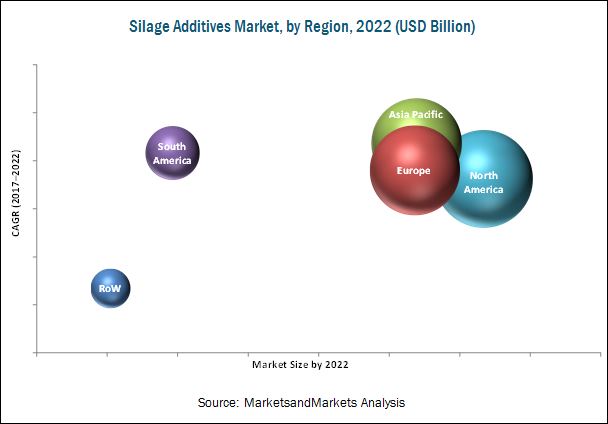
The North American region accounted for the highest adoption of silage additives in the livestock industry in 2016, owing to the growth in awareness and increase in the production of corn silage in the US and Canada. Asia Pacific is projected to be the fastest-growing region for the silage additives market in agricultural applications from 2017 to 2022. The significant growth of exportable commodities from the dairy sector, in order to meet the export quality standards, strengthened the market potential for local silage additive manufacturers to develop various products based on organic acids, NPN nutrients, and sugars.
The silage additives market has been evolving with various manufacturers involved in the research and development of cost-effective, productive processes to reduce the prices of the silage preparation. The popularity of silage additive products depends on the understanding of its constituents and benefits, among farmers. Owing to the awareness about the effectiveness of these specific additive types, companies extract them and provide them as ready-to-use end products in the market. The information gap caused by misplaced marketing about the concept of silage additive serves as a challenge toward the growth of the market.
To speak to our analyst for a discussion on the above findings, click Speak to Analyst
 Exclusive indicates content/data unique to MarketsandMarkets and not available with any competitors.
Table of Contents
1 Introduction (Page No. - 14)
1.1 Objectives of the Study
1.2 Market Definition
1.3 Market Scope
1.4 Periodization Considered
1.5 Currency Considered
1.6 Units
1.7 Stakeholders
2 Research Methodology (Page No. - 19)
2.1 Research Data
2.1.1 Secondary Data
2.1.2 Primary Data
2.1.2.1 Key Industry Insights
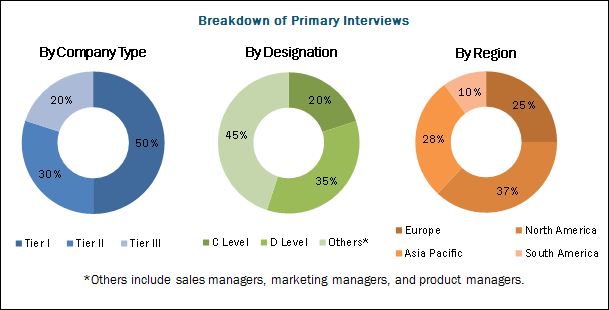
2.1.2.2 Breakdown of Primary Interviews
2.2 Market Size Estimation
2.2.1 Bottom-Up Approach
2.2.2 Top-Down Approach
2.3 Data Triangulation
2.4 Research Assumptions & Limitations
2.4.1 Assumptions
2.4.2 Limitations
3 Executive Summary (Page No. - 26)
4 Premium Insights (Page No. - 32)
4.1 Attractive Opportunities in the Global Market
4.2 North America Silage Additives Market, By Country & Function
4.3 Market, By Silage Crop
4.4 Market: Key Countries
5 Market Overview (Page No. - 36)
5.1 Introduction
5.2 Macro indicators
5.2.1 Increase in Silage Production
5.2.2 Growth in the Dairy Industry
5.3 Market Dynamics
5.3.1 Drivers
5.3.1.1 Mechanization of the Livestock Industry and Livestock Feed Management Practices
5.3.1.2 Favorable Government Regulations
5.3.1.3 Improvement in Silage Quality
5.3.2 Restraints
5.3.2.1 Cost-Ineffectiveness
5.3.2.2 Ineffectiveness in Improving Low-Quality Forage
5.3.3 Opportunities
5.3.3.1 Product Innovations in Silage Additives
5.3.3.2 Growth in Adoption as A Biofuel Feedstock
5.3.4 Challenges
5.3.4.1 Silage Losses Due to Fungi and Mycotoxin
5.4 Supply Chain Analysis
6 Silage Additives Market, By Type (Page No. - 44)
6.1 Introduction
6.2 Inoculants
6.3 Organic Acids
6.4 Sugars
6.5 Npn Nutrients
6.6 Enzymes
6.7 Others
7 Silage Additives Market, By Silage Crop (Page No. - 54)
7.1 Introduction
7.2 Corn
7.3 Alfalfa
7.4 Sorghum
7.5 Oats
7.6 Barley
7.7 Rye
7.8 Other Crops
8 Silage Additives Market, By Function (Page No. - 63)
8.1 Introduction
8.2 Stimulation Treatment
8.3 Inhibition Treatment
8.4 Other Treatment
9 Silage Additives Market, By Form (Page No. - 69)
9.1 Introduction
9.2 Liquid
9.3 Dry
10 Silage Additives Market, By Region (Page No. - 73)
10.1 Introduction
10.2 North America
10.2.1 US
10.2.2 Canada
10.2.3 Mexico
10.3 Europe
10.3.1 Netherlands
10.3.2 Italy
10.3.3 France
10.3.4 Germany
10.3.5 Russia
10.3.6 Rest of Europe
10.4 Asia Pacific
10.4.1 China
10.4.2 Australia & New Zealand
10.4.3 India
10.4.4 Japan
10.4.5 Rest of Asia Pacific
10.5 South America
10.5.1 Argentina
10.5.2 Brazil
10.5.3 Rest of South America
10.6 Rest of the World (RoW)
10.6.1 South Africa
10.6.2 Others in RoW
11 Competitive Landscape (Page No. - 117)
11.1 Overview
11.2 Market Ranking, By Key Player
11.3 Competitive Situation and Trends
11.3.1 Mergers & Acquisitions
11.3.2 Expansions
11.3.3 Joint Ventures
12 Company Profiles (Page No. - 120)
(Business Overview, Products Offered, Recent Developments, SWOT Analysis & MnM View)*
12.1 Lallemand
12.2 Dupont, Pioneer
12.3 Schaumann Bioenergy
12.4 Chr. Hansen
12.5 BASF
12.6 Nutreco
12.7 Micron Bio-Systems
12.8 Volac
12.9 Addcon
12.10 American Farm Products
12.11 Josera
*Details on Business Overview, Products Offered, Recent Developments, SWOT Analysis & MnM View Might Not Be Captured in Case of Unlisted Companies.
13 Appendix (Page No. - 141)
13.1 Discussion Guide
13.2 Knowledge Store: Marketsandmarkets’ Subscription Portal
13.3 Introducing RT: Real-Time Market Intelligence
13.4 Available Customizations
13.5 Related Reports
13.6 Author Details
List of Tables (100 Tables)
Table 1 USD Exchange Rate, 2014-2017
Table 2 Comparison of Physiological Characteristics Between Silage Treated With and Without Additive
Table 3 Silage Additives Market Size, By Type, 2015–2022 (USD Million)
Table 4 Market Size, By Type, 2015–2022 (KT)
Table 5 Inoculants Market Size, By Subtype, 2015–2022 (USD Million)
Table 6 Inoculants Market Size, By Region, 2015–2022 (USD Million)
Table 7 Homofermentative Inoculants Market Size, By Region, 2015–2022 (USD Million)
Table 8 Heterofermentative Inoculants Market Size, By Region, 2015–2022 (USD Million)
Table 9 Combination Products Market Size, By Region, 2015–2022 (USD Million)
Table 10 Organic Acids Market Size, By Region, 2015–2022 (USD Million)
Table 11 Sugars Market Size, By Region, 2015–2022 (USD Million)
Table 12 Npn Nutrients Market Size, By Region, 2015–2022 (USD Million)
Table 13 Enzymes Market Size, By Region, 2015–2022 (USD Million)
Table 14 Other Silage Additives Market Size, By Region, 2015–2022 (USD Million)
Table 15 Market Size for Silage Additives, By Silage Crop, 2015–2022 (USD Million)
Table 16 Europe: Corn Silage Area, By Key Country, 2006–2011 (‘000 Hectare)
Table 17 Market Size for Corn Silage Additives, By Region, 2015–2022 (USD Million)
Table 18 Alfalfa Silage Additives Market Size, By Region, 2015–2022 (USD Million)
Table 19 US: Acreage and Productivity of Sorghum Silage, 2007–2016
Table 20 Sorghum Silage Additives Market Size, By Region, 2015–2022 (USD Million)
Table 21 Oat Silage Additives Market Size, By Region, 2015–2022 (USD Million)
Table 22 Barley Silage Additives Market Size, By Region, 2015–2022 (USD Million)
Table 23 Rye Silage Additives Market Size, By Region, 2015–2022 (USD Million)
Table 24 Other Crop Silage Additives Market Size, By Region, 2015–2022 (USD Million)
Table 25 Market Size for Silage Additives, By Function, 2015–2022 (USD Million)
Table 26 Stimulation Treatment Market Size, By Region, 2015–2022 (USD Million)
Table 27 Inhibition Treatment Market Size, By Region, 2015–2022 (USD Million)
Table 28 Other Treatment Market Size, By Region, 2015–2022 (USD Million)
Table 29 Market Size for Silage Additives, By Form, 2015–2022 (USD Million)
Table 30 Liquid Silage Additives Market Size, By Region, 2015–2022 (USD Million)
Table 31 Dry Silage Additives Market Size, By Region, 2015–2022 (USD Million)
Table 32 Market Size for Silage Additives, By Region, 2015–2022 (USD Million)
Table 33 Market Size, By Region, 2015–2022 (KT)
Table 34 North America: Silage Additives Market Size, By Country, 2015–2022 (USD Million)
Table 35 North America: Market Size, By Country, 2015–2022 (KT)
Table 36 North America: Market Size, By Silage Crop, 2015–2022 (USD Million)
Table 37 North America: Market Size, By Type, 2015–2022 (USD Million)
Table 38 North America: Inoculants Market Size, By Type, 2015–2022 (USD Million)
Table 39 US: Market Size for Silage Additives, By Silage Crop, 2015–2022 (USD Million)
Table 40 US: Silage Additive Market Size, By Type, 2015–2022 (USD Million)
Table 41 Canada: Market Size for Silage Additives, By Silage Crop, 2015–2022 (USD Million)
Table 42 Canada: Silage Additive Market Size, By Type, 2015–2022 (USD Million)
Table 43 Mexico: Market Size for Silage Additives, By Silage Crop, 2015–2022 (USD Million)
Table 44 Mexico: Market Size, By Type, 2015–2022 (USD Million)
Table 45 Europe: Silage Additives Market Size, By Country, 2015–2022 (USD Million)
Table 46 Europe: Market Size, By Country, 2015–2022 (KT)
Table 47 Europe: Market Size, By Silage Crop, 2015–2022 (USD Million)
Table 48 Europe: Market Size, By Type, 2015–2022 (USD Million)
Table 49 Europe: Inoculants Market Size, By Type, 2015–2022 (USD Million)
Table 50 Netherlands: Market Size for Silage Additives, By Silage Crop, 2015–2022 (USD Million)
Table 51 Netherlands: Market Size, By Type, 2015–2022 (KT)
Table 52 Italy: Market Size for Silage Additives, By Silage Crop, 2015–2022 (USD Million)
Table 53 Italy: Market Size, By Type, 2015–2022 (USD Million)
Table 54 France: Silage Additives Market Size, By Silage Crop, 2015–2022 (USD Million)
Table 55 France: Market Size, By Type, 2015–2022 (USD Million)
Table 56 Germany: Market Size for Silage Additives, By Silage Crop, 2015–2022 (USD Million)
Table 57 Germany: Market Size, By Type, 2015–2022 (USD Million)
Table 58 Russia: Market Size for Silage Additives, By Silage Crop, 2015–2022 (USD Million)
Table 59 Russia: Market Size, By Type, 2015–2022 (USD Million)
Table 60 Rest of Europe: Market Size for Silage Additives, By Silage Crop, 2015–2022 (USD Million)
Table 61 Rest of Europe: Market Size, By Type, 2015–2022 (USD Million)
Table 62 Asia Pacific: Silage Additives Market Size, By Country, 2015–2022 (USD Million)
Table 63 Asia Pacific: Market Size, By Country, 2015–2022 (KT)
Table 64 Asia Pacific: Market Size, By Silage Crop, 2015–2022 (USD Million)
Table 65 Asia Pacific: Market Size, By Type, 2015–2022 (USD Million)
Table 66 Asia Pacific: Inoculants Market Size, By Type, 2015–2022 (USD Million)
Table 67 China: Market Size for Silage Additives, By Silage Crop, 2015–2022 (USD Million)
Table 68 China: Market Size, By Type, 2015–2022 (USD Million)
Table 69 Australia & New Zealand: Market Size for Silage Additives, By Silage Crop, 2015–2022 (USD Million)
Table 70 Australia & New Zealand: Market Size, By Type, 2015–2022 (USD Million)
Table 71 India: Market Size for Silage Additives, By Silage Crop, 2015–2022 (USD Million)
Table 72 India: Market Size, By Type, 2015–2022 (USD Million)
Table 73 Japan: Market Size for Silage Additives, By Silage Crop, 2015–2022 (USD Million)
Table 74 Japan: Market Size, By Type, 2015–2022 (USD Million)
Table 75 Rest of Asia Pacific: Silage Additives Market Size, By Silage Crop, 2015–2022 (USD Million)
Table 76 Rest of Asia Pacific: Market Size, By Type, 2015–2022 (USD Million)
Table 77 South America: Market Size for Silage Additives, By Country, 2015–2022 (USD Million)
Table 78 South America: Market Size, By Country, 2015–2022 (KT)
Table 79 South America: Market Size, By Silage Crop, 2015–2022 (USD Million)
Table 80 South America: Market Size, By Type, 2015–2022 (USD Million)
Table 81 South America: Inoculants Market Size, By Type, 2015–2022 (USD Million)
Table 82 Argentina: Market Size for Silage Additives, By Silage Crop, 2015–2022 (USD Million)
Table 83 Argentina: Market Size, By Type, 2015–2022 (USD Million)
Table 84 Brazil: Market Size for Silage Additives, By Silage Crop, 2015–2022 (USD Million)
Table 85 Brazil: Market Size, By Type, 2015–2022 (USD Million)
Table 86 Rest of South America: Market Size for Silage Additives, By Silage Crop, 2015–2022 (USD Million)
Table 87 Rest of South America: Market Size, By Type, 2015–2022 (USD Million)
Table 88 RoW: Market Size for Silage Additives, By Country, 2015–2022 (USD Million)
Table 89 RoW: Market Size, By Country, 2015–2022 (KT)
Table 90 RoW: Market Size, By Silage Crop, 2015-2022 (USD Million)
Table 91 RoW: Silage Additives Market Size, By Type, 2015–2022 (USD Million)
Table 92 RoW: Inoculants Market Size, By Type, 2015–2022 (USD Million)
Table 93 South Africa: Market Size for Silage Additives, By Silage Crop, 2015–2022 (USD Million)
Table 94 South Africa: Market Size, By Type, 2015–2022 (USD Million)
Table 95 Others in RoW: Market Size for Silage Additives, By Silage Crop, 2015–2022 (USD Million)
Table 96 Others in RoW: Market Size, By Type, 2015–2022 (USD Million)
Table 97 Market Ranking, By Key Player, 2017
Table 98 Mergers & Acquisitions, 2012–2017
Table 99 Expansions, 2014–2016
Table 100 Joint Ventures, 2013–2017
List of Figures (38 Figures)
Figure 1 Market Segmentation
Figure 2 Silage Additives Regional Segmentation
Figure 3 Research Design
Figure 4 Breakdown of Primary Interviews: By Company Type, Designation, and Region
Figure 5 Market Size Estimation Methodology: Bottom-Up Approach
Figure 6 Market Size Estimation Methodology: Top-Down Approach
Figure 7 Data Triangulation
Figure 8 Silage Additives Market Snapshot, 2015–2022
Figure 9 Market, By Silage Crop, 2017 vs 2022
Figure 10 Market, By Type, 2017 vs 2022
Figure 11 Market, By Form, 2017 vs 2022
Figure 12 Regional Snapshot
Figure 13 Mechanization of the Livestock Industry is Expected to Drive the Market During the Forecast Period
Figure 14 Stimulation Segment Accounted for the Largest Share in North America in 2016
Figure 15 Corn Segment to Dominate the Markets in North America and Europe, 2016
Figure 16 US and China: Important Markets for the Silage Additives Industry
Figure 17 Production of Silage in the Us, 2013–2015
Figure 18 Global Milk Production, 2013–2015
Figure 19 Silage Additives Market: Drivers, Restraints, Opportunities, and Challenges
Figure 20 Global Cattle Population, 2015–2017
Figure 21 Estimated Production Cost of Silage, 2016
Figure 22 Silage Additives Market: Supply Chain Analysis
Figure 23 Market Size, By Type, 2017 vs 2022
Figure 24 Silage Additives Market, By Silage Crop, 2017 vs 2022
Figure 25 Stimulation Segment is Projected to Dominate the Market Through 2022
Figure 26 Liquid Silage Additives is Projected to Dominate the Market Through 2022
Figure 27 Geographical Snapshot (2017–2022): Asia Pacific Markets are Emerging as New Hotspots
Figure 28 North America: Market Snapshot
Figure 29 Asia Pacific: Market Snapshot
Figure 30 Lallemand: SWOT Analysis
Figure 31 Dupont, Pioneer: Company Snapshot
Figure 32 Dupont, Pioneer: SWOT Analysis
Figure 33 Schaumann Bioenergy: SWOT Analysis
Figure 34 Chr. Hansen: Company Snapshot
Figure 35 Chr. Hansen: SWOT Analysis
Figure 36 BASF: Company Snapshot
Figure 37 BASF: SWOT Analysis
Figure 38 Nutreco: Company Snapshot


Growth opportunities and latent adjacency in Silage Additives Market