Processed Seafood & Seafood Processing Equipment Market by Type (Fish, Crustaceans, Mollusks), Equipment Type (Slaughtering, Gutting, Scaling, Filleting, Skinning, Smoking, Curing & Filling), End Product, Seafood Type, Region -Global Forecast to 2023


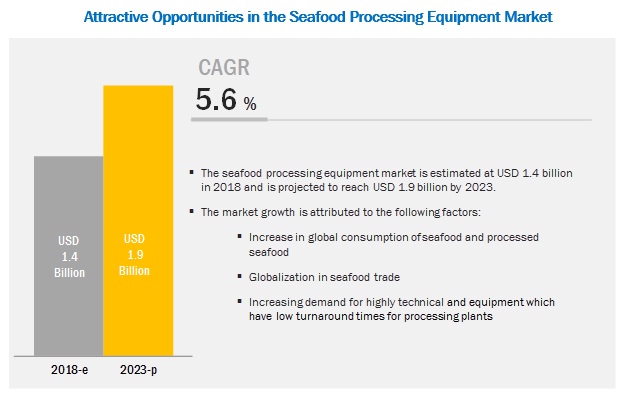
[218 Pages Report] The global seafood processing equipment market size is projected to grow from USD 1.4 billion in 2018 to USD 1.9 billion by 2023, at a CAGR of 5.6% during the forecast period. The global processed seafood market size is projected to grow from USD 207.6 billion in 2018 to USD 267.3 billion by 2023, at a CAGR of 5.2% during the forecast period. This is attributed to the increasing global consumption of processed seafood and rise in seafood trade.
By type, the fish segment is projected to be the largest revenue contributor in the processed seafood market during the forecast period.
The perishable attributes of fishes make it imperative for fisheries and harvesters to process them. The major types of processed fishes available in the market include dried, salted, fermented, and smoked. The initial phases of fish processing include washing, degutting, salting, fermentation, drying, and smoking. These processes then contribute to the development and changes in the flavor, texture, and color, and also improves its shelf life. An increase in the demand and trade of processed fish products are factors that are further projected to drive the growth of this market.
Increased demand for slaughtering equipment that does not degrade the quality of seafood products is a key factor, due to which the segment is projected to account for a larger market share during the forecast period in the seafood processing equipment market.
Of the various equipment type, the market is estimated to be dominated by the slaughtering segment in 2018. There are different types of fish slaughtering equipment available in the market, which include electric, manual, automatic, and semi-automatic. While all these equipment types have specific usages, slaughtering equipment are majorly adopted by manufacturers of processed seafood products, on the basis of the type of fish cuts required. There are four common types of fish cut, namely, round cut, contoured cut, straight cut, and slant cut. During the slaughter process, the quality of various types of seafood such as salmon degrade. In such cases, manufacturers use equipment that protects these products from deterioration in quality by using humane techniques of stunning and bleeding. Therefore, it remains imperative for manufacturers to use proper fish slaughtering equipment, to enable superior quality processed seafood products.
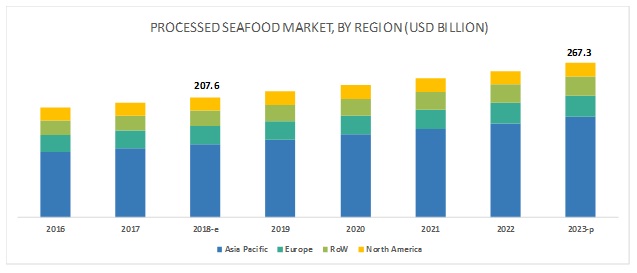
The Asia Pacific is projected to account for the largest market share during the forecast period.
The Asia Pacific market accounted for the largest share in the market for processed seafood. The seafood processing market is projected to grow, as the food processing sector is projected to witness the fastest growth in this region. The processed seafood market in the Asia Pacific region is witnessing significant growth due to the busy lifestyles of customers. Currently, the processed seafood market in the region is also undergoing a significant transformation in response to rapid urbanization and diet diversification. In addition, consumer demand for convenience and processed seafood offers profitable growth prospects and diversification in the region�s food sector. This will subsequently, drive the growth of the this market in the Asia Pacific.
Key Market Players
The major vendors in the global processed seafood market are Middleby Corporation (US), GEA Group Aktiengesellschaft (Germany), and John Bean Technologies Corporation (US). Some of the other players that hold a significant share in the market include Marel hf. (Iceland), the BAADER-Group (Germany), Uni-Food Technic A/S (Denmark), Skaginn 3X (Iceland), Arenco AB (Denmark), Zhengda Food Machinery Co. Ltd (China), and KROMA A/S (Denmark). The major vendors in the global market are Charoen Pokphand Foods Plc. (Thailand), Maruha Nichiro Corporation (Japan), and Nippon Suisan Kaisha, Ltd. (Japan). Some of the other players that hold a significant share in the market include Thai Union Frozen Products Public Company Limited (Thailand), Mowi ASA (Norway), Leroy Seafood Group ASA (Norway), Nueva Pescanova Group (Spain), High Liner Foods Inc (Canada), Royal Greenland A/S (Denmark), and Clearwater Seafoods Incorporated (Canada). These players have broad industry coverage and strong operational and financial strength; they have grown organically and inorganically in the recent past. The industry players such as Middleby Corporation (US) acquired Ve.Ma.C. Srl (Italy), a leading designer and manufacturer of food processing lines. This acquisition helped the company to integrate its existing solutions for seafood processing equipment.
Scope of the report
|
Report Metric |
Details |
|
Market size available for years |
2016-2023 |
|
Base year considered |
2017 |
|
Forecast period |
2018-2023 |
|
Forecast units |
Value (USD Billion) |
|
Segments covered |
Type, Seafood Type, Equipment Type, End-product, and Region |
|
Geographies covered |
North America, Asia Pacific, Europe, and RoW |
|
Companies covered |
Middleby Corporation (US) |
This research report categorizes the processed seafood & seafood processing equipment market based on type, seafood type, equipment type, end-product, and region.
On the basis of type, the processed seafood market has been segmented as follows:
- Fish
- Crustaceans
- Mollusks
- Others (sea urchins & turtles)
On the basis of systems, the market has been segmented as follows:
- Frozen
- Dried
- Smoked
- Canned
- Surimi
- Others (fish fillets, fish pops, fish corns, and fish fingers)
On the basis of type, the seafood processing equipment market has been segmented as follows:
- Slaughtering
- Smoking, curing & filling
- Gutting
- Scaling
- Skinning
- Filleting
- Deboning
- Others (logistical equipment, and packaging equipment)
On the basis of seafood type, the market has been segmented as follows:
- Fish
- Crustaceans
- Mollusks
- Others (sea urchins and turtles)
On the basis of region, the processed seafood & seafood processing equipment market has been segmented as follows:
- North America
- Europe
- Asia Pacific
- RoW (South America, Africa, and the Middle East)
Key questions addressed by the report:
- Who are the major market players in the processed seafood & seafood processing equipment market?
- What are the regional growth trends and the largest revenue-generating regions for processed seafood & seafood processing equipment?
- Which are the major regions that are projected to witness significant growth for processed seafood & seafood processing equipment?
- What are the key processed seafood & seafood processing equipment that are projected to generate maximum market revenue and account for a significant share during the forecast period?
- Which is the major type of seafood that is projected account for a major share, in terms of revenue, over the forecast period?
Frequently Asked Questions (FAQ):
What is the leading type in the processed seafood market?
The fish segment was the highest revenue contributor to the market, with USD 130,770.4 million in 2017, and is estimated to reach USD 180,811.6 million by 2023, with a CAGR of 5.6%.
What is the estimated industry size of processed seafood?
The global processed seafood market was valued at USD 198,372.8 million in 2017, and is projected to reach USD 267,321.6 million by 2023, registering a CAGR of 5.2% from 2018 to 2023.
What is the leading equipment type in the seafood processing market?
The slaughtering equipment segment was the highest revenue contributor to the market, with USD 276.4 million in 2017, and is estimated to reach USD 386.3 million by 2023, with a CAGR of 5.8%. .
To speak to our analyst for a discussion on the above findings, click Speak to Analyst
 Exclusive indicates content/data unique to MarketsandMarkets and not available with any competitors.
Table of Contents
1 Introduction (Page No. - 20)
1.1 Objectives of Study
1.2 Market Definition
1.3 Study Scope
1.3.1 Seafood Processing Equipment: Markets Covered
1.3.2 Processed Seafood: Markets Covered
1.3.3 Geographic Segmentation
1.4 Periodization Considered
1.5 Currency Considered
1.6 Stakeholders
2 Research Methodology (Page No. - 26)
2.1 Research Data
2.2 Secondary Data
2.2.1.Key Data From Secondary Sources
2.3 Primary Data
2.3.1.Key Data From Primary Sources
2.3.2.Breakdown of Primaries
2.4 Market Size Estimation for Seafood Processing Equipment
2.4.1 Bottom-Up Approach
2.4.2 Top-Down Approach
2.5 Market Size Estimation for Processed Seafood
2.5.1 Bottom-Up Approach
2.5.2 Top-Down Approach
2.6 Data Triangulation for Seafood Processing Equipment
2.7 Data Triangulation for Processed Seafood
2.8 Assumptions
2.9 Limitations of Study
3 Executive Summary (Page No. - 37)
4 Premium Insights (Page No. - 44)
4.1 Attractive Opportunities in the Global Market
4.2 Attractive Opportunities in the Market For Processed Seafood
4.3 Seafood Processing Equipment Market: Major Countries/Regions
4.4 Market For Processed Seafood: Major Countries/Regions
4.5 North America: Seafood Processing Equipment Market, By Type and Country
4.6 Asia Pacific: Market For Processed Seafood, By Type and Country
4.7 Seafood Processing Equipment Market, By Seafood Type, 2018 vs. 2023
4.8 Processed Seafood Market, By Type, 2018 vs. 2023
5 Market Overview (Page No. - 52)
5.1 Introduction
5.2 Market Dynamics
5.2.1 Drivers
5.2.1.1 Growth of the Aquaculture Industry
5.2.1.2 Increased Seafood Trade
5.2.1.3 Increased Consumption of Processed Seafood Products
5.2.1.4 Increased Health Consciousness Among Consumers
5.2.2 Restraints
5.2.2.1 High Capital Investment With A Low Replacement Frequency
5.2.2.2 Declining Seafood Population Due to Overfishing
5.2.3 Opportunities
5.2.3.1 Advancements in Seafood Processing Technologies
5.2.3.2 Improved Packaging Solutions Resulting in Longer Shelf Life of Processed Seafood Products
5.2.4 Challenges
5.2.4.1 Food Safety and Regulatory Compliance Requirements
5.3 Supply Chain
5.4 Value Chain
5.5 Regulatory Framework
5.5.1 International Import Systems for Fish and Seafood
5.5.2 European Union
5.5.3 US
5.5.4 Canada
5.5.5 Japan
6 Processed Seafood Market, By Type (Page No. - 69)
6.2 Fish
6.2.1 Growing Number of Innovations to Drive the Market Growth
6.3 Crustaceans
6.3.1 High Market Value Due to their Nutritional Advantages to Drive the Market Growth
6.4 Mollusks
6.4.1 Technological Advancements Used for the Decontamination of Shellfish Products is Projected to Aid Market Growth
6.5 Others
6.5.1 Low Requirement for Processing Results in A Lower Market Share for Segment
7 Processed Seafood Market, By End-Product (Page No. - 75)
7.1 Introduction
7.2 Frozen
7.2.1 Better Logistical Equipment Helps Drive the Demand for Frozen Seafood Products
7.3 Dried
7.3.1 Improving Seafood Trade Helps Drive the Market for Dried Seafood Products
7.4 Smoked
7.4.1 Increasing Preference for Seafood Diet Among Consumers is Driving the Market for Smoked Seafood Products
7.5 Canned
7.5.1 Canned Seafood Products, Being A Preferred Consumer Choice, Aids Market Growth
7.6 Surimi
7.6.1 Multiple Product Usage of Surimi is Aiding the Market Growth
7.7 Others
7.7.1 Rising Demand for Rte Processed Seafood Products is Driving the Market Growth for Segment
8 Seafood Processing Equipment Market, By Type (Page No. - 82)
8.2 Slaughtering Equipment
8.2.1 Different Types of Slaughtering Equipment Being Used in Accordance With Various Types of Seafood for Processing to Drive the Market Growth
8.3 Smoking, Curing & Filling Equipment
8.3.1 The Need for Achieving A Longer Shelf Life of Processed Sea Products is Projected to Drive The Market Growth
8.4 Gutting Equipment
8.4.1 The Adoption of Automated Gutting Equipment is Projected to Drive the Growth of Segment
8.5 Scaling Equipment
8.5.1 Ease of Operation of Automatic Equipment to Drive the Market Growth
8.6 Skinning Equipment
8.6.1 Operational Safety Associated With the Usage of Automatic Skinning Equipment to Drive the Market Growth
8.7 Filleting Equipment
8.7.1 Most Processed Seafood Products Being Offered in the Form of Fillets to Drive the Growth of This Segment
8.8 Deboning Equipment
8.8.1 Forming an Important Initiation Process for Filleting is Projected to Drive the Growth of the Deboning Segment
8.9 Others
8.9.1 Proper Packaging and Logistics Required for Processed Seafood Products to Drive the Market Growth
9 Seafood Processing Equipment Market, By Seafood Type (Page No. - 92)
9.2 Fish
9.2.1 A Wide Variety of Fish Types and their Substantial Consumption Helps to Drive the Market for their Processing Equipment
9.3 Crustaceans
9.3.1 High Market Value Due to their Rarity Results in Driving the Market for Crustaceans
9.4 Mollusks
9.4.1 Necessitating the Processing of Mollusks has Helped Drive the Market
9.5 Others
9.5.1 Stable Consumption in the Asia Pacific Region is Projected to Drive the Market for This Segment
10 Processed Seafood Market, By Region (Page No. - 98)
10.1 Introduction
10.2 Asia Pacific
10.2.1 China
10.2.1.1 Growing Seafood Imports to Drive the Market Growth
10.2.2 Japan
10.2.2.1 Increasing Imports of Seafood Products to Drive the Market
10.2.3 Thailand
10.2.3.1 Increasing Consumption of Exotic Seafood Products to Drive the Market Growth for Processed Seafood Products
10.2.4 Vietnam
10.2.4.1 Price Favorability of Seafood Products to Drive the Market Growth
10.2.5 Rest of Asia Pacific
10.2.5.1 Increased Adoption of Seafood Due to Nutritional Benefits Associated With them to Drive the Market Growth
10.3 Europe
10.3.1 Spain
10.3.1.1 The Rise in Demand for Convenience Processed Seafood Products to Drive Market Growth
10.3.2 France
10.3.2.1 Increase in Demand for Delicatessen Seafood Products to Drive the Market
10.3.3 Germany
10.3.3.1 Increase in Demand for Exotic Seafood Products to Drive the Market Growth
10.3.4 UK
10.3.4.1 Increasing Consumption of Seafood Products to Drive the Market Growth
10.3.5 Italy
10.3.5.1 Growing Awareness of the Nutritive Benefits in Seafood Products to Drive the Market Growth
10.3.6 Rest of Europe
10.3.6.1 Increased Seafood Trade to Drive the Market Growth
10.4 Rest of the World (RoW)
10.4.1 South America
10.4.1.1 Seafood Forming A Major Dietary Inclusion to Drive the Market Growth
10.4.2 Middle East & Africa
10.4.2.1 Rising Demand for Value-Added Processed Seafood Products to Drive the Market Growth
10.5 North America
10.5.1 US
10.5.1.1 The Rise in Demand for A Wide Variety of Processed Seafood Products to Drive the Market Growth
10.5.2 Canada
10.5.2.1 The Growth in Consumption of Exotic Processed Seafood Products to Drive Market Growth
10.5.3 Mexico
10.5.3.1 Inclusion of Seafood Products in Daily Diets is Projected to Drive the Market Growth
11 Seafood Processing Equipment Market, By Region (Page No. - 120)
11.1 Introduction
11.2 North America
11.2.1 US
11.2.1.1 Increasing Maturity in the Seafood Processing Equipment to Influence the Market
11.2.2 Canada
11.2.2.1 Increasing Spending on Seafood and Seafood Products Along With Rising Health Concerns to Drive the Market
11.2.3 Mexico
11.2.3.1 Growing Investment By the Seafood Processors and Growing Convenience Food Demand to Drive the Market
11.3 Europe
11.3.1 Germany
11.3.1.1 Increasing Health Awareness and the Growing Demand for Processed Seafood
11.3.2 UK
11.3.2.1 Decline in Consumption of Seafood has Influenced the Steady Growth Rate of the UK Market
11.3.3 France
11.3.3.1 Increase in Demand for Hygienically and Efficiently Processed Seafood to Drive the Market
11.3.4 Spain
11.3.4.1 The Rise in the Need for Innovative Processing With Increasing Demand for Processed Seafood to Drive the Market
11.3.5 Italy
11.3.5.1 Depreciating Expenditure By the Consumers on Fish and Seafood Products to Influence the Market
11.3.6 Rest of Europe
11.4 Asia Pacific
11.4.1 China
11.4.1.1 The Adoption of Advanced Technologies in the Processed Seafood Industry and the Growing Investment in Processing Technology to Drive the Market
11.4.2 Japan
11.4.2.1 Increasing Technical Advancements in the Seafood Processing Industry are Driving the Market
11.4.3 South Korea
11.4.3.1 The Expansion of the Seafood Processing Industry Along With the Growing Seafood Trade to Drive the Market
11.4.4 Thailand
11.4.4.1 The Increase in Seafood Trade and the Growing Demand for Convenience Food to Drive the Market
11.4.5 Rest of Asia Pacific
11.5 Rest of the World (RoW)
11.5.1 South America
11.5.1.1 Increase in Production and Consumption of Processed Seafood Products for Both Food and Feed Applications to Drive the Market
11.5.2 Africa
11.5.2.1 Growing Middle-Class Income Along With Consumer Receptiveness for Processes Seafood to Drive the Market
11.5.3 Middle East
11.5.3.1 Absence of Key Market Players and Lack of Seafood Production to Influence the Market
12 Processed Seafood: Competitive Landscape (Page No. - 149)
12.1 Introduction
12.2 Competitive Leadership Mapping
12.2.1 Visionary Leaders
12.2.2 Innovators
12.2.3 Dynamic Differentiators
12.2.4 Emerging Companies
12.3 Processed Seafood Market Share Analysis, By Key Player, 2018
12.4 Competitive Scenario
12.4.1 Acquisitions
12.4.2 Agreements
13 Processed Seafood: Company Profiles (Page No. - 154)
(Business Overview, Products Offered, Recent Developments, SWOT Analysis & MnM View)*
13.1 The Middleby Corporation
13.2 GEA Group Aktiengesellschaft
13.3 John Bean Technologies Corporation
13.4 Marel hf.
13.5 The BAADER-Group
13.6 Uni-Food Technic A/S
13.7 Skaginn 3X
13.8 Arenco AB
13.9 Zhengda Food Machinery Co.,Ltd
13.1 KROMA A/S
*Details on Business Overview, Products Offered, Recent Developments, SWOT Analysis & MnM View Might Not Be Captured in Case of Unlisted Companies.
14 Seafood Processing Equipment Market: Competitive Landscape (Page No. - 173)
14.1 Introduction
14.2 Competitive Leadership Mapping
14.2.1 Visionary Leaders
14.2.2 Innovators
14.2.3 Dynamic Differentiators
14.2.4 Emerging Companies
14.3 Seafood Processing Equipment Market Share Analysis, By Key Player, 2018
14.4 Competitive Scenario
14.4.1 Expansions & Investments
14.4.2 Acquisitions
14.4.3 New Product Launches
14.4.4 Agreements
15 Seafood Processing Equipment: Company Profiles (Page No. - 179)
(Business Overview, Products Offered, Recent Developments, SWOT Analysis & MnM View)*
15.1 Charoen Pokphand Foods Plc.
15.2 Maruha Nichiro Corporation
15.3 Nippon Suisan Kaisha, Ltd.
15.4 Thai Union Frozen Products Public Company Limited
15.5 Mowi ASA
15.6 Leroy Seafood Group ASA
15.7 Nueva Pescanova Group
15.8 High Liner Foods Inc
15.9 Royal Greenland A/S
15.10 Clearwater Seafood Incorporated
*Details on Business Overview, Products Offered, Recent Developments, SWOT Analysis & MnM View Might Not Be Captured in Case of Unlisted Companies.
16 Appendix (Page No. - 208)
16.1 Discussion Guide for Processed Seafood
16.2 Discussion Guide for Seafood Processing Equipment
16.3 Knowledge Store: Marketsandmarkets� Subscription Portal
16.4 Available Customizations
16.5 Related Reports
16.6 Author Details
List of Tables (100 Tables)
Table 1 US Dollar Exchange Rates Considered, 2013�2018
Table 2 Market Snapshot, 2018 vs. 2023
Table 3 Market For Processed Seafood Snapshot, 2018 vs. 2023
Table 4 Global Aquaculture Production, 2011�2026 (Million Tonne)
Table 5 Top Exporters and Importers of Fish & Fish Products, 2016 (USD Million)
Table 6 Comparison of Fish Import Systems in The EU, US, Japan, and Canada
Table 7 New EU Hygiene Package Regulations and Directives
Table 8 Summary of Physical Checks at Border Inspection Posts
Table 9 Regulations Applying to Fishery Products and Prepared Products
Table 10 Processed Seafood Market Size For , By Type, 2016�2023 (USD Million)
Table 11 Fish: Processed Seafood Market Size, By Region, 2016�2023 (USD Million)
Table 12 Crustaceans: Processed Seafood Market Size, By Region, 2016�2023 (USD Million)
Table 13 Mollusks: Processed Seafood Market Size, By Region, 2016�2023 (USD Million)
Table 14 Others: Processed Seafood Market Size, By Region, 2016�2023 (USD Million)
Table 15 Processed Seafood Market Size, By End-Product, 2016�2023 (USD Million)
Table 16 Frozen: Processed Seafood Market Size, By Region, 2016�2023 (USD Million)
Table 17 Dried: Processed Seafood Market Size, By Region, 2016�2023 (USD Million)
Table 18 Smoked: Processed Seafood Market Size, By Region, 2016�2023 (USD Million)
Table 19 Canned: Processed Seafood Market Size, By Region, 2016�2023 (USD Million)
Table 20 Surimi: Processed Seafood Market Size, By Region, 2016�2023 (USD Million)
Table 21 Others: Processed Seafood Market Size, By Region, 2016�2023 (USD Million)
Table 22 Seafood Processing Equipment Market Size, By Type, 2016�2023 (USD Million)
Table 23 Slaughtering Equipment: Seafood Processing Equipment Market Size, By Region, 2016�2023 (USD Million)
Table 24 Smoking, Curing & Filling Equipment: Seafood Processing Equipment Market Size, By Region, 2016�2023 (USD Million)
Table 25 Gutting Equipment: Seafood Processing Equipment Market Size, By Region, 2016�2023 (USD Million)
Table 26 Scaling Equipment: Market Size For Seafood Processing Equipment, By Region, 2016�2023 (USD Million)
Table 27 Skinning Equipment: Market Size For Seafood Processing Equipment, By Region, 2016�2023 (USD Million)
Table 28 Filleting Equipment: Market Size For Seafood Processing Equipment, By Region, 2016�2023 (USD Million) Table 29 Deboning Equipment: Market Size For Seafood Processing Equipment, By Region, 2016�2023 (USD Million)
Table 30 Others: Market Size For Seafood Processing Equipment, By Region, 2016�2023 (USD Million)
Table 31 Market Size For Seafood Processing Equipment, By Seafood Type, 2016�2023 (USD Million)
Table 32 Fish Processing Equipment Market Size, By Region, 2016�2023 (USD Million)
Table 33 Crustacean Processing Equipment Market Size, By Region, 2016�2023 (USD Million)
Table 34 Mollusks Processing Equipment Market Size, By Region, 2016�2023 (USD Million)
Table 35 Other Seafood Types Processing Equipment Market Size, By Region, 2016�2023 (USD Million)
Table 36 Processed Seafood Market Size, By Region, 2016�2023 (USD Million)
Table 37 Asia Pacific: Processed Seafood Market Size, By Country, 2016�2023 (USD Million)
Table 38 Asia Pacific: Processed Seafood Processing Market Size, By Type, 2016�2023 (USD Million)
Table 39 Asia Pacific: Processed Seafood Processing Market Size, By End-Product, 2016�2023 (USD Million)
Table 40 China: Processed Seafood Market Size, By Type, 2016�2023 (USD Million)
Table 41 Japan: Processed Seafood Market Size, By Type, 2016�2023 (USD Million)
Table 42 Thailand: Processed Seafood Market Size, By Type, 2016�2023 (USD Million)
Table 43 Vietnam: Processed Seafood Market Size, By Type, 2016�2023 (USD Million)
Table 44 Rest of Asia Pacific: Processed Seafood Market Size, By Type, 2016�2023 (USD Million)
Table 45 Europe: Processed Seafood Market Size, By Country, 2016�2023 (USD Million)
Table 46 Europe: Processed Seafood Market Size, By Type, 2016�2023 (USD Million)
Table 47 Europe: Processed Seafood Market Size, By End-Product, 2016�2023 (USD Million)
Table 48 Spain: Processed Seafood Market Size, By Type, 2016�2023 (USD Million)
Table 49 France: Processed Seafood Market Size, By Type, 2016�2023 (USD Million)
Table 50 Germany: Processed Seafood Market Size, By Type, 2016�2023 (USD Million)
Table 51 UK: Processed Seafood Market Size, By Type, 2016�2023 (USD Million)
Table 52 Italy: Processed Seafood Market Size, By Type, 2016�2023 (USD Million)
Table 53 Rest of Europe: Seafood Processing Equipment Market Size, By Type, 2016�2023 (USD Million)
Table 54 RoW: Processed Seafood Market Size, By Country, 2016�2023 (USD Million)
Table 55 RoW: Processed Seafood Market Size, By Type, 2016�2023 (USD Million)
Table 56 RoW: Processed Seafood Market Size, By End-Product, 2016�2023 (USD Million)
Table 57 South America: Processed Seafood Market Size, By Type, 2016�2023 (USD Million)
Table 58 Middle East & Africa: Processed Seafood Market Size, By Type, 2016�2023 (USD Million)
Table 59 North America: Processed Seafood Market Size, By Country, 2016�2023 (USD Million)
Table 60 North America: Processed Seafood Market Size, By Type, 2016�2023 (USD Million)
Table 61 North America: Processed Seafood Market Size, By End-Product, 2016�2023 (USD Million)
Table 62 US: Processed Seafood Market Size, By Type, 2016�2023 (USD Million)
Table 63 Canada: Processed Seafood Market Size, By Type, 2016�2023 (USD Million)
Table 64 Mexico: Processed Seafood Market Size, By Type, 2016�2023 (USD Million)
Table 65 Market Size For Seafood Processing Equipment, By Region, 2016�2023 (USD Million)
Table 66 North America: Seafood Processing Equipment Market Size, By Country, 2016�2023 (USD Million)
Table 67 North America: Market Size For Seafood Processing Equipment, By Type, 2016�2023 (USD Million)
Table 68 North America: Market Size For Seafood Processing Equipment, By Seafood Type, 2016�2023 (USD Million)
Table 69 US: Seafood Processing Equipment Market Size, By Type, 2016�2023 (USD Million)
Table 70 Canada: Market Size For Seafood Processing Equipment, By Type, 2016�2023 (USD Million)
Table 71 Mexico: Market Size For Seafood Processing Equipment, By Type, 2016�2023 (USD Million)
Table 72 Europe: Seafood Processing Equipment Market Size, By Country, 2016�2023 (USD Million)
Table 73 Europe: Market Size For Seafood Processing Equipment, By Type, 2016�2023 (USD Million)
Table 74 Europe: Market Size For Seafood Processing Equipment, By Seafood Type, 2016�2023 (USD Million)
Table 75 Germany: Seafood Processing Equipment Market Size, By Type, 2016�2023 (USD Million)
Table 76 UK: Market Size For Seafood Processing Equipment, By Type, 2016�2023 (USD Million)
Table 77 France: Market Size For Seafood Processing Equipment, By Type, 2016�2023 (USD Million)
Table 78 Spain: Market Size For Seafood Processing Equipment, By Type, 2016�2023 (USD Million)
Table 79 Italy: Market Size For Seafood Processing Equipment, By Type, 2016�2023 (USD Million)
Table 80 Rest of Europe: Market Size For Seafood Processing Equipment, By Type, 2016�2023 (USD Million)
Table 81 Asia Pacific: Seafood Processing Equipment Market Size, By Country, 2016�2023 (USD Million)
Table 82 Asia Pacific: Market Size For Seafood Processing Equipment, By Type, 2016�2023 (USD Million)
Table 83 Asia Pacific: Market Size For Seafood Processing Equipment, By Seafood Type, 2016�2023 (USD Million)
Table 84 China: Market Size For Seafood Processing Equipment, By Type, 2016�2023 (USD Million)
Table 85 Japan: Market Size For Seafood Processing Equipment, By Type, 2016�2023 (USD Million)
Table 86 South Korea: Seafood Processing Equipment Market Size, By Type, 2016�2023 (USD Million)
Table 87 Thailand: Market Size For Seafood Processing Equipment, By Type, 2016�2023 (USD Million)
Table 88 Rest of Asia Pacific: Market Size For Seafood Processing Equipment, By Type, 2016�2023 (USD Million)
Table 89 RoW: Seafood Processing Equipment Market Size, By Region, 2016�2023 (USD Million)
Table 90 RoW: Market Size For Seafood Processing Equipment, By Type, 2016�2023 (USD Million)
Table 91 RoW: Market Size For Seafood Processing Equipment, By Seafood Type, 2016�2023 (USD Million)
Table 92 South America: Market Size For Seafood Processing Equipment, By Type, 2016�2023 (USD Million)
Table 93 Africa: Market Size For Seafood Processing Equipment, By Type, 2016�2023 (USD Million)
Table 94 Middle East: Market Size For Seafood Processing Equipment, By Type, 2016�2023 (USD Million)
Table 95 Acquisitions, 2014�2018
Table 96 Agreements, 2015�2017
Table 97 Expansions & Investments, 2016�2018
Table 98 Acquisitions 2017�2018
Table 99 New Product Launches, 2016�2018
Table 100 Agreements, 2017�2018
List of Figures (54 Figures)
Figure 1 Market Snapshot
Figure 2 Processed Seafood Market Snapshot
Figure 3 Market For Seafood Processing Equipment, By Region
Figure 4 Processed Seafood Market, By Region
Figure 5 Research Design
Figure 6 Seafood Processing Equipment Market: Bottom-Up Approach
Figure 7 Market For Seafood Processing Equipment: Top-Down Approach
Figure 8 Processed Seafood Market: Bottom-Up Approach
Figure 9 Processed Seafood Market: Top-Down Approach
Figure 10 Data Triangulation Methodology
Figure 11 Data Triangulation Methodology
Figure 12 Market Size For Seafood Processing Equipment, By Seafood Type, 2018 vs. 2023 (USD Million)
Figure 13 Processed Seafood Market Size, By Type, 2018 vs. 2023 (USD Million)
Figure 14 Market Size For Seafood Processing Equipment, By Type, 2018 vs. 2023 (USD Million)
Figure 15 Processed Seafood Market Size, By End-Product, 2018 vs. 2023 (USD Million)
Figure 16 Market Share, By Region, 2017
Figure 17 Processed Seafood Market Share, By Region, 2017
Figure 18 Growing Demand for Processed Seafood and Increasing Seafood Trade to Drive Market Growth During the Forecast Period
Figure 19 Growing Demand for Processed Seafood and their Increasing Consumption to Drive Market Growth During the Forecast Period
Figure 20 China is Projected to Grow at the Highest Cagr During the Forecast Period
Figure 21 China is Projected to Grow at the Highest Cagr During the Forecast Period
Figure 22 The US And The Slaughtering Equipment Markets Dominated The North American Seafood Processing Equipment Market, By Country And Type, Respectively, In 2017
Figure 23 The Chinese and Processed Fish Markets Dominated the Asia Pacific Processed Seafood Market, By Country and Type, Respectively, in 2017
Figure 26 Market Dynamics
Figure 27 Market For Seafood Processing Equipment: Supply Chain
Figure 28 Processed Seafood Market: Value Chain
Figure 29 Processed Seafood Market Share, By Type, 2018 vs. 2023
Figure 30 Processed Seafood Market Share, By End-Product, 2018 vs. 2023
Figure 31 Seafood Processing Equipment Market Share, By Type, 2018 vs. 2023
Figure 32 Market Share, By Seafood Type, 2018 vs. 2023
Figure 33 China Held the Largest Share in the Processed Seafood Market in 2017
Figure 34 Asia Pacific: Processed Seafood Market 2017
Figure 35 the US Held the Largest Share in the Seafood Processing Equipment Market in 2017
Figure 36 North America: Market For Seafood Processing Equipment
Figure 37 Asia Pacific: Market For Seafood Processing Equipment
Figure 38 Processed Seafood Market: Competitive Leadership Mapping, 2018
Figure 39 Top Five Players Led the Processed Seafood Market, 2018
Figure 40 The Middleby Corporation: Company Snapshot
Figure 41 GEA Group Aktiengesellschaft: Company Snapshot
Figure 42 John Bean Technologies Corporation: Company Snapshot
Figure 43 Marel hf.: Company Snapshot
Figure 44 Market For Seafood Processing Equipment: Competitive Leadership Mapping, 2018
Figure 45 Top Five Players Led the Market For Seafood Processing Equipment, 2018
Figure 46 Charoen Pokphand Foods Pcl.: Company Snapshot
Figure 47 Maruha Nichiro Corporation: Company Snapshot
Figure 50 Mowi ASA: Company Snapshot
Figure 51 Leroy Seafood Group ASA: Company Snapshot
Figure 52 High Liner Foods Inc: Company Snapshot
Figure 53 Royal Greenland A/S: Company Snapshot
Figure 54 Clearwater Seafoods Incorporated: Company Snapshot
The study involved three major activities for estimating the current market size of the processed seafood & seafood processing equipment market. Exhaustive secondary research was done to collect information on the market as well as the peer and parent markets. The next step was to validate these findings, assumptions, and sizing with industry experts across the value chain through primary research. Both the top-down and bottom-up approaches were employed to estimate the complete market size. Thereafter, the market breakdown and data triangulation were used to estimate the market size of segments and subsegments.
Secondary Research
In the secondary research process, various sources such as the Food and Drug Administration (FDA), United States Department of Agriculture (USDA), Seafood Products Association (SPA), European Food Safety Authority (EFSA), Food Processing Suppliers Association (FPSA), and Food Standards Australia New Zealand (FSANZ) were referred to, to identify and collect information for this study. The secondary sources also included annual reports, press releases, investor presentations of companies, white papers, certified publications, articles by recognized authors, regulatory bodies, trade directories, and paid databases.
Secondary research was mainly used to obtain the key information about the industry�s supply chain, the total pool of key players, market classification & segmentation according to the industry trends, to the bottom-most level, and geographical markets. It was also used to obtain information about the key developments from a market-oriented perspective.
Primary Research
The global market includes several stakeholders in the supply chain, such as suppliers, manufacturers, end consumers, and retailers of processed seafood & seafood processing equipment. The demand side of the market is characterized by the presence of key processed seafood manufacturers and government agencies. The supply side is characterized by the presence of key technology providers for seafood processing, researchers, and equipment and instrument manufacturers. Various primary sources from both the supply and demand sides of both (seafood processing equipment and processed seafood) markets were interviewed to obtain qualitative and quantitative information.
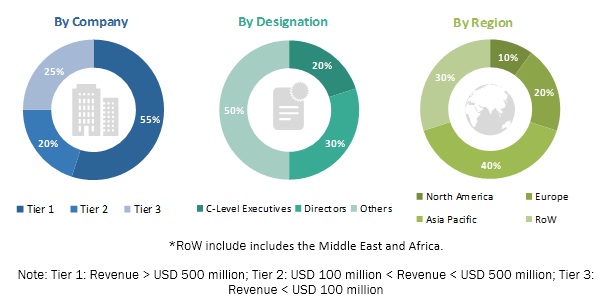
The primary interviewees from the demand side include key opinion leaders, executives, vice presidents, and CEOs of the seafood processing industry. The primary sources from the supply side include research institutions involved in R&D to introduce new seafood processing equipment, key opinion leaders, distributors, and manufacturers of processed seafood products.
To know about the assumptions considered for the study, download the pdf brochure
Market Size Estimation
Both top-down and bottom-up approaches were used to estimate and validate the total size of the processed seafood & seafood processing equipment market. These approaches were also used extensively to determine the size of the various subsegments in the market. The research methodology used to estimate the market size includes the following details:
- The key players were identified through extensive secondary research.
- The processed seafood & seafood processing equipment market size was determined through primary and secondary research.
- All percentage shares, splits, and breakdowns were determined using secondary sources and verified through primary sources.
- All macroeconomic and microeconomic factors affecting the growth of the processed seafood & seafood processing equipment market were considered while estimating the market size.
- All the possible parameters that affect the market covered in this research study were accounted for, viewed in extensive detail, verified through primary research, and analyzed to obtain the final quantitative and qualitative data.
The following sections (bottom-up & top-down) depict the overall market size estimation process employed for the purpose of this study.
Data Triangulation
After arriving at the overall market sizes-using the market size estimation processes as explained above-the market was split into several segments and subsegments. In order to complete the overall market engineering process and arrive at the exact statistics of each market segment and its subsegments, the data triangulation and market breakdown procedures were employed, wherever applicable. The data was triangulated by studying various factors and trends from both the demand and supply sides of the processed seafood and seafood processing equipment market. The market size was validated using the top-down and bottom-up approaches.
Report Objectives
Market Intelligence
- Determining and projecting the size of the processed seafood and seafood processing equipment market in terms of type, equipment type, seafood type, end-product, and regional markets, over a five-year period ranging from 2018 to 2023
- Identifying attractive opportunities in the market by determining the largest and fastest-growing segments across regions
- Providing detailed information about the key factors influencing the growth of the market (drivers, restraints, opportunities, and industry-specific challenges)
- Analyzing micromarkets with respect to individual growth trends, future prospects, and their contribution to the total market
Competitive Intelligence
- Identifying and profiling key market players in the processed seafood & seafood processing equipment market
- Providing a comparative analysis of the market leaders on the basis of the following:
- Product offerings
- Business strategies
- Strengths and weaknesses
- Key financials
- Understanding the competitive landscape and identifying major growth strategies adopted by players across the key regions
- Analyzing the supply chain, products, and regulatory frameworks across regions and their impact on the prominent market players
- Providing insights on key innovations and investments in the processed seafood & seafood processing equipment market
Available Customizations
With the given market data, MarketsandMarkets offers customizations according to company-specific needs.
The following customization options are available for the report:
Product Analysis
- Product matrix, which gives a detailed comparison of the product portfolio of each company
Regional Analysis
- Further breakdown of the Rest of Europe processed seafood and seafood processing equipment market, by key country (Greece, Denmark, Finland, Portugal, Poland and other EU and non-EU countries)
- Further breakdown of the Rest of Asia Pacific processed seafood and seafood processing equipment market, by key country (Vietnam, India, Australia, Singapore, the Philippines, Malaysia, and South Korea)
Segmental Analysis
- Market segmentation analysis of end-product for fish fillets, fish pops, fish corns, and fish fingers
Company Information
- Detailed analysis and profiling of additional market players (up to five)


Growth opportunities and latent adjacency in Processed Seafood & Seafood Processing Equipment Market