RPA (Robotic Process Automation) Market by Process (Automated solution, Decision Support & Management Solution, and Interaction Solution), Operation (Rule Based and Knowledge Based), Type (Tools and Services), Industry, and Geography


Updated on : May 11, 2023
The RPA (Robotic Process Automation) Market is estimated to be 2,467.0 million in 2022 and is projected to grow at a CAGR of 30.14% between 2023 to 2028.
Robotic process automation is the application of technology to configure computer software or a robot to capture and interpret existing applications for rule-based processing of transactions, manipulate data, trigger responses, and communicate with other digital systems. Robotic process automation deals with the application of smart software to carry out high-volume and repetitive tasks that usually take a lot of time for humans to accomplish, and which are typically monotonous to perform of robotic process automation industry.
Banking and Finance: Automating Tedious Tasks for Efficiency
In the banking and finance sector, Robotic Process Automation has emerged as a key enabler for enhancing operational efficiency and accuracy. Financial institutions are utilizing RPA to automate manual tasks such as data entry, customer onboarding, loan processing, and compliance reporting. By doing so, they are able to minimize errors, improve turnaround times, and reallocate human resources to more strategic activities.
Healthcare: Streamlining Processes for Enhanced Patient Care
The healthcare industry is also witnessing the transformative impact of Robotic Process Automation. RPA is being leveraged to automate administrative tasks, including appointment scheduling, medical record management, and insurance claim processing. By automating these processes, healthcare providers can focus more on patient care, reduce administrative burdens, and enhance overall operational efficiency.
Manufacturing: Optimizing Operations for Increased Productivity
Manufacturing companies are embracing RPA to optimize their operations and achieve higher productivity levels. Robotic Process Automation is utilized for tasks such as inventory management, supply chain coordination, and quality control. By automating these processes, manufacturers can minimize errors, reduce production cycle times, and ensure seamless coordination across different departments.
Retail and E-commerce: Enhancing Customer Experience
In the retail and e-commerce sectors, Robotic Process Automation is playing a pivotal role in enhancing the customer experience. RPA enables organizations to automate inventory management, order processing, and customer support functions. By streamlining these processes, retailers can provide faster order fulfillment, improve customer service, and gain a competitive edge in the market.
Key Factors Driving the Growth of Robotic Process Automation
Several factors contribute to the rapid growth and adoption of Robotic Process Automation across industries. Understanding these factors is crucial in gauging the potential and future prospects of the RPA market.
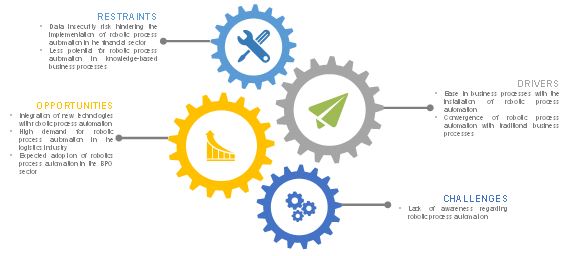
Convergence of robotic process automation (RPA) with traditional business processes
Business functions such as contact center outsourcing, banking, financial services & insurance (BFSI), business process outsourcing (BPO), procurement outsourcing, and human resources outsourcing (HRO) are currently experiencing rapid growth. Thus, there is an enormous market potential for robotic process automation across various business verticals owing to its ability to perform a variety of tasks such as account opening and closing, completing requests for quotation and proposals, IT systems testing and monitoring, and handling queries in the billing and customer service departments.
Robotic process automation is highly useful in industries such as healthcare, BPO, banking, and insurance as these industries follow defined, repeated, and rule-based processes. The adoption of robotic process automation in various business processes has increased the number of strategic partnerships between robotic process automation market tool vendors and BPO and other service providers.
The following are the major objectives of the study.
- To define, describe, forecast, and segment the robotic process automation market on the basis of type, operation, process, and industry
- To forecast the robotic process automation market size, in terms of value, of segments with respect to four main regions (along with their respective countries), namely, North America, Europe, Asia Pacific (APAC), and Rest of the World (RoW)
- To provide the RPA market statistics with detailed classifications, along with the respective market size
- To provide the impact analysis of the factors affecting the market dynamics such as drivers, restraints, opportunities, and challenges
- To analyze the competitive intelligence of players based on company profiles, key player strategies, and game-changing developments such as solution launches and acquisitions
- To strategically analyze the micromarkets1 with respect to the individual growth trends, prospects, and contribution to the total robotic process automation market
- To strategically profile the key players and comprehensively analyze their market shares along with detailing the competitive landscape for robotic process automation market leaders
- To analyze strategic developments such as joint ventures, mergers and acquisitions, new product developments, and R&D in the RPA market
The robotic process automation market is estimated to be worth USD 2,467.0 million by 2022, at a CAGR of 30.14% between 2017 and 2022. The growth of this market is mainly driven by the ease of business processes provided by the robotic process automation, and convergence of robotic process automation with traditional business process industries.
The robotic process automation market has been segmented on the basis of process, operations, type, application, industry, and region. The robotic process automation tools market held the largest market share on the back of the growing demand for tool-based robotic process automation. This is attributed to the structured data format in various organizations. Robotic process automation (RPA) tools mainly work on the Optical Character Recognition (OCR), Optical Mark Recognition (OMR), text, audio, video, and other file formats. Records of the business processes are kept using these formats, so that they are easily recognizable by robotic process automation to develop suitable business processes by reducing human effort and time.
The robotic process automation market for robotic process automation (RPA) held the largest market share owing to the growth of the banking, financial services, and insurance industry, which has been leveraging robotics process automation to improve competence and speed up business processes since 2010. Due to the high degree of flexibility and scalability of the solution, and greater requirement for data processing and workflow management, it has witnessed widespread deployment in different business environments. The availability of an automated solution that is viable for large-scale deployment in data management is a major driver for the robotic process automation growth.
Robotic process automation market in the BFSI industry held the largest market share among all the industries. In the BFSI domain, multiple systems are linked to each other by interfaces to enable the flow of transaction-related data. Robotic process automation controls and monitors these interfaces, and ensures seamless execution of transactions and fill data gaps. Robotic process automation (RPA) improves the accuracy and efficiency of different the processes in the BFSI industry. These solutions also help in regulatory reporting and balance sheet reconciliation by collating data from multiple systems and conducting a host of validation checks to prepare information for a detailed analysis.
To request to know about sample pages on the above findings, click Request Sample
Banking, Financial Services, and Insurance
In the BFSI industry, multiple systems are linked to each other by interfaces to enable the flow of transaction-related data. Robotic process automation controls and monitors these interfaces to ensure seamless execution of transactions and to fix loopholes. Robotic process automation improves the accuracy and efficiency of different processes in the BFSI industry. These solutions also help in regulatory reporting and balance sheet reconciliation by collating data from multiple systems and conducting a host of validation checks to prepare information for a detailed analysis.
Telecom and IT
The IT and telecommunication as well as media industry is increasingly adopting robotic process automation (RPA) to reduce operational costs and improve overall customer satisfaction. The benefits of robotic process automation for IT and telecommunication companies include centralization and consolidation of request management systems for enhanced efficiency, improved transparency and visibility for service functions, automation of request service-level agreement (SLA) reporting, and reduction of manual efforts. It also helps in the reduction of errors and operational costs through the automation of processes which involve provisioning and de-provisioning of physical, virtual, and cloud-based systems.
Travel, Hospitality, and Transportation
The travel, hospitality, and transportation industry is increasingly incorporating robotic process automation market to enhance field work and improve access to organizational information on a real-time basis. In the hospitality industry, robotic process automation is preferred due to its various advantages, which include automation of housekeeping services, room service delivery and maintenance, management of reservations and rates, checking guests in and out of the property, assigning rooms and managing room inventories, catering to guest requests, and handling accounting and billing requirements. These advantages offered by robotic process automation solutions are expected to contribute toward the growth of the travel, hospitality, and transportation segment of the global robotic process automation.
Critical questions the report answers:
- Where will all these developments take the industry in the mid to long term ?
- Which region is leading in RPA market ?
“To speak to our analyst for a discussion on the above findings, click the Speak to Analyst tab provided above.”
The major restraints of the robotic process automation market are risk of data security, which hinders the implementation of robotic process automation in the financial domain, and the reduced potential of robotic process automation for knowledge-based business processes.
Robotic Process Automation Market players such as Automation Anywhere (U.S.), Blue Prism (U.K.), Celaton Ltd (U.K.), IPSoft (U.S.), Nice Systems Ltd. (Israel), Pegasystems (U.S.), Redwood Software (U.S.), UiPath (U.K.), Verint (U.S.), and Xerox Corporation (U.S.), etc., are focusing on new product launches, research and development, acquisitions, and collaborations to enhance their service offerings and expand business.
Frequently Asked Questions (FAQ):
Which industries are driving the adoption of Robotic Process Automation?
Industries such as banking and finance, healthcare, manufacturing, and retail/e-commerce are leading the adoption of Robotic Process Automation.
How does Robotic Process Automation contribute to cost savings?
RPA automates repetitive and rule-based tasks, reducing the need for manual labor and resulting in cost savings for organizations.
Can RPA be integrated with existing systems and technologies?
Yes, RPA can seamlessly integrate with existing systems, including legacy systems, ERP software, and CRM platforms.
How does Robotic Process Automation enhance accuracy and compliance?
By eliminating manual intervention, RPA reduces the chances of human error and ensures adherence to predefined rules, thereby enhancing accuracy and compliance.
To speak to our analyst for a discussion on the above findings, click Speak to Analyst
 Exclusive indicates content/data unique to MarketsandMarkets and not available with any competitors.
Table of Contents
1 Introduction (Page No. - 14)
1.1 Objectives of the Study
1.2 Market Definition
1.3 Study Scope
1.3.1 Markets Covered
1.3.2 Years Considered for the Study
1.4 Currency
1.5 Limitations
1.6 Stakeholders
2 Research Methodology (Page No. - 18)
2.1 Research Data
2.1.1 Secondary Data
2.1.1.1 Key Data From Secondary Sources
2.1.2 Primary Data
2.1.2.1 Key Data From Primary Sources
2.1.2.2 Key Industry Insights
2.1.2.3 Breakdown of Primaries
2.2 Market Size Estimation
2.2.1 Bottom-Up Approach
2.2.1.1 Approach for Capturing the Market Share By Bottom-Up Analysis (Demand Side)
2.2.2 Top-Down Approach
2.2.2.1 Approach for Capturing the Market Share Top-Down Analysis (Supply Side)
2.3 Market Breakdown and Data Triangulation
2.4 Research Assumptions
3 Executive Summary (Page No. - 27)
4 Premium Insights – Robotic Process Automation Market (Page No. - 31)
4.1 RPA Market, 2017–2022 (USD Million)
4.2 Market, By Type (2017–2022)
4.3 Market, By Process (2017)
4.4 Market, By Industry and Region (2017)
4.5 Market, By Geography (2017)
5 Market Overview (Page No. - 34)
5.1 Introduction
5.2 Robotic Process Automation Market Segmentation
5.2.1 Market, By Type
5.2.2 Market, By Operation
5.2.3 Market, By Process
5.2.4 Market, By Industry
5.3 Market Dynamics
5.3.1 Drivers
5.3.1.1 Ease in Business Processes With the Installation of Market
5.3.1.2 Convergence of Robotic Process Automation With Traditional Business Processes
5.3.2 Restraints
5.3.2.1 Data Insecurity Risk Hindering the Implementation of Market in the Financial Sector
5.3.2.2 Less Potential for Robotic Process Automation in Knowledge-Based Business Processes
5.3.3 Opportunities
5.3.3.1 Integration of New Technologies With Market
5.3.3.2 High Demand for Robotic Process Automation in the Logistics Industry
5.3.3.3 Expected Adoption of Robotics Process Automation in the Bpo Sector
5.3.4 Challenges
5.3.4.1 Lack of Awareness Regarding Robotic Process Automation
6 Industry Trends (Page No. - 42)
6.1 Introduction
6.2 Value Chain Analysis
6.3 Porter’s Five Forces Model
6.3.1 Threat of New Entrants
6.3.2 Threat of Substitutes
6.3.3 Bargaining Power of Suppliers
6.3.4 Bargaining Power of Buyers
6.3.5 Intensity of Competitive Rivalry
7 Robotic Process Automation Market Analysis, By Process (Page No. - 49)
7.1 Introduction
7.2 Automated Solution
7.3 Decision Support and Management Solution
7.4 Interaction Solution
8 Market Analysis, By Operation (Page No. - 55)
8.1 Introduction
8.2 Rule Based
8.3 Knowledge Based
9 Robotic Process Automation Market, By Type (Page No. - 58)
9.1 Introduction
9.2 Tool Based
9.2.1 Model-Based Application Tools
9.2.2 Process-Based Application Tools
9.3 Service Based
9.3.1 Consulting
9.3.2 Integration and Development
9.3.3 Training
10 RPA Market, By Industry (Page No. - 76)
10.1 Introduction
10.2 Banking, Financial Services, and Insurance
10.3 Telecom and IT Industry
10.4 Travel, Hospitality, and Transportation Industry
10.5 Retail and Consumer Goods
10.6 Manufacturing and Logistics Industry
10.7 Healthcare and Pharmaceuticals
10.8 Other Industries
11 Robotic Process Automation Market, Geographic Analysis (Page No. - 93)
11.1 Introduction
11.2 North America
11.2.1 U.S.
11.2.2 Canada
11.2.3 Mexico
11.3 Europe
11.3.1 Germany
11.3.2 U.K.
11.3.3 France
11.3.4 Rest of Europe
11.4 Asia Pacific
11.4.1 China
11.4.2 Japan
11.4.3 India
11.4.4 Rest of Asia Pacific
11.5 Rest of World
11.5.1 Middle East and Africa
11.5.2 South America
12 Competitive Landscape (Page No. - 110)
12.1 Overview
12.2 Market Ranking Analysis of Robotics Process Automation Market
12.3 Competitive Situations and Trends
12.3.1 New Product Developments
12.3.2 Partnerships and Agreements/ Collaborations
12.3.3 Mergers & Acquisitions
13 Company Profiles (Page No. - 117)
13.1 Introduction
(Business Overview, Products & Services, Key Insights, Recent Developments, SWOT Analysis, Ratio Analysis, MnM View)*
13.2 Nice Systems Ltd.
13.3 Pegasystems Inc.
13.4 Automation Anywhere
13.5 Blue Prism PLC
13.6 Ipsoft, Inc.
13.7 Celaton Ltd.
13.8 Redwood Software
13.9 Uipath SRL
13.10 Verint System Inc.
13.11 Xerox Corporation
13.12 Key Innovators
13.12.1 Arago Us, Inc.
13.12.2 IBM
13.12.3 Thoughtonomy Ltd.
*Details on Business Overview, Products & Services, Key Insights, Recent Developments, SWOT Analysis, MnM View Might Not Be Captured in Case of Unlisted Companies.
14 Appendix (Page No. - 139)
14.1 Insights of Industry Experts
14.2 Discussion Guide
14.3 Introducing RT: Real-Time Market Intelligence
14.4 Available Customizations
14.5 Related Reports
14.6 Author Details
List of Tables (69 Tables)
Table 1 Robotic Process Automation Market, By Type
Table 2 RPA Market, By Operation
Table 3 Market, By Process
Table 4 Market, By Industry
Table 5 RPA Market, By Process, 2014–2022 (USD Million)
Table 6 Automated Solution for RPA Market, By Industry, 2014–2022 (USD Million)
Table 7 Decision Support and Management for Market, By Industry, 2014–2022 (USD Million)
Table 8 Interaction Solution for Market, By Industry, 2014–2022 (USD Million)
Table 9 Market, By Operation, 2014–2022 (USD Million)
Table 10 Market, By Type, 2014–2022 (USD Million)
Table 11 Market, By Tool, 2014–2022 (USD Million)
Table 12 Robotic Process Automation Tool Market, By Industry, 2014–2022 (USD Million)
Table 13 Robotic Process Automation Tools Market, By Region, 2014–2022 (USD Million)
Table 14 Robotic Process Automation Tools Market for BFSI, By Region, 2014–2022 (USD Million)
Table 15 Robotic Process Automation Tools Market for Telecom and IT, By Region, 2014–2022 (USD Million)
Table 16 Robotic Process Automation Tools Market for Travel, Hospitality, and Transportation, By Region, 2014–2022 (USD Million)
Table 17 Robotic Process Automation Tools Market for Retail and Consumer Goods, By Region, 2014–2022 (USD Million)
Table 18 Robotic Process Automation Tools Market for Manufacturing and Logistics, By Region, 2014–2022 (USD Million)
Table 19 Robotic Process Automation Tools Market for Healthcare and Pharmaceutical, By Region, 2014–2022 (USD Million)
Table 20 Robotic Process Automation Tools Market for the Other Industries, By Region, 2014–2022 (USD Million)
Table 21 Market, By Services, 2014–2022 (USD Million)
Table 22 Market Services Market, By Industry, 2014–2022 (USD Million)
Table 23 RPA Services Market, By Region, 2014–2022 (USD Million)
Table 24 RPA Services Market for BFSI, By Region, 2014–2022 (USD Million)
Table 25 RPA Services Market for Telecom and IT, By Region, 2014–2022 (USD Million)
Table 26 Robotic Process Automation Services Market for Travel, Hospitality, and Transportation, By Region, 2014–2022 (USD Million)
Table 27 RPA Services Market for Retail and Consumer Goods, By Region, 2014–2022 (USD Million)
Table 28 RPA Services Market for Manufacturing and Logistics, By Region, 2014–2022 (USD Million)
Table 29 RPA Services Market for Healthcare and Pharmaceutical, By Region, 2014–2022 (USD Million)
Table 30 Robotic Process Automation Services Market for the Other Industries, By Region, 2014–2022 (USD Million)
Table 31 Market, By Industry, 2014–2022 (USD Million)
Table 32 RPA Market for the BFSI, By Process, 2014–2022 (USD Million)
Table 33 RPA Market for BFSI, By Region, 2014–2022 (USD Million)
Table 34 Market for BFSI, By Type, 2014–2022 (USD Million)
Table 35 Market for the Telecom and IT Industry, By Process, 2014–2022 (USD Million)
Table 36 Market for Telecom and IT Industry, By Region, 2014–2022 (USD Million)
Table 37 Market for Telecom and IT Industry, By Type, 2014–2022 (USD Million)
Table 38 Market for the Travel, Hospitality, and Transportation Industry, By Process, 2014–2022 (USD Million)
Table 39 Market for Travel, Hospitality, and Transportation Industry, By Region, 2014–2022 (USD Million)
Table 40 Market for Travel, Hospitality, and Transportation, By Type, 2014–2022 (USD Million)
Table 41 Market for the Retail and Consumer Goods Industry, By Process, 2014–2022 (USD Million)
Table 42 Market for Retail and Consumer Goods Industry, By Region, 2014–2022 (USD Million)
Table 43 Market for Retail and Consumer Goods Industry, By Type, 2014–2022 (USD Million)
Table 44 RPA Market for the Manufacturing and Logistics Industry, By Process, 2014–2022 (USD Million)
Table 45 RPA Market for Manufacturing and Logistics Industry, By Region, 2014–2022 (USD Million)
Table 46 RPA Market for Manufacturing and Logistics Industry, By Type, 2014–2022 (USD Million)
Table 47 Market for the Healthcare and Pharmaceuticals Industry, By Process, 2014–2022 (USD Million)
Table 48 Market for Healthcare and Pharmaceuticals Industry, By Region, 2014–2022 (USD Million)
Table 49 Market for Healthcare and Pharmaceuticals Industry, By Type, 2014–2022 (USD Million)
Table 50 Market for Other Industries, By Process, 2014–2022 (USD Million)
Table 51 Market for Other Industries, By Region, 2014–2022 (USD Million)
Table 52 Market for Other Industries, By Type, 2014–2022 (USD Million)
Table 53 RPA Market, By Region, 2014–2022 (USD Million)
Table 54 Market in North America, By Country, 2014–2022 (USD Million)
Table 55 RPA Market in North America, By Industry, 2014–2022 (USD Million)
Table 56 Market in North America, By Type, 2014–2022 (USD Million)
Table 57 Market in Europe, By Country, 2014–2022 (USD Million)
Table 58 Market in Europe, By Industry, 2014–2022 (USD Million)
Table 59 Market in Europe, By Type, 2014–2022 (USD Million)
Table 60 RPA Market in Asia Pacific, By Country, 2014–2022 (USD Million)
Table 61 Market in Asia Pacific, By Industry, 2014–2022 (USD Million)
Table 62 Market in Asia Pacific, By Type, 2014–2022 (USD Million)
Table 63 Market in RoW, By Region, 2014–2022 (USD Million)
Table 64 Market in RoW, By Industry, 2014–2022 (USD Million)
Table 65 Market in RoW, By Type, 2014–2022 (USD Million)
Table 66 Top Players in the Robotics Process Automation Market, 2016
Table 67 New Product Developments, 2015–2016
Table 68 Partnerships, Agreements, and Collaborations (2014–2016)
Table 69 Mergers & Acquisitions (2014–2016)
List of Figures (66 Figures)
Figure 1 Markets Covered in the RPA Market Report
Figure 2 Research Design
Figure 3 Market Size Estimation Methodology: Bottom Up Approach
Figure 4 Market Size Estimation Methodology: Top-Down Approach
Figure 5 RPA Market Breakdown Data Triangulation Approach
Figure 6 Assumptions of the Research Study
Figure 7 Robotic Process Automation Tools are Expected to Hold A Major Share of the Market During the Forecast Period
Figure 8 Rule-Based Operation Expected to Hold A Major Share of the Market During the Forecast Period
Figure 9 RPA Market for Automated Solution Expected to Grow at the Highest Rate During the Forecast Period
Figure 10 BFSI Industry to Hold the Largest Size of the Market During the Forecast Period
Figure 11 RPA Market, By Geography, 2017
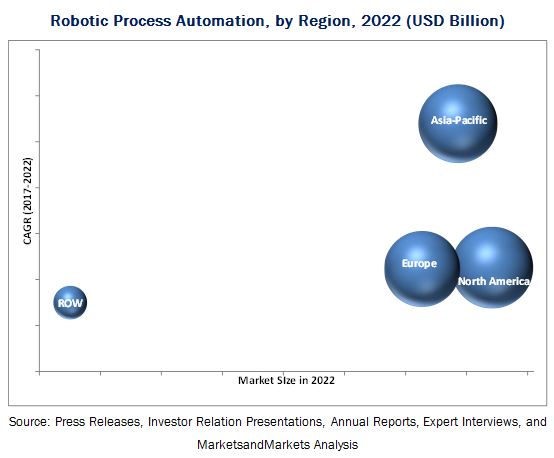
Figure 12 Attractive Growth Opportunities in the Market (2017–2022)
Figure 13 RPA Service Market Expected to Grow at A High CAGR Between 2017 and 2022
Figure 14 Automated Solution Process Expected to Lead the Market in 2017
Figure 15 BFSI Industry Expected to Hold the Largest Share of the Market in 2017
Figure 16 The U.S. to Hold the Largest Share of the Market in 2017
Figure 17 Robotic Process Automation Market, By Geography
Figure 18 Drivers, Restraints, Opportunities, and Challenges in the Market
Figure 19 Value Chain Analysis: Major Value Addition Done During the Manufacturing and Assembly Phase
Figure 20 Porter’s Five Forces Analysis - 2016
Figure 21 Impact Analysis: Market
Figure 22 R&D Expenses to Highly Impact the Threat of New Entrants
Figure 23 Substitute Quality Plays A Major Role in Threat of Substitutes
Figure 24 Switching Costs to Impact the Bargaining Power of Suppliers
Figure 25 Medium Impact of Bargaining Power of Buyers on the Market
Figure 26 High Impact of Intensity of Competitive Rivalry on the RPA Market
Figure 27 Automated Solution Expected to Hold the Largest Size of the Robotic Process Automation Process Market By 2022
Figure 28 Automated Solution for BFSI Expected to Hold the Largest Size of the Market By 2022
Figure 29 Decision Support and Management Solution for Healthcare and Pharmaceuticals Industry Expected to Grow at the Highest Rate Between 2017 and 2022
Figure 30 Interaction Solution for Telecom & IT Industry Expected to Hold the Largest Size of the RPA Market By 2022
Figure 31 Rule-Based Operation Expected to Hold the Largest Size of the Market By 2022
Figure 32 Tool-Based Robotic Process Automation Likely to Hold the Largest Market Size By 2022
Figure 33 Tool-Based Robotic Process Automation for BFSI is Expected to Hold the Largest Market Size By 2022
Figure 34 Robotic Process Automation Tools for BFSI in North America is Expected to Hold the Largest Market Size By 2022
Figure 35 RPA Tools for Travel, Hospitality, and Transportation in Europe is Expected to Hold the Largest Market Size By 2022
Figure 36 Robotic Process Automation Tools for Manufacturing and Logistics in Europe is Expected to Hold the Largest Market Size By 2022
Figure 37 Robotic Process Automation Tools for the Other Industries in North America is Expected to Hold the Largest Market Size By 2022
Figure 38 Service-Based Robotic Process Automation for BFSI is Expected to Hold the Largest Market Size By 2022
Figure 39 Robotic Process Automation Services for BFSI in North America is Expected to Hold the Largest Market Size By 2022
Figure 40 Robotic Process Automation Services for Travel, Hospitality, and Transportation in Europe is Expected to Hold the Largest Market Size By 2022
Figure 41 Robotic Process Automation Services for Manufacturing and Logistics in APAC is Expected to Hold the Largest Market Size By 2022
Figure 42 BFSI Industry Expected to Hold the Largest Size of the Market By 2022
Figure 43 North America Expected to Lead the Market for the BFSI Industry By 2022
Figure 44 Decision Support and Management Solution Expected to Witness the Highest Growth Rate in the Telecom and IT Industry By 2022
Figure 45 Market for the Travel, Hospitality, and Transportation Industry to Grow at the Highest Rate in Europe By 2022
Figure 46 Decision Support and Management Solution for the Retail and Consumer Goods Expected to Hold the Largest Size of the Market By 2022
Figure 47 RPA Market for the Manufacturing and Logistics Industry to Grow at the Highest Rate in APAC By 2022
Figure 48 Decision Support and Management Solution for Healthcare and Pharmaceuticals Expected to Hold the Largest Size of the Market By 2022
Figure 49 Japan and India Exhibiting the Highest Growth Rate During the Forecast Period
Figure 50 Snapshot of RPA Market in North America
Figure 51 Snapshot of Market in Europe
Figure 52 Germany Likely to Dominate the European Market During the Forecast Period
Figure 53 Snapshot of Market in Asia Pacific
Figure 54 RPA Market in the Middle East and Africa to Hold Higher Share in RoW During the Forecast Period
Figure 55 Companies Adopted New Product Developments as the Key Growth Strategy Between 2014 and 2016
Figure 56 Market Evolution Framework — Partnerships, Agreements, and Collaborations Were the Major Strategy Adopted By Key Players (2014–2016)
Figure 57 Battle for Market Ranking: Partnerships, Agreements, and Collaborations as the Key Growth Strategy
Figure 58 Nice Systems Ltd.: Company Snapshot
Figure 59 Nice Systems Ltd.: SWOT Analysis
Figure 60 Pegasystems Inc.: Company Snapshot
Figure 61 Pegasystems Inc.: SWOT Analysis
Figure 62 Automation Anywhere: SWOT Analysis
Figure 63 Blue Prism PLC: SWOT Analysis
Figure 64 Ipsoft, Inc.: SWOT Analysis
Figure 65 Verint: Company Snapshot
Figure 66 Xerox Corporation: Company Snapshot
The research methodology used to estimate and forecast the robotic process automation market begins with capturing data on key vendor revenue through secondary research, covering Institute for Robotic Process Automation (IRPA), press releases, investor relation presentations, annual reports, etc. Vendor offerings are also taken into consideration to determine the market segmentation. The bottom-up approach is employed to arrive at the overall size of the global RPA market from the revenue of key players.
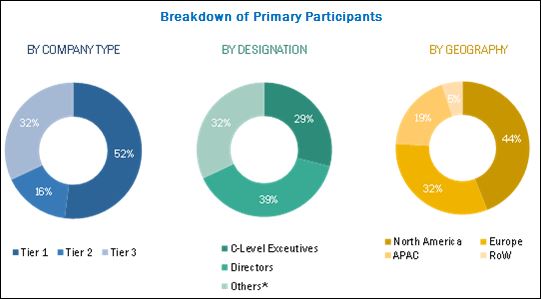
After arriving at the overall market size, the total market is split into several segments and subsegments. These are further verified through primary research by conducting extensive interviews with people holding key positions—CEOs, VPs, directors, and executives. RPA market breakdown and data triangulation procedures have been employed to complete the overall market engineering process and arrive at the exact statistics for all the segments and subsegments.The breakdown of the profiles of the primaries is depicted in the following figure:
To know about the assumptions considered for the study, download the pdf brochure
The robotic process automation market ecosystem comprises system integrators, software providers, and distributors. Players involved in the development of robotic process automation include Automation Anywhere (U.S.), Blue Prism (U.K.), Celaton Ltd (U.K.), IPSoft (U.S.), Nice Systems Ltd. (Israel), Pegasystems (U.S.), Redwood Software (U.S.), UiPath (Romania), Verint (U.S.), and Xerox Corporation (U.S.).
Robotic Process Automation Market Report Scope:
|
Report Metric |
Details |
| Market size value in 2022 | USD 2,467.0 million |
| Growth rate | CAGR of 30.14% |
|
Report Name |
Robotic Process Automation Market, RPA Market |
|
Base year |
2016 |
|
Forecast period |
2017–2022 |
|
Forecast units |
Value in terms of USD million and billion |
|
Segments covered |
Product, System Type, Software & Services, Function, Industry, and Region |
|
Geographic regions covered |
|
|
Companies covered |
|
Target Audience of the RPA Market Report:
- Associations, organizations, forums, and alliances
- Cloud service providers
- Customer experience solution providers
- Government bodies and departments
- Research organizations and consulting companies
- System integrators
- Technology consultants
- Value added resellers
- Workforce optimization solutions providers
“This study answers several questions for stakeholders; primarily, which market segments to focus on in the next two to five years for prioritizing efforts and investments.”
Scope of the RPA Market Report:
This research report categorizes the global robotic process automation market segmented on the basis of process, operations, type, industry, and region.
Robotic Process Automation Market, by Process
- Automated Solution
- Decision Support and Management Solutions
- Interaction Solutions
RPA Market, by Operations:
- Rule-based
- Knowledge-based
Robotic Process Automation Market, by Type
- Tools
- Services
RPA Market, by Industry:
- Banking, Financial Services and Insurance
- Healthcare and Pharmaceuticals
- Manufacturing and Logistics
- Telecom and IT
- Retail and Consumer Goods
- Travel, Hospitality, and Transportation
- Others (Energy and utility, government, and academics)
Robotic Process Automation Market, by region:
- North America
- Europe
- Asia Pacific (APAC)
- Rest of the World (RoW)
Critical questions which the report answers
- What are the various operations of robotic process automation and which one is best suitable for various industries?
- Which are the key players in the RPA market and how intense is the competition?
Available Customizations:
With the given market data, MarketsandMarkets offers customizations according to the specific needs of companies. The following customization options are available for the report:
Company Information:
Detailed analysis and profiling of additional market players (up to five)


Growth opportunities and latent adjacency in RPA (Robotic Process Automation) Market