Robotics and Automation Actuators Market

Robotics and Automation Actuators Market by Type (Linear Actuators, Rotary Actuators), Actuation (Electric, Pneumatic, Hydraulic), Application (Process Automation, Robotics), Vertical, Design Characteristic, and Region - Global Forecast to 2027

Report Code: AS 6962 Jun, 2022, by marketsandmarkets.com

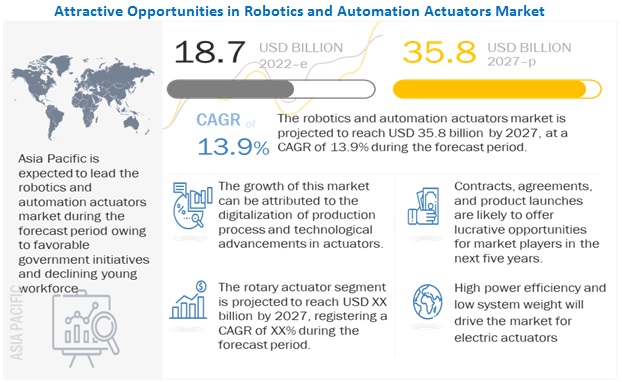
The Robotics and Automation Actuators Market size is estimated to be valued from USD 18.7 billion in 2022 to USD 35.8 billion by 2027; at a CAGR of 13.9% during the forecast period. Industries across all the regions are expected to adopt robotics and automation actuators that have simple designs, are easy to operate, and are cost-effective.
Robotics and Automation Actuators Market

To know about the assumptions considered for the study, Request for Free Sample Report

Robotics and Automation Actuators Market Dynamics:

Driver: Ongoing technological advancements in Robotics and automation actuators

The demand for improved performance Robotics and automation actuators for use in various industries has led to the development of new and advanced actuators such as electrical actuators, compact pneumatic actuators, and explosion- proof actuators. Electrical actuators are the most advanced actuators in terms of technology. They are increasingly used in the mining, automation, aerospace & defense, and chemical industries as they are silent, clean, non-toxic, and energy competent. These actuators are more efficient than pneumatic and hydraulic actuators. Electrical actuators can be integrated with critical systems using data bus communication. They offer instant feedback of movements of end effectors and provide accurate variable control over motor speed acceleration and velocity. They are also easy to install. Electrical actuators have a long shelf life and require low maintenance, leading to low total functional costs as compared to other actuators.

Moreover, several other types of actuators, such as mini-electrical actuators, digital linear actuators, and idle speed controllers, have also been developed and introduced in the market. Thus, continuous technological advancements in actuators are expected to lead to their increased application in various industries, thereby fueling their demand across the globe. This increased demand for different types of actuators is expected to contribute to the growth of the Robotics and Automation Actuators Industry during the forecast period.

Restraint: Continuous upheavals in the oil & gas industry and volatility in the price of crude oil

Actuators are used in the petrochemicals industry for automation at different stages of the oil & gas supply chain. Continuous upheavals in the oil & gas industry in the form of reduced oil prices have affected oil & gas exploration activities across the globe. Several oil-producing countries are focusing on the optimum utilization of their current oil wells. Exploration and development activities of new oil & gas fields are taking place at a very slow pace. This has adversely affected the overall growth of the actuators market. The price of crude oil has fallen drastically over the last few years, affecting the overall market for various components used in the oil & gas supply chain, including Robotics and automation actuators.

Opportunity: Development of smart cities across the globe

Due to the ongoing rapid urbanization across the globe, there is an increase in the development of smart cities across the globe. Smart cities adopt instrumentation and actuation technologies to manage and interconnect thousands of scattered sensors and actuators, which use the Internet of Things (IoT).

Smart cities use electronically-driven solutions for logistics applications. Smart electrical actuators equipped with inbuilt location feedback and power systems as well as bus communication act as cost-effective solutions for the transformation of control logic into smart motion. These actuators cater to service robots such as cleaning robots, automated guided vehicles, automated parking systems, surveillance robots, etc.

There is an increase in the number of smart cities being planned across the globe, as several existing cities are facing housing shortages, overstretched infrastructures, and uncertain water and energy supplies. This has led to the requirement for smart cities that use the Internet of Things as a networking technology and smart data as a forecasting technology. Thus, the development of smart cities using these technologies is expected to lead to decentralized management, the merger of heating and electricity facilities, and the integration of industrial facilities, buildings, and vehicles as energy suppliers.

Challenge: Power consumption, noise, and leakage issues

The most challenging stage in the manufacturing of actuators is the designing of a circuit that consumes less energy. Actuators consume more energy than sensors, and a single faulty actuator can result in increased electricity consumption. The power, capacity, and weight of electrical actuators are the main reasons for their increased demand in various applications. However, due to the probability of defective circuit designs, customers may not prefer purchasing actuators. Hence, power consumption issues, especially in faulty actuators, act as a challenge for the manufacturers of Robotics and automation actuators.

In addition, the lack of maintenance of actuators may lead to excessive noise and air leakage. These systems are also known to fail over long periods of time, owing to the dampening of the inside edges of their tubes. Moreover, the noise level during the operation of actuators is significantly high, and as such, these systems are sometimes placed in a separate room to limit the sound pollution. In some cases, hazardous chemicals are used in actuators that can lead to the accidental release of chemicals into the air. This can result in an adverse impact on the surrounding environment.

Robotics And Automation Actuators Market Ecosystem

Prominent companies providing Robotics and Automation Actuator Product and solutions private and small enterprises, distributors/suppliers/retailers, and end customers are key stakeholders in the Robotics and Automation Actuator market ecosystem. Investors, funders, academic researchers, distributors, service providers, and industries serve as major influencers in the market.

Robotics and Automation Actuators Market   by Region

To know about the assumptions considered for the study, download the pdf brochure

The electric actuation segment of the robotics and automation actuators market is projected to lead the market.

By actuation, the electric segment is estimated to lead the robotics and automation actuators market in 2022. The growth of this segment can be attributed to the high power efficiency, lower system weight and increasing power output.

The Robotics application segment of the robotics and automation actuators market is projected to grow at the highest CAGR during the forecasted period.

By application, the robotics segment is projected to grow at the highest CAGR in the robotics and automation actuators market in 2022. The robotics segment of the market has been further classified into industrial robots and service robots. The growth of this segment is increasing the demand from large-scale enterprises to use industrial robots in their manufacturing plants, while service robots are used for professional as well as personal applications.

The Rotary actuator segment of the robotics and automation actuators market is estimated to have the highest CAGR during the forecasted period

By type, the rotary is estimated to grow at a highest CAGR during the forecast period. . They are used to convert electric energy into rotational motion. These actuators are primarily used in automation applications such as gates, valves, etc., and in industries where accurate positioning of end effectors, such as movement of valves in a pipeline, is required and are fueling the growth of the market inturn.

Asia Pacific is estimated to lead the robotics and automation actuators market

Asia Pacific is estimated to lead the robotics and automation actuators market by 2027.Countries here are upgrading various capabilities by undertaking developments in the field of actuators. China and Japan are primarily investing in robotics and automation to enhance and gain a tactical edge in process automation. This provides an excellent opportunity for actuators manufacturers to strengthen their businesses in the Asia Pacific region

Robotics and Automation Actuators Market   by Region

Key Market Players

ABB (Switzerland), Rockwell Automation (US), Altra Industrial Motion (US). Moog (US), SMC (Japan), Curtis Wright (Exlar) (US), and MISUMI (Japan) are some of the leading players covered in the Robotics and Automation Actuators Companies report.

Want to explore hidden markets that can drive new revenue in Robotics and Automation Actuators Market?

Scope of the Report

Report Metric

Details

Estimated Market Size

USD 18.7 billion

Projected Market Size

USD 35.8 billion

Growth Rate

13.9%

Market size available for years

2018-2027

Base year considered

2021

Forecast period

2022-2027

Forecast units

Value (USD Million)

Segments covered

By type, vertical, application, actuation and design characteristics

Geographies covered

North America, Asia Pacific, Europe, and Rest of the World

Companies covered


This research report categorizes the Robotics and automation actuators Market based on on type, vertical, application and actuation and region.

Robotics and automation actuators Market, By Application

Robotics and automation actuators Market, By Type

  • Linear Actuators
  • Rotary Actuators

Robotics and automation actuators Market, By Vertical

  • Food & Beverages
  • Oil & Gas
  • Metal Mining & Machinery
  • Power Generation
  • Chemicals, Paper & plastics
  • Pharmaceutical & Healthcare
  • Automotive
  • Aerospace & Defense
  • Marine
  • Electronics & Electricals
  • Logistics
  • Inspection, Maintenance & Cleaning
  • Agriculture & Forestry
  • Others

Robotics and automation actuators Market, By Characteristics

  • Load
  • Torque

Robotics and automation actuators Market, By Actuation

  • Electric
  • Pneumatic
  • Hydraulic
  • Others

Robotics and automation actuators Market, By Design Characteristics

  • Load
  • Torque

Robotics and automation actuators Market, By Region

  • North America
  • Europe
  • Asia Pacific
  • Rest of the World

Recent Developments

  • In February 2022, ABB successfully completes installation and remote commissioning of new actuators for India’s largest paper and paperboard business. . As a result of the upgrade to Slice xP, which is easy to install and maintain, ITC will benefit from reduced CD profile variability and advanced diagnostics through the built-in monitoring of each actuator.
  • In April 2021, Rockwell Automation entered into a partnership with Comau to simplify robot integration for manufacturers.
  • In March 2021, Federal Equipment Company has awarded Curtiss-Wright a contract to supply Exlar Electro-Mechanical Actuators in support of its weapons elevator systems for the Ford-class aircraft carrier programme. On the Ford-class ships, Exlar actuators are employed in the Jet Blast Defector, Integrated Catapult Control Station, and LSO actuation systems, among other mission-critical areas.

Frequently Asked Questions (FAQ):

To speak to our analyst for a discussion on the above findings, click Speak to Analyst


Exclusive indicates content/data unique to MarketsandMarkets and not available with any competitors.

TABLE OF CONTENTS
 
1 INTRODUCTION (Page No. - 35)
    1.1 OBJECTIVES OF THE STUDY 
    1.2 MARKET DEFINITION 
    1.3 STUDY SCOPE 
           FIGURE 1 ROBOTICS AND AUTOMATION ACTUATORS SEGMENTATION
           1.3.1 REGIONAL SCOPE
           1.3.2 YEARS CONSIDERED FOR THE STUDY
    1.4 CURRENCY & PRICING 
           1.4.1 USD EXCHANGE RATES
    1.5 LIMITATIONS 
    1.6 INCLUSIONS & EXCLUSIONS 
    1.7 MARKET STAKEHOLDERS 
    1.8 SUMMARY OF CHANGES 
 
2 RESEARCH METHODOLOGY (Page No. - 40)
    2.1 RESEARCH DATA 
           FIGURE 2 RESEARCH PROCESS FLOW
           FIGURE 3 ROBOTICS AND AUTOMATION ACTUATORS MARKET: RESEARCH DESIGN
           2.1.1 SECONDARY DATA
                    2.1.1.1 Key data from secondary sources
           2.1.2 PRIMARY DATA
                    2.1.2.1 Key data from primary sources
                    2.1.2.2 Breakdown of primaries
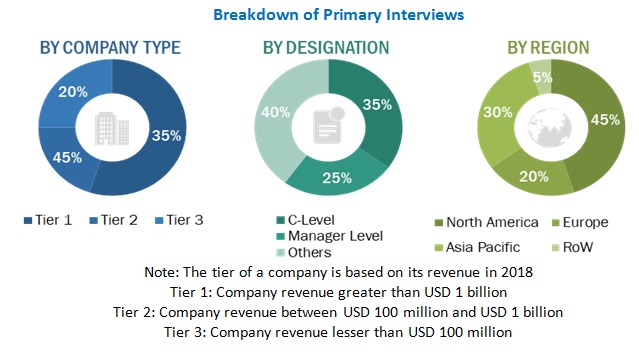
                               FIGURE 4 BREAKDOWN OF PRIMARY INTERVIEWS BY COMPANY TYPE, DESIGNATION, AND REGION
    2.2 MARKET SIZE ESTIMATION 
           2.2.1 BOTTOM-UP APPROACH
                    2.2.1.1 Regional robotics and automation actuators market
                    2.2.1.2 General approach for robotics and automation actuators market
                    2.2.1.3 Robotics and automation actuators market, by actuation
                    2.2.1.4 Robotics and automation actuators market, by type
                    2.2.1.5 Robotics and automation actuators market, by application
                    2.2.1.6 Robotics and automation actuators market, by vertical
                    2.2.1.7 Robotics and automation actuators market, by design characteristic
                               FIGURE 5 MARKET SIZE ESTIMATION METHODOLOGY: BOTTOM-UP APPROACH
           2.2.2 TOP-DOWN APPROACH
                    FIGURE 6 MARKET SIZE ESTIMATION METHODOLOGY: TOP-DOWN APPROACH
           2.2.3 PRICING ANALYSIS
    2.3 DATA TRIANGULATION 
           2.3.1 TRIANGULATION THROUGH SECONDARY
           2.3.2 TRIANGULATION THROUGH PRIMARIES
                    FIGURE 7 DATA TRIANGULATION
    2.4 RESEARCH ASSUMPTIONS 
           2.4.1 MARKET SIZING
           2.4.2 MARKET FORECASTING
                    FIGURE 8 ASSUMPTIONS OF THE RESEARCH STUDY
    2.5 RISKS 
 
3 EXECUTIVE SUMMARY (Page No. - 51)
    FIGURE 9 ELECTRIC SEGMENT PROJECTED TO DOMINATE MARKET DURING FORECAST PERIOD
    FIGURE 10 ROBOTICS TO REGISTER HIGHEST CAGR DURING FORECAST PERIOD
    FIGURE 11 ASIA PACIFIC ESTIMATED TO LEAD ROBOTICS AND AUTOMATION ACTUATORS MARKET IN 2022
 
4 PREMIUM INSIGHTS (Page No. - 54)
    4.1 ATTRACTIVE GROWTH OPPORTUNITIES IN ROBOTICS AND AUTOMATION ACTUATORS MARKET 
           FIGURE 12 INCREASING DIGITALIZATION OF PRODUCTION PROCESSES TO DRIVE ROBOTICS AND AUTOMATION ACTUATORS MARKET FROM 2022 TO 2027
    4.2 ROBOTICS AND AUTOMATION ACTUATORS MARKET, BY ACTUATION 
           FIGURE 13 ELECTRIC SEGMENT PROJECTED TO LEAD MARKET FROM 2022 TO 2027
    4.3 ROBOTICS AND AUTOMATION ACTUATORS MARKET, BY TYPE 
           FIGURE 14 LINEAR ACTUATOR SEGMENT PROJECTED TO DOMINATE MARKET FROM 2022 TO 2027
    4.4 ROBOTICS AND AUTOMATION ACTUATORS MARKET, BY VERTICAL 
           FIGURE 15 ELECTRONICS & ELECTRICALS SEGMENT PROJECTED TO LEAD MARKET FROM 2022 TO 2027
    4.5 ROBOTICS AND AUTOMATION ACTUATORS MARKET, BY COUNTRY 
           FIGURE 16 INDIA PROJECTED TO REGISTER HIGHEST CAGR IN ROBOTICS AND AUTOMATION ACTUATORS MARKET FROM 2022 TO 2027
 
5 MARKET OVERVIEW (Page No. - 57)
    5.1 INTRODUCTION 
    5.2 MARKET DYNAMICS 
           FIGURE 17 ROBOTICS AND AUTOMATION ACTUATORS MARKET DYNAMICS
           5.2.1 DRIVERS
                    5.2.1.1 Ongoing technological advancements in robotics and automation actuators
                    5.2.1.2 Increasing number of new aircraft deliveries
                    5.2.1.3 Investments for process automation in industries of emerging economies
           5.2.2 RESTRAINTS
                    5.2.2.1 Ongoing volatility in oil & gas industry and price of crude oil
           5.2.3 OPPORTUNITIES
                    5.2.3.1 Demand for new and advanced actuators in different verticals
                    5.2.3.2 Development of smart cities across the globe
           5.2.4 CHALLENGES
                    5.2.4.1 Power consumption, noise, and leakage issues
    5.3 TRENDS/DISRUPTIONS IMPACTING CUSTOMERS' BUSINESS 
           5.3.1 REVENUE SHIFT AND NEW REVENUE POCKETS FOR ROBOTICS AND AUTOMATION ACTUATORS MARKET
           FIGURE 18 REVENUE SHIFT IN ROBOTICS AND AUTOMATION ACTUATORS MARKET
    5.4 ROBOTICS AND AUTOMATION MARKET ECOSYSTEM 
           5.4.1 PROMINENT COMPANIES
           5.4.2 PRIVATE AND SMALL ENTERPRISES
           5.4.3 END USERS
                    FIGURE 19 ROBOTICS AND AUTOMATION ACTUATORS MARKET ECOSYSTEM MAP
                    TABLE 1 ROBOTICS AND AUTOMATION ACTUATORS MARKET ECOSYSTEM
    5.5 TECHNOLOGY ANALYSIS 
           5.5.1 VOICE COIL ACTUATORS
           5.5.2 MICRO-ELECTRO-MECHANICAL SYSTEM (MEMS) ACTUATORS
           5.5.3 HASEL (HYDRAULICALLY AMPLIFIED SELF-HEALING ELECTROSTATIC)
    5.6 USE CASE ANALYSIS 
           5.6.1 USE CASE: MATERIAL HANDLING
           5.6.2 USE CASE: MEDICAL INDUSTRY
           5.6.3 USE CASE: INDUSTRIAL SETTINGS
           5.6.4 USE CASE: OIL & GAS INDUSTRY
    5.7 VALUE CHAIN ANALYSIS OF ROBOTICS AND AUTOMATION ACTUATORS MARKET 
           FIGURE 20 VALUE CHAIN ANALYSIS
    5.8 PORTER'S FIVE FORCES ANALYSIS 
           TABLE 2 ROBOTICS AND AUTOMATION ACTUATORS MARKET: PORTER'S FIVE FORCES
           FIGURE 21 ROBOTICS AND AUTOMATION ACTUATORS MARKET: PORTER'S FIVE FORCES ANALYSIS
           5.8.1 THREAT OF NEW ENTRANTS
           5.8.2 THREAT OF SUBSTITUTES
           5.8.3 BARGAINING POWER OF SUPPLIERS
           5.8.4 BARGAINING POWER OF BUYERS
           5.8.5 INTENSITY OF COMPETITIVE RIVALRY
    5.9 KEY STAKEHOLDERS & BUYING CRITERIA 
           5.9.1 KEY STAKEHOLDERS IN BUYING PROCESS
                    FIGURE 22 INFLUENCE OF STAKEHOLDERS IN BUYING PROCESS FOR TOP THREE APPLICATIONS
                    TABLE 3 INFLUENCE OF STAKEHOLDERS IN BUYING PROCESS FOR TOP THREE APPLICATIONS (%)
           5.9.2 BUYING CRITERIA
                    FIGURE 23 KEY BUYING CRITERIA FOR TOP APPLICATIONS
                    TABLE 4 KEY BUYING CRITERIA FOR TOP THREE APPLICATIONS
    5.10 VOLUME DATA 
           TABLE 5 ANNUAL INSTALLATION OF INDUSTRY ROBOTS: 15 LARGEST MARKETS (2020)
    5.11 TARIFF AND REGULATORY LANDSCAPE 
           5.11.1 REGULATORY BODIES, GOVERNMENT AGENCIES, AND OTHER ORGANIZATIONS
                    TABLE 6 NORTH AMERICA: REGULATORY BODIES, GOVERNMENT AGENCIES, AND OTHER ORGANIZATIONS
                    TABLE 7 EUROPE: REGULATORY BODIES, GOVERNMENT AGENCIES, AND OTHER ORGANIZATIONS
    5.12 KEY CONFERENCES & EVENTS IN 2022-2023 
           TABLE 8 ROBOTICS AND AUTOMATION ACTUATORS MARKET: CONFERENCES & EVENTS
 
6 INDUSTRY TRENDS (Page No. - 76)
    6.1 INTRODUCTION 
    6.2 EVOLUTION 
           FIGURE 24 EVOLUTION OF ACTUATORS
    6.3 TECHNOLOGY TRENDS 
           6.3.1 AMPLIFIED PIEZOELECTRIC ACTUATORS
           6.3.2 SMART ACTUATORS
           6.3.3 HYBRID ACTUATORS
           6.3.4 VACUUM ACTUATORS
           6.3.5 EXPLOSION-PROOF ACTUATORS
    6.4 EMERGING TECHNOLOGICAL TRENDS 
           6.4.1 OPTOELECTRONIC SOLUTIONS FOR EMBEDDED SENSORS
           6.4.2 NANOTECHNOLOGY
           6.4.3 ARTIFICIAL INTELLIGENCE
    6.5 SAFETY STANDARDS AND SELECTION CRITERIA FOR ACTUATORS 
           TABLE 9 SELECTION CRITERIA FOR ACTUATORS
    6.6 INNOVATIONS AND PATENT REGISTRATIONS 
           TABLE 10 INNOVATIONS & PATENT REGISTRATIONS, 2018-2021
 
7 ROBOTICS AND AUTOMATION ACTUATORS MARKET, BY ACTUATION (Page No. - 84)
    7.1 INTRODUCTION 
           FIGURE 25 ROBOTICS AND AUTOMATION ACTUATORS MARKET, BY ACTUATION, 2022 & 2027 (USD MILLION)
           TABLE 11 ROBOTICS AND AUTOMATION ACTUATORS MARKET, BY ACTUATION, 2018–2021 (USD MILLION)
           TABLE 12 ROBOTICS AND AUTOMATION ACTUATORS MARKET, BY ACTUATION, 2022–2027 (USD MILLION)
    7.2 ELECTRIC 
           7.2.1 INCREASED USE ACROSS INDUSTRIES BOOSTS DEMAND
    7.3 HYDRAULIC 
           7.3.1 USE IN HIGH-FORCE APPLICATIONS FUELS SEGMENT
    7.4 PNEUMATIC 
           7.4.1 MAJOR SECTORS OF USE: FOOD & BEVERAGES AND OIL & GAS
    7.5 OTHERS 
           7.5.1 PIEZOELECTRIC ACTUATORS TO WITNESS INCREASED DEMAND DURING FORECAST PERIOD
 
8 ROBOTICS AND AUTOMATION ACTUATORS MARKET, BY APPLICATION (Page No. - 88)
    8.1 INTRODUCTION 
           FIGURE 26 ROBOTICS AND AUTOMATION ACTUATORS MARKET, BY APPLICATION, 2022 & 2027 (USD MILLION)
           TABLE 13 ROBOTICS AND AUTOMATION ACTUATORS MARKET, BY APPLICATION, 2018–2021 (USD MILLION)
           TABLE 14 ROBOTICS AND AUTOMATION ACTUATORS MARKET, BY APPLICATION, 2022–2027 (USD MILLION)
    8.2 PROCESS AUTOMATION 
           TABLE 15 PROCESS AUTOMATION ACTUATORS MARKET, BY APPLICATION, 2018–2021 (USD MILLION)
           TABLE 16 PROCESS AUTOMATION ACTUATORS MARKET, BY APPLICATION, 2022–2027 (USD MILLION)
           8.2.1 MACHINERY
                    8.2.1.1 INCREASING USE OF MACHINERY ACROSS VERTICALS DRIVES MARKET
           8.2.2 MATERIAL HANDLING
                    8.2.2.1 WIDE VARIETY OF APPLICATIONS DRIVES SEGMENT
           8.2.3 FLOW CONTROL
                    8.2.3.1 GROWTH IN CHEMICALS, OIL & GAS, AND FOOD & BEVERAGE INDUSTRIES WILL DRIVE DEMAND
           8.2.4 VENTILATION
                    8.2.4.1 SEMICONDUCTOR MANUFACTURING FACILITIES THAT REQUIRE SPECIALIZED VENTILATION EQUIPMENT FUEL DEMAND
           8.2.5 OTHERS
    8.3 ROBOTICS 
           TABLE 17 ROBOTICS ACTUATORS MARKET, BY ROBOT TYPE, 2018–2021 (USD MILLION)
           TABLE 18 ROBOTICS ACTUATORS MARKET, BY ROBOT TYPE, 2022–2027 (USD MILLION)
           8.3.1 INDUSTRIAL ROBOTS
                    TABLE 19 INDUSTRIAL ROBOTICS ACTUATORS MARKET, BY ROBOT TYPE, 2018–2021 (USD MILLION)
                    TABLE 20 INDUSTRIAL ROBOTICS ACTUATORS MARKET, BY ROBOT TYPE, 2022–2027 (USD MILLION)
                    8.3.1.1 Articulated robots
                               8.3.1.1.1 Wide variety in payload capacity and suitability across many industries
                    8.3.1.2 SCARA robots
                               8.3.1.2.1 Useful for high-speed operations in confined workspaces
                    8.3.1.3 Parallel robots
                               8.3.1.3.1 Designed for high-speed applications, manufacturing, packaging, material handling, and assembly
                    8.3.1.4 Cartesian robots
                               8.3.1.4.1 Ideal for applications where large spans are required
                    8.3.1.5 Collaborative robots
                               8.3.1.5.1 Combining safety with low prices - challenge for developers
                    8.3.1.6 Others
           8.3.2 SERVICE ROBOTS
                    TABLE 21 SERVICE ROBOTICS ACTUATORS MARKET, BY ROBOT TYPE, 2018–2021 (USD MILLION)
                    TABLE 22 SERVICE ROBOTICS ACTUATORS MARKET, BY ROBOT TYPE, 2022–2027 (USD MILLION)
                    8.3.2.1 Professional robots
                               TABLE 23 PROFESSIONAL ROBOTS: ACTUATORS MARKET, BY APPLICATION, 2018–2021 (USD MILLION)
                               TABLE 24 PROFESSIONAL ROBOTS: ACTUATORS MARKET, BY APPLICATION, 2022–2027 (USD MILLION)
                               8.3.2.1.1 Logistics
                                             8.3.2.1.1.1 Replacing automated rail-guided systems in large facilities
                               8.3.2.1.2 Medical robots
                                             8.3.2.1.2.1 Enhanced precision during surgery due to automation drives segment
                               8.3.2.1.3 Exoskeleton
                                             8.3.2.1.3.1 Provide support in repetitive tasks
                               8.3.2.1.4 Field robots
                                             8.3.2.1.4.1 Suitable for labor-intensive jobs
                               8.3.2.1.5 Military robots
                                             8.3.2.1.5.1 Increased defense budget across countries drives segment
                               8.3.2.1.6 Inspection & maintenance robots
                                             8.3.2.1.6.1 Increased uptime and reduced labor costs fuel segment
                               8.3.2.1.7 Professional cleaning robots
                                             8.3.2.1.7.1 Deployed to improve efficiency and enhance quality of output
                  8.3.2.2 Personal robots
                               8.3.2.2.1 Increasing usage in household applications
                                             TABLE 25 PERSONAL ROBOTS: ACTUATORS MARKET, BY APPLICATION, 2018–2021 (USD MILLION)
                                             TABLE 26 PERSONAL ROBOTS: ACTUATORS MARKET, BY APPLICATION, 2022–2027 (USD MILLION)
 
9 ROBOTICS AND AUTOMATION ACTUATORS MARKET, BY TYPE (Page No. - 99)
    9.1 INTRODUCTION 
           FIGURE 27 ROBOTICS AND AUTOMATION ACTUATORS MARKET, BY TYPE, 2022 & 2027(USD MILLION)
           TABLE 27 ROBOTICS AND AUTOMATION ACTUATORS MARKET, BY TYPE, 2018–2021 (USD MILLION)
           TABLE 28 ROBOTICS AND AUTOMATION ACTUATORS MARKET, BY TYPE, 2022–2027(USD MILLION)
    9.2 LINEAR ACTUATORS 
           9.2.1 ROD TYPE LINEAR ACTUATOR
                    9.2.1.1 Increasing use in aircraft structures to carry loads expected to contribute to demand
           9.2.2 SCREW TYPE LINEAR ACTUATOR
                    9.2.2.1 Growing use with servomotors in drive and control hardware and sensors fuels demand
           9.2.3 BELT TYPE LINEAR ACTUATOR
                    9.2.3.1 Demand rising to increase operational efficiency of process automation
    9.3 ROTARY ACTUATORS 
           9.3.1 MOTOR
                    9.3.1.1 Surging sales of industrial robots fuels demand
           9.3.2 BLADDER & VANE
                    9.3.2.1 Increasing use in gates and valves contributes to rise in demand
           9.3.3 PISTON TYPE
                    9.3.3.1 Growing use for precision control applications in electronics industry expected to fuel demand
 
10 ROBOTICS AND AUTOMATION ACTUATORS MARKET, BY VERTICAL (Page No. - 103)
     10.1 INTRODUCTION 
             FIGURE 28 ROBOTICS AND AUTOMATION ACTUATORS MARKET, BY VERTICAL, 2022 & 2027 (USD MILLION)
             TABLE 29 ROBOTICS AND AUTOMATION ACTUATORS MARKET, BY VERTICAL, 2018–2021 (USD MILLION)
             TABLE 30 ROBOTICS AND AUTOMATION ACTUATORS MARKET, BY VERTICAL, 2022–2027 (USD MILLION)
     10.2 FOOD & BEVERAGES 
             10.2.1 NEED FOR INCREASED AUTOMATION AND CAPACITY ENHANCEMENT DRIVES SEGMENT
     10.3 OIL & GAS 
             10.3.1 INCREASE IN OIL & GAS EXPLORATION ACTIVITIES IN ASIA PACIFIC DRIVES GROWTH
     10.4 METALS, MINING & MACHINERY 
             10.4.1 REQUIREMENT FOR ROBUST ACTUATORS IN MINING BOOSTS SEGMENT
     10.5 POWER GENERATION 
             10.5.1 SEGMENT DRIVEN BY INCREASED SPENDING ON RENEWABLE ENERGY
     10.6 CHEMICALS, PAPER & PLASTICS 
             10.6.1 RAPID INDUSTRIALIZATION AND STRINGENT IMPLEMENTATION OF ENVIRONMENTAL REGULATIONS – SEGMENT DRIVERS
     10.7 PHARMACEUTICAL & HEALTHCARE 
             10.7.1 STRINGENT REGULATIONS FOR HYGIENE CONTRIBUTE TO GROWTH OF MARKET
     10.8 AUTOMOTIVE 
             10.8.1 INCREASED DEMAND FOR INDUSTRIAL ROBOTS FUELS SEGMENT
     10.9 AEROSPACE & DEFENSE 
             10.9.1 KEY DRIVERS: RISE IN DEFENSE EXPENDITURE, INCREASE IN COMMERCIAL AVIATION, MILITARY MODERNIZATION
     10.1 MARINE 
             10.10.1 INCREASED DEMAND FOR COMMERCIAL SHIPBUILDING DRIVES SEGMENT
     10.11 ELECTRONICS & ELECTRICALS 
             10.11.1 DEMAND FOR BATTERIES, CHIPS, AND DISPLAYS BOOSTS SEGMENT
     10.12 LOGISTICS 
             10.12.1 SHORTAGE OF LABOR PROMPTS DEMAND FOR LOGISTICS ROBOTS
     10.13 INSPECTION, MAINTENANCE & CLEANING 
             10.13.1 INCREASED NEED FOR SAFETY AND OPERATIONAL EFFICIENCY FUELS SEGMENT
     10.14 AGRICULTURE & FORESTRY 
             10.14.1 SCARCITY OF LABOR DRIVES SEGMENT
 
11 ROBOTICS AND AUTOMATION ACTUATORS, BY DESIGN CHARACTERISTIC (Page No. - 111)
     11.1 INTRODUCTION 
             FIGURE 29 ROBOTICS AND AUTOMATION ACTUATORS MARKET, BY DESIGN CHARACTERISTIC, 2022-2027 (USD MILLION)
             TABLE 31 ROBOTICS AND AUTOMATION ACTUATORS MARKET, BY DESIGN CHARACTERISTIC, 2018–2021 (USD MILLION)
             TABLE 32 ROBOTICS AND AUTOMATION ACTUATORS MARKET, BY DESIGN CHARACTERISTIC, 2022–2027 (USD MILLION)
     11.2 LOAD 
             TABLE 33 ROBOTICS AND AUTOMATION ACTUATORS MARKET, BY LOAD, 2018–2021 (USD MILLION)
             TABLE 34 ROBOTICS AND AUTOMATION ACTUATORS MARKET, BY LOAD, 2022–2027 (USD MILLION)
             11.2.1 HIGH
             11.2.2 MEDIUM
             11.2.3 LOW
     11.3 TORQUE 
             TABLE 35 ROBOTICS AND AUTOMATION ACTUATORS MARKET, BY TORQUE, 2018–2021 (USD MILLION)
             TABLE 36 ROBOTICS AND AUTOMATION ACTUATORS MARKET, BY TORQUE, 2022–2027 (USD MILLION)
             11.3.1 HIGH
             11.3.2 MEDIUM
             11.3.3 LOW
 
12 REGIONAL ANALYSIS (Page No. - 115)
     12.1 INTRODUCTION 
             FIGURE 30 ASIA PACIFIC TO ACCOUNT FOR LARGEST SHARE OF ROBOTICS AND AUTOMATION ACTUATORS MARKET IN 2022
             TABLE 37 ROBOTICS AND AUTOMATION ACTUATORS MARKET, BY REGION, 2018–2021 (USD MILLION)
             TABLE 38 ROBOTICS AND AUTOMATION ACTUATORS MARKET, BY REGION, 2022–2027 (USD MILLION)
             12.1.1 NORTH AMERICA
             12.1.2 PESTLE ANALYSIS: NORTH AMERICA
                        FIGURE 31 NORTH AMERICA: ROBOTICS AND ACTUATION ACTUATORS MARKET SNAPSHOT
                        TABLE 39 NORTH AMERICA: ROBOTICS AND AUTOMATION ACTUATORS MARKET, BY TYPE, 2018–2021 (USD MILLION)
                        TABLE 40 NORTH AMERICA: ROBOTICS AND AUTOMATION ACTUATORS MARKET, BY TYPE, 2022–2027 (USD MILLION)
                        TABLE 41 NORTH AMERICA: ROBOTICS AND AUTOMATION ACTUATORS MARKET, BY ACTUATION, 2018–2021 (USD MILLION)
                        TABLE 42 NORTH AMERICA: ROBOTICS AND AUTOMATION ACTUATORS MARKET, BY ACTUATION, 2022–2027 (USD MILLION)
                        TABLE 43 NORTH AMERICA: ROBOTICS AND AUTOMATION ACTUATORS MARKET, BY APPLICATION, 2018–2021 (USD MILLION)
                        TABLE 44 NORTH AMERICA: ROBOTICS AND AUTOMATION ACTUATORS MARKET, BY APPLICATION, 2022–2027 (USD MILLION)
                        TABLE 45 NORTH AMERICA: ROBOTICS AND AUTOMATION ACTUATORS MARKET, BY COUNTRY, 2018–2021 (USD MILLION)
                        TABLE 46 NORTH AMERICA: ROBOTICS AND AUTOMATION ACTUATORS MARKET, BY COUNTRY, 2022–2027 (USD MILLION)
             12.1.3 US
                        12.1.3.1 High investment by manufacturing companies in automation of processes
                                     TABLE 47 US: ROBOTICS AND AUTOMATION ACTUATORS MARKET, BY TYPE, 2018–2021 (USD MILLION)
                                     TABLE 48 US: ROBOTICS AND AUTOMATION ACTUATORS MARKET, BY TYPE, 2022–2027 (USD MILLION)
                                     TABLE 49 US: ROBOTICS AND AUTOMATION ACTUATORS MARKET, BY ACTUATION, 2018–2021 (USD MILLION)
                                     TABLE 50 US: ROBOTICS AND AUTOMATION ACTUATORS MARKET, BY ACTUATION, 2022–2027 (USD MILLION)
                                     TABLE 51 US: ROBOTICS AND AUTOMATION ACTUATORS MARKET, BY APPLICATION, 2018–2021 (USD MILLION)
                                     TABLE 52 US: ROBOTICS AND AUTOMATION ACTUATORS MARKET, BY APPLICATION, 2022–2027 (USD MILLION)
             12.1.4 CANADA
                        12.1.4.1 Growth in precision farming and aerospace & defense to boost market
                                     TABLE 53 CANADA: ROBOTICS AND AUTOMATION ACTUATORS MARKET, BY TYPE, 2018–2021 (USD MILLION)
                                     TABLE 54 CANADA: ROBOTICS AND AUTOMATION ACTUATORS MARKET, BY TYPE, 2022–2027 (USD MILLION)
                                     TABLE 55 CANADA: ROBOTICS AND AUTOMATION ACTUATORS MARKET, BY ACTUATION, 2018–2021 (USD MILLION)
                                     TABLE 56 CANADA: ROBOTICS AND AUTOMATION ACTUATORS MARKET, BY ACTUATION, 2022–2027 (USD MILLION)
                                     TABLE 57 CANADA: ROBOTICS AND AUTOMATION ACTUATORS MARKET, BY APPLICATION, 2018–2021 (USD MILLION)
                                     TABLE 58 CANADA: ROBOTICS AND AUTOMATION ACTUATORS MARKET, BY APPLICATION, 2022–2027 (USD MILLION)
             12.1.5 MEXICO
                        12.1.5.1 Exponential growth in manufacturing sector - major driver for market growth
                                     TABLE 59 MEXICO: ROBOTICS AND AUTOMATION ACTUATORS MARKET, BY TYPE, 2018–2021 (USD MILLION)
                                     TABLE 60 MEXICO: ROBOTICS AND AUTOMATION ACTUATORS MARKET, BY TYPE, 2022–2027 (USD MILLION)
                                     TABLE 61 MEXICO: ROBOTICS AND AUTOMATION ACTUATORS MARKET, BY ACTUATION, 2018–2021 (USD MILLION)
                                     TABLE 62 MEXICO: ROBOTICS AND AUTOMATION ACTUATORS MARKET, BY ACTUATION, 2022–2027 (USD MILLION)
                                     TABLE 63 MEXICO: ROBOTICS AND AUTOMATION ACTUATORS MARKET, BY APPLICATION, 2018–2021 (USD MILLION)
                                     TABLE 64 MEXICO: ROBOTICS AND AUTOMATION ACTUATORS MARKET, BY APPLICATION, 2022–2027 (USD MILLION)
     12.2 EUROPE 
             12.2.1 PESTLE ANALYSIS: EUROPE
                        FIGURE 32 EUROPE: ROBOTICS AND ACTUATION ACTUATORS MARKET SNAPSHOT
                        TABLE 65 EUROPE: ROBOTICS AND AUTOMATION ACTUATORS MARKET, BY TYPE, 2018–2021 (USD MILLION)
                        TABLE 66 EUROPE: ROBOTICS AND AUTOMATION ACTUATORS MARKET, BY TYPE, 2022–2027 (USD MILLION)
                        TABLE 67 EUROPE: ROBOTICS AND AUTOMATION ACTUATORS MARKET, BY ACTUATION, 2018–2021 (USD MILLION)
                        TABLE 68 EUROPE: ROBOTICS AND AUTOMATION ACTUATORS MARKET, BY ACTUATION, 2022–2027 (USD MILLION)
                        TABLE 69 EUROPE: ROBOTICS AND AUTOMATION ACTUATORS MARKET, BY APPLICATION, 2018–2021 (USD MILLION)
                        TABLE 70 EUROPE: ROBOTICS AND AUTOMATION ACTUATORS MARKET, BY APPLICATION, 2022–2027 (USD MILLION)
                        TABLE 71 EUROPE: ROBOTICS AND AUTOMATION ACTUATORS MARKET, BY COUNTRY, 2018–2021 (USD MILLION)
                        TABLE 72 EUROPE: ROBOTICS AND AUTOMATION ACTUATORS MARKET, BY COUNTRY, 2022–2027 (USD MILLION)
             12.2.2 GERMANY
                        12.2.2.1 Advanced robotics and HRC – major trends in country
                                     TABLE 73 GERMANY: ROBOTICS AND AUTOMATION ACTUATORS MARKET, BY TYPE, 2018–2021 (USD MILLION)
                                     TABLE 74 GERMANY: ROBOTICS AND AUTOMATION ACTUATORS MARKET, BY TYPE, 2022–2027 (USD MILLION)
                                     TABLE 75 GERMANY: ROBOTICS AND AUTOMATION ACTUATORS MARKET, BY ACTUATION, 2018–2021 (USD MILLION)
                                     TABLE 76 GERMANY: ROBOTICS AND AUTOMATION ACTUATORS MARKET, BY ACTUATION, 2022–2027 (USD MILLION)
                                     TABLE 77 GERMANY: ROBOTICS AND AUTOMATION ACTUATORS MARKET, BY APPLICATION, 2018–2021 (USD MILLION)
                                     TABLE 78 GERMANY: ROBOTICS AND AUTOMATION ACTUATORS MARKET, BY APPLICATION, 2022–2027 (USD MILLION)
             12.2.3 FRANCE
                        12.2.3.1 Increase in use of software applications to control industrial devices boosts market
                                     TABLE 79 FRANCE: ROBOTICS AND AUTOMATION ACTUATORS MARKET, BY TYPE, 2018–2021 (USD MILLION)
                                     TABLE 80 FRANCE: ROBOTICS AND AUTOMATION ACTUATORS MARKET, BY TYPE, 2022–2027 (USD MILLION)
                                     TABLE 81 FRANCE: ROBOTICS AND AUTOMATION ACTUATORS MARKET, BY ACTUATION, 2018–2021 (USD MILLION)
                                     TABLE 82 FRANCE: ROBOTICS AND AUTOMATION ACTUATORS MARKET, BY ACTUATION, 2022–2027 (USD MILLION)
                                     TABLE 83 FRANCE: ROBOTICS AND AUTOMATION ACTUATORS MARKET, BY APPLICATION, 2018–2021 (USD MILLION)
                                     TABLE 84 FRANCE: ROBOTICS AND AUTOMATION ACTUATORS MARKET, BY APPLICATION, 2022–2027 (USD MILLION)
             12.2.4 UK
                        12.2.4.1 Increase in competition and evolving end-user requirements boost market
                                     TABLE 85 UK: ROBOTICS AND AUTOMATION ACTUATORS MARKET, BY TYPE, 2018–2021 (USD MILLION)
                                     TABLE 86 UK: ROBOTICS AND AUTOMATION ACTUATORS MARKET, BY TYPE, 2022–2027 (USD MILLION)
                                     TABLE 87 UK: ROBOTICS AND AUTOMATION ACTUATORS MARKET, BY ACTUATION, 2018–2021 (USD MILLION)
                                     TABLE 88 UK: ROBOTICS AND AUTOMATION ACTUATORS MARKET, BY ACTUATION, 2022–2027 (USD MILLION)
                                     TABLE 89 UK: ROBOTICS AND AUTOMATION ACTUATORS MARKET, BY APPLICATION, 2018–2021 (USD MILLION)
                                     TABLE 90 UK: ROBOTICS AND AUTOMATION ACTUATORS MARKET, BY APPLICATION, 2022–2027 (USD MILLION)
             12.2.5 ITALY
                        12.2.5.1 Automotive hub – key driver for market
                                     TABLE 91 ITALY: ROBOTICS AND AUTOMATION ACTUATORS MARKET, BY TYPE, 2018–2021 (USD MILLION)
                                     TABLE 92 ITALY: ROBOTICS AND AUTOMATION ACTUATORS MARKET, BY TYPE, 2022–2027 (USD MILLION)
                                     TABLE 93 ITALY: ROBOTICS AND AUTOMATION ACTUATORS MARKET, BY ACTUATION, 2018–2021 (USD MILLION)
                                     TABLE 94 ITALY: ROBOTICS AND AUTOMATION ACTUATORS MARKET, BY ACTUATION, 2022–2027 (USD MILLION)
                                     TABLE 95 ITALY: ROBOTICS AND AUTOMATION ACTUATORS MARKET, BY APPLICATION, 2018–2021 (USD MILLION)
                                     TABLE 96 ITALY: ROBOTICS AND AUTOMATION ACTUATORS MARKET, BY APPLICATION, 2022–2027 (USD MILLION)
             12.2.6 REST OF EUROPE
                        TABLE 97 REST OF EUROPE: ROBOTICS AND AUTOMATION ACTUATORS MARKET, BY TYPE, 2018–2021 (USD MILLION)
                        TABLE 98 REST OF EUROPE: ROBOTICS AND AUTOMATION ACTUATORS MARKET, BY TYPE, 2022–2027 (USD MILLION)
                        TABLE 99 REST OF EUROPE: ROBOTICS AND AUTOMATION ACTUATORS MARKET, BY ACTUATION, 2018–2021 (USD MILLION)
                        TABLE 100 REST OF EUROPE: ROBOTICS AND AUTOMATION ACTUATORS MARKET, BY ACTUATION, 2022–2027 (USD MILLION)
                        TABLE 101 REST OF EUROPE: ROBOTICS AND AUTOMATION ACTUATORS MARKET, BY APPLICATION, 2018–2021 (USD MILLION)
                        TABLE 102 REST OF EUROPE: ROBOTICS AND AUTOMATION ACTUATORS MARKET, BY APPLICATION, 2022–2027 (USD MILLION)
     12.3 ASIA PACIFIC 
             12.3.1 PESTLE ANALYSIS: ASIA PACIFIC
                        FIGURE 33 ASIA PACIFIC: ROBOTICS AND AUTOMATION ACTUATORS MARKET SNAPSHOT
                        TABLE 103 ASIA PACIFIC: ROBOTICS AND AUTOMATION ACTUATORS MARKET, BY TYPE, 2018–2021 (USD MILLION)
                        TABLE 104 ASIA PACIFIC: ROBOTICS AND AUTOMATION ACTUATORS MARKET, BY TYPE, 2022–2027 (USD MILLION)
                        TABLE 105 ASIA PACIFIC: ROBOTICS AND AUTOMATION ACTUATORS MARKET, BY ACTUATION, 2018–2021 (USD MILLION)
                        TABLE 106 ASIA PACIFIC: ROBOTICS AND AUTOMATION ACTUATORS MARKET, BY ACTUATION, 2022–2027 (USD MILLION)
                        TABLE 107 ASIA PACIFIC: ROBOTICS AND AUTOMATION ACTUATORS MARKET, BY APPLICATION, 2018–2021 (USD MILLION)
                        TABLE 108 ASIA PACIFIC: ROBOTICS AND AUTOMATION ACTUATORS MARKET, BY APPLICATION, 2022–2027 (USD MILLION)
                        TABLE 109 ASIA PACIFIC: ROBOTICS AND AUTOMATION ACTUATORS MARKET, BY COUNTRY, 2018–2021 (USD MILLION)
                        TABLE 110 ASIA PACIFIC: ROBOTICS AND AUTOMATION ACTUATORS MARKET, BY COUNTRY, 2022–2027 (USD MILLION)
             12.3.2 CHINA
                        12.3.2.1 Government incentives boost potential to dive into automation
                                     TABLE 111 CHINA: ROBOTICS AND AUTOMATION ACTUATORS MARKET, BY TYPE, 2018–2021 (USD MILLION)
                                     TABLE 112 CHINA: ROBOTICS AND AUTOMATION ACTUATORS MARKET, BY TYPE, 2022–2027 (USD MILLION)
                                     TABLE 113 CHINA: ROBOTICS AND AUTOMATION ACTUATORS MARKET, BY ACTUATION, 2018–2021 (USD MILLION)
                                     TABLE 114 CHINA: ROBOTICS AND AUTOMATION ACTUATORS MARKET, BY ACTUATION, 2022–2027 (USD MILLION)
                                     TABLE 115 CHINA: ROBOTICS AND AUTOMATION ACTUATORS MARKET, BY APPLICATION, 2018–2021 (USD MILLION)
                                     TABLE 116 CHINA: ROBOTICS AND AUTOMATION ACTUATORS MARKET, BY APPLICATION, 2022–2027 (USD MILLION)
             12.3.3 JAPAN
                        12.3.3.1 Automation companies benefiting from strong growth in manufacturing sector
                                     TABLE 117 JAPAN: ROBOTICS AND AUTOMATION ACTUATORS MARKET, BY TYPE, 2018–2021 (USD MILLION)
                                     TABLE 118 JAPAN: ROBOTICS AND AUTOMATION ACTUATORS MARKET, BY TYPE, 2022–2027 (USD MILLION)
                                     TABLE 119 JAPAN: ROBOTICS AND AUTOMATION ACTUATORS MARKET, BY ACTUATION, 2018–2021 (USD MILLION)
                                     TABLE 120 JAPAN: ROBOTICS AND AUTOMATION ACTUATORS MARKET, BY ACTUATION, 2022–2027 (USD MILLION)
                                     TABLE 121 JAPAN: ROBOTICS AND AUTOMATION ACTUATORS MARKET, BY APPLICATION, 2018–2021 (USD MILLION)
                                     TABLE 122 JAPAN: ROBOTICS AND AUTOMATION ACTUATORS MARKET, BY APPLICATION, 2022–2027 (USD MILLION)
             12.3.4 INDIA
                        12.3.4.1 Automotive industry - key growth driver
                                     TABLE 123 INDIA: ROBOTICS AND AUTOMATION ACTUATORS MARKET, BY TYPE, 2018–2021 (USD MILLION)
                                     TABLE 124 INDIA: ROBOTICS AND AUTOMATION ACTUATORS MARKET, BY TYPE, 2022–2027 (USD MILLION)
                                     TABLE 125 INDIA: ROBOTICS AND AUTOMATION ACTUATORS MARKET, BY ACTUATION, 2018–2021 (USD MILLION)
                                     TABLE 126 INDIA: ROBOTICS AND AUTOMATION ACTUATORS MARKET, BY ACTUATION, 2022–2027 (USD MILLION)
                                     TABLE 127 INDIA: ROBOTICS AND AUTOMATION ACTUATORS MARKET, BY APPLICATION, 2018–2021 (USD MILLION)
                                     TABLE 128 INDIA: ROBOTICS AND AUTOMATION ACTUATORS MARKET, BY APPLICATION, 2022–2027 (USD MILLION)
             12.3.5 SOUTH KOREA
                        12.3.5.1 Presence of industrial robot industry drives market
                                     TABLE 129 SOUTH KOREA: ROBOTICS AND AUTOMATION ACTUATORS MARKET, BY TYPE, 2018–2021 (USD MILLION)
                                     TABLE 130 SOUTH KOREA: ROBOTICS AND AUTOMATION ACTUATORS MARKET, BY TYPE, 2022–2027 (USD MILLION)
                                     TABLE 131 SOUTH KOREA: ROBOTICS AND AUTOMATION ACTUATORS MARKET, BY ACTUATION, 2018–2021 (USD MILLION)
                                     TABLE 132 SOUTH KOREA: ROBOTICS AND AUTOMATION ACTUATORS MARKET, BY ACTUATION, 2022–2027 (USD MILLION)
                                     TABLE 133 SOUTH KOREA: ROBOTICS AND AUTOMATION ACTUATORS MARKET, BY APPLICATION, 2018–2021 (USD MILLION)
                                     TABLE 134 SOUTH KOREA: ROBOTICS AND AUTOMATION ACTUATORS MARKET, BY APPLICATION, 2022–2027 (USD MILLION)
             12.3.6 REST OF ASIA PACIFIC
                        TABLE 135 REST OF ASIA PACIFIC: ROBOTICS AND AUTOMATION ACTUATORS MARKET, BY TYPE, 2018–2021 (USD MILLION)
                        TABLE 136 REST OF ASIA PACIFIC: ROBOTICS AND AUTOMATION ACTUATORS MARKET, BY TYPE, 2022–2027 (USD MILLION)
                        TABLE 137 REST OF ASIA PACIFIC: ROBOTICS AND AUTOMATION ACTUATORS MARKET, BY ACTUATION, 2018–2021 (USD MILLION)
                        TABLE 138 REST OF ASIA PACIFIC: ROBOTICS AND AUTOMATION ACTUATORS MARKET, BY ACTUATION, 2022–2027 (USD MILLION)
                        TABLE 139 REST OF ASIA PACIFIC: ROBOTICS AND AUTOMATION ACTUATORS MARKET, BY APPLICATION, 2018–2021 (USD MILLION)
                        TABLE 140 REST OF ASIA PACIFIC: ROBOTICS AND AUTOMATION ACTUATORS MARKET, BY APPLICATION, 2022–2027 (USD MILLION)
     12.4 REST OF THE WORLD 
             12.4.1 PESTLE ANALYSIS: REST OF THE WORLD
                        FIGURE 34 ROW: ROBOTICS AND ACTUATION ACTUATORS MARKET SNAPSHOT
                        TABLE 141 ROW: ROBOTICS AND AUTOMATION ACTUATORS MARKET, BY TYPE, 2018–2021 (USD MILLION)
                        TABLE 142 ROW: ROBOTICS AND AUTOMATION ACTUATORS MARKET, BY TYPE, 2022–2027 (USD MILLION)
                        TABLE 143 ROW: ROBOTICS AND AUTOMATION ACTUATORS MARKET, BY ACTUATION, 2018–2021 (USD MILLION)
                        TABLE 144 ROW: ROBOTICS AND AUTOMATION ACTUATORS MARKET, BY ACTUATION, 2022–2027 (USD MILLION)
                        TABLE 145 ROW: ROBOTICS AND AUTOMATION ACTUATORS MARKET, BY APPLICATION, 2018–2021 (USD MILLION)
                        TABLE 146 ROW: ROBOTICS AND AUTOMATION ACTUATORS MARKET, BY APPLICATION, 2022–2027 (USD MILLION)
                        TABLE 147 ROW: ROBOTICS AND AUTOMATION ACTUATORS MARKET, BY REGION, 2018–2021 (USD MILLION)
                        TABLE 148 ROW: ROBOTICS AND AUTOMATION ACTUATORS MARKET, BY REGION, 2022–2027 (USD MILLION)
             12.4.2 MIDDLE EAST
                        12.4.2.1 Market driven by increasing investments in oil & gas industry
                                     TABLE 149 MIDDLE EAST: ROBOTICS AND AUTOMATION ACTUATORS MARKET, BY TYPE, 2018–2021 (USD MILLION)
                                     TABLE 150 MIDDLE EAST: ROBOTICS AND AUTOMATION ACTUATORS MARKET, BY TYPE, 2022–2027 (USD MILLION)
                                     TABLE 151 MIDDLE EAST: ROBOTICS AND AUTOMATION ACTUATORS MARKET, BY ACTUATION, 2018–2021 (USD MILLION)
                                     TABLE 152 MIDDLE EAST: ROBOTICS AND AUTOMATION ACTUATORS MARKET, BY ACTUATION, 2022–2027 (USD MILLION)
                                     TABLE 153 MIDDLE EAST: ROBOTICS AND AUTOMATION ACTUATORS MARKET, BY APPLICATION, 2018–2021 (USD MILLION)
                                     TABLE 154 MIDDLE EAST: ROBOTICS AND AUTOMATION ACTUATORS MARKET, BY APPLICATION, 2022–2027 (USD MILLION)
             12.4.3 LATIN AMERICA
                        TABLE 155 LATIN AMERICA: ROBOTICS AND AUTOMATION ACTUATORS MARKET, BY TYPE, 2018–2021 (USD MILLION)
                        TABLE 156 LATIN AMERICA: ROBOTICS AND AUTOMATION ACTUATORS MARKET, BY TYPE, 2022–2027 (USD MILLION)
                        TABLE 157 LATIN AMERICA: ROBOTICS AND AUTOMATION ACTUATORS MARKET, BY ACTUATION, 2018–2021 (USD MILLION)
                        TABLE 158 LATIN AMERICA: ROBOTICS AND AUTOMATION ACTUATORS MARKET, BY ACTUATION, 2022–2027 (USD MILLION)
                        TABLE 159 LATIN AMERICA: ROBOTICS AND AUTOMATION ACTUATORS MARKET, BY APPLICATION, 2018–2021 (USD MILLION)
                        TABLE 160 LATIN AMERICA: ROBOTICS AND AUTOMATION ACTUATORS MARKET, BY APPLICATION, 2022–2027 (USD MILLION)
             12.4.4 AFRICA
                        TABLE 161 AFRICA: ROBOTICS AND AUTOMATION ACTUATORS MARKET, BY TYPE, 2018–2021 (USD MILLION)
                        TABLE 162 AFRICA: ROBOTICS AND AUTOMATION ACTUATORS MARKET, BY TYPE, 2022–2027 (USD MILLION)
                        TABLE 163 AFRICA: ROBOTICS AND AUTOMATION ACTUATORS MARKET, BY ACTUATION, 2018–2021 (USD MILLION)
                        TABLE 164 AFRICA: ROBOTICS AND AUTOMATION ACTUATORS MARKET, BY ACTUATION, 2022–2027 (USD MILLION)
                        TABLE 165 AFRICA: ROBOTICS AND AUTOMATION ACTUATORS MARKET, BY APPLICATION, 2018–2021 (USD MILLION)
                        TABLE 166 AFRICA: ROBOTICS AND AUTOMATION ACTUATORS MARKET, BY APPLICATION, 2022–2027 (USD MILLION)
 
13 COMPETITIVE LANDSCAPE (Page No. - 165)
     13.1 INTRODUCTION 
             TABLE 167 KEY DEVELOPMENTS BY LEADING PLAYERS IN ROBOTICS AND AUTOMATION ACTUATORS MARKET BETWEEN 2018 AND 2021
     13.2 REVENUE ANALYSIS OF TOP FIVE MARKET PLAYERS, 2021 
             FIGURE 35 REVENUE ANALYSIS OF LEADING PLAYERS IN ROBOTICS AND AUTOMATION ACTUATORS MARKET, 2021
     13.3 MARKET SHARE ANALYSIS OF LEADING PLAYERS, 2021 
             FIGURE 36 MARKET SHARE ANALYSIS OF LEADING PLAYERS, 2021
             TABLE 168 ROBOTICS AND AUTOMATION ACTUATORS MARKET: DEGREE OF COMPETITION
     13.4 COMPANY EVALUATION MATRIX 
             13.4.1 STARS
             13.4.2 EMERGING LEADERS
             13.4.3 PERVASIVE PLAYERS
             13.4.4 PARTICIPANTS
                        FIGURE 37 ROBOTICS AND AUTOMATION ACTUATORS MARKET: COMPANY EVALUATION MATRIX (KEY PLAYERS), 2021
             13.4.5 COMPANY FOOTPRINT
                        TABLE 169 ROBOTICS AND AUTOMATON ACTUATORS MARKET: COMPANY FOOTPRINT
                        TABLE 170 ROBOTICS AND AUTOMATION ACTUATORS MARKET: COMPANY APPLICATION FOOTPRINT
                        TABLE 171 ROBOTICS AND AUTOMATION ACTUATORS MARKET: COMPANY PRODUCT FOOTPRINT
                        TABLE 172 ROBOTICS AND AUTOMATION ACTUATORS MARKET: COMPANY REGION FOOTPRINT
     13.5 COMPANY EVALUATION MATRIX (STARTUPS/SMES) 
             13.5.1 PROGRESSIVE COMPANIES
             13.5.2 RESPONSIVE COMPANIES
             13.5.3 DYNAMIC COMPANIES
             13.5.4 STARTING BLOCKS
                        FIGURE 38 ROBOTICS AND AUTOMATION ACTUATORS MARKET: COMPANY EVALUATION MATRIX (STARTUPS/SMES), 2021
             13.5.5 COMPETITIVE BENCHMARKING
                        TABLE 173 ROBOTICS AND AUTOMATION ACTUATORS MARKET: KEY STARTUPS/SMES
                        TABLE 174 ROBOTICS AND AUTOMATION ACTUATORS MARKET: COMPETITIVE BENCHMARKING OF KEY STARTUPS/SMES
     13.6 COMPETITIVE SCENARIO 
             13.6.1 PRODUCT LAUNCHES/DEVELOPMENTS
                        TABLE 175 ROBOTICS AND AUTOMATION ACTUATORS MARKET: PRODUCT LAUNCHES/DEVELOPMENTS, NOVEMBER 2018–FEBRUARY 2022
             13.6.2 DEALS
                        TABLE 176 ROBOTICS AND AUTOMATION ACTUATORS MARKET, DEALS, NOVEMBER 2018–FEBRUARY 2022
 
14 COMPANY PROFILES (Page No. - 181)
     14.1 INTRODUCTION 
(Business overview, Products/Solutions/Services offered, Recent Developments, MnM view, Key strengths/right to win, Strategic choices made, Weaknesses and competitive threats) *   
     14.2 KEY PLAYERS 
             14.2.1 ABB
                        TABLE 177 ABB: BUSINESS OVERVIEW
                        FIGURE 39 ABB: COMPANY SNAPSHOT
                        TABLE 178 ABB: PRODUCTS/SOLUTIONS/SERVICES OFFERED
                        TABLE 179 ABB: DEALS
             14.2.2 ROCKWELL AUTOMATION
                        TABLE 180 ROCKWELL AUTOMATION: BUSINESS OVERVIEW
                        FIGURE 40 ROCKWELL AUTOMATION: COMPANY SNAPSHOT
                        TABLE 181 ROCKWELL AUTOMATION: PRODUCTS/SOLUTIONS/SERVICES OFFERED
                        TABLE 182 ROCKWELL AUTOMATION: DEALS
             14.2.3 MOOG
                        TABLE 183 MOOG: BUSINESS OVERVIEW
                        FIGURE 41 MOOG: COMPANY SNAPSHOT
                        TABLE 184 MOOG: PRODUCTS/SOLUTIONS/SERVICES OFFERED
                        TABLE 185 MOOG: PRODUCT DEVELOPMENTS
             14.2.4 EMERSON ELECTRIC CO.
                        TABLE 186 EMERSON ELECTRIC CO.: BUSINESS OVERVIEW
                        FIGURE 42 EMERSON ELECTRIC CO.: COMPANY SNAPSHOT
                        TABLE 187 EMERSON ELECTRIC CO.: PRODUCTS/SOLUTIONS/SERVICES OFFERED
             14.2.5 SMC
                        TABLE 188 SMC: BUSINESS OVERVIEWS
                        FIGURE 43 SMC: COMPANY SNAPSHOT
                        TABLE 189 SMC: PRODUCTS/SOLUTIONS/SERVICES OFFERED
                        TABLE 190 SMC: PRODUCT DEVELOPMENTS
             14.2.6 CURTISS-WRIGHT
                        TABLE 191 CURTISS-WRIGHT: BUSINESS OVERVIEW
                        FIGURE 44 CURTISS-WRIGHT: COMPANY SNAPSHOT
                        TABLE 192 CURTISS-WRIGHT: PRODUCTS/SOLUTIONS/SERVICES OFFERED
                        TABLE 193 CURTISS-WRIGHT: PRODUCT DEVELOPMENTS
                        TABLE 194 CURTISS WRIGHT: DEALS
             14.2.7 MISUMI GROUP INC.
                        TABLE 195 MISUMI GROUP INC.: BUSINESS OVERVIEW
                        FIGURE 45 MISUMI GROUP INC.: COMPANY SNAPSHOT
                        TABLE 196 MISUMI GROUP INC.: PRODUCTS/SOLUTIONS/SERVICES OFFERED
             14.2.8 ALTRA INDUSTRIAL MOTION
                        TABLE 197 ALTRA INDUSTRIAL MOTION: BUSINESS OVERVIEW
                        FIGURE 46 ALTRA INDUSTRIAL MOTION: COMPANY SNAPSHOT
                        TABLE 198 ALTRA INDUSTRIAL MOTION: PRODUCTS/SOLUTIONS/SERVICES OFFERED
                        TABLE 199 ALTRA INDUSTRIAL MOTION: PRODUCT DEVELOPMENTS
             14.2.9 TOLOMATIC
                        TABLE 200 TOLOMATIC: BUSINESS OVERVIEW
                        TABLE 201 TOLOMATIC: PRODUCTS/SOLUTIONS/SERVICES OFFERED
                        TABLE 202 TOLOMATIC: PRODUCT DEVELOPMENTS
             14.2.10 IAI
                        TABLE 203 IAI: BUSINESS OVERVIEW
                        TABLE 204 IAI: PRODUCTS/SOLUTIONS/SERVICES OFFERED
             14.2.11 SKF
                        TABLE 205 SKF: BUSINESS OVERVIEW
                        FIGURE 47 SKF: COMPANY SNAPSHOT
                        TABLE 206 SKF: PRODUCTS/SOLUTIONS/SERVICES OFFERED
                        TABLE 207 SKF: PRODUCT DEVELOPMENTS
                        TABLE 208 SKF: DEALS
             14.2.12 HARMONIC DRIVE LLC
                        TABLE 209 HARMONIC DRIVE LLC: BUSINESS OVERVIEW
                        TABLE 210 HARMONIC DRIVE LLC: PRODUCTS/SOLUTIONS/SERVICES OFFERED
                        TABLE 211 HARMONIC DRIVE LLC: PRODUCT DEVELOPMENTS
             14.2.13 NOOK INDUSTRIES, INC.
                        TABLE 212 NOOK INDUSTRIES, INC.: BUSINESS OVERVIEW
                        TABLE 213 NOOK INDUSTRIES, INC.: PRODUCTS/SOLUTIONS/SERVICES OFFERED
             14.2.14 KOLLMORGEN
                        TABLE 214 KOLLMORGEN: BUSINESS OVERVIEW
                        TABLE 215 KOLLMORGEN: PRODUCTS/SOLUTIONS/SERVICES OFFERED
             14.2.15 DVG AUTOMATION
                        TABLE 216 DVG AUTOMATION: BUSINESS OVERVIEW
                        TABLE 217 DVG AUTOMATION: PRODUCTS/SOLUTIONS/SERVICES OFFERED
             14.2.16 MACRON DYNAMICS
                        TABLE 218 MACRON DYNAMICS: BUSINESS OVERVIEW
                        TABLE 219 MACRON DYNAMICS: PRODUCTS/SOLUTIONS/SERVICES OFFERED
                        TABLE 220 MACRON DYNAMICS: PRODUCT DEVELOPMENTS
             14.2.17 ROTOMATION
                        TABLE 221 ROTOMATION: BUSINESS OVERVIEW
                        TABLE 222 ROTOMATION: PRODUCTS/SOLUTIONS/SERVICES OFFERED
             14.2.18 CEDRAT TECHNOLOGIES
                        TABLE 223 CEDRAT TECHNOLOGIES: BUSINESS OVERVIEW
                        TABLE 224 CEDRAT TECHNOLOGIES: PRODUCTS/SOLUTIONS/SERVICES OFFERED
             14.2.19 KINITICS AUTOMATION
                        TABLE 225 KINITCS AUTOMATION: BUSINESS OVERVIEW
                        TABLE 226 KINITCS AUTOMATION: PRODUCTS/SOLUTIONS/SERVICES OFFERED
                        TABLE 227 KINITICS AUTOMATION: PRODUCT DEVELOPMENTS
             14.2.20 FESTO
                        TABLE 228 FESTO: BUSINESS OVERVIEW
                        TABLE 229 FESTO: PRODUCTS/SOLUTIONS/SERVICES OFFERED
                        TABLE 230 FESTO: DEALS
             14.2.21 VENTURE MFG. CO.
                        TABLE 231 VENTURE MFG. CO.: BUSINESS OVERVIEW
                        TABLE 232 VENTURE MFG. CO.: PRODUCTS/SOLUTIONS/SERVICES OFFERED
*Details on Business overview, Products/Solutions/Services offered, Recent Developments, MnM view, Key strengths/right to win, Strategic choices made, Weaknesses and competitive threats might not be captured in case of unlisted companies.  
     14.3 OTHER PLAYERS 
             14.3.1 IMI PLC
                        TABLE 233 IMI PLC: COMPANY OVERVIEW
             14.3.2 FLOWSERVE CORPORATION
                        TABLE 234 FLOWSERVE CORPORATION: COMPANY OVERVIEW
             14.3.3 ROTORK
                        TABLE 235 ROTORK: COMPANY OVERVIEW
             14.3.4 AUMA
                        TABLE 236 AUMA: COMPANY OVERVIEW
 
15 APPENDIX (Page No. - 242)
     15.1 DISCUSSION GUIDE 
     15.2 KNOWLEDGESTORE: MARKETSANDMARKETS’ SUBSCRIPTION PORTAL 
     15.3 AVAILABLE CUSTOMIZATION 
     15.4 RELATED REPORTS 
     15.5 AUTHOR DETAILS 
 

Exhaustive secondary research was undertaken to collect information on the robotics and automation actuators market, its peer markets, and the parent market. The next step was to validate these findings, assumptions, and sizing with industry experts across the value chain through primary research. Both, the top-down and bottom-up approaches were employed to estimate the total market size. Thereafter, the market breakdown and data triangulation procedures were used to estimate the market size of segments and subsegments.

Secondary Research

In the secondary research process, various secondary sources, such as Hoovers, Bloomberg, BusinessWeek, and Drones Journals & Magazines were referred to, to identify and collect information for this study. Secondary sources included annual reports, press releases & investor presentations of companies, white papers, certified publications, articles by recognized authors, regulatory bodies, trade directories, and databases.

Primary Research

Substantial primary research was conducted after obtaining information on the robotics and automation actuators market scenario through secondary research. Various primary interviews were conducted with market experts from both, the demand and supply sides across major regions, namely, North America, Europe, and Asia Pacific (APAC). The primary data was collected through questionnaires, mails, and telephonic interviews.
Robotics and Automation Actuators Market   Size, and Share

To know about the assumptions considered for the study, download the pdf brochure

Market Size Estimation

Both, the top-down and bottom-up approaches were used to estimate and validate the size of the robotics and automation actuators market. These methods were also used extensively to estimate the sizes of various subsegments in the market. The research methodology used to estimate the market size included the following.

  • Key players in the market were identified through secondary research, and their market ranking determined through primary and secondary research. This included a study of annual and financial reports of the top market players and extensive interviews of leaders, including CEOs, directors, and marketing executives.
  • All percentage shares, splits, and breakdowns were determined using secondary sources and verified through primary sources.
  • All possible parameters that affect the markets covered in this research study were accounted for, viewed in extensive detail, verified through primary research, and analyzed to obtain the final quantitative and qualitative data. This data was consolidated, enhanced with detailed inputs, and analyzed by MarketsandMarkets and presented in this report.

Bottom- Up Approach

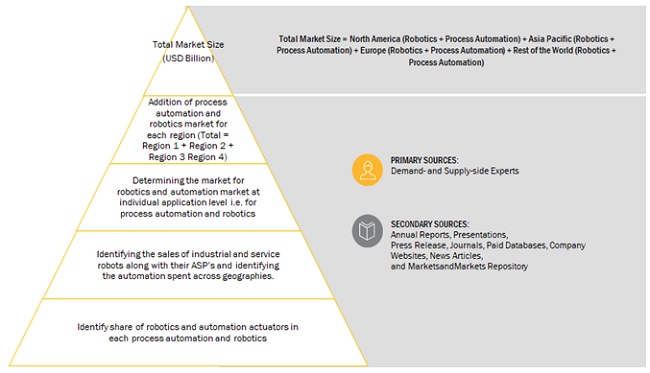
The bottom-up approach was employed to arrive at the overall size of the robotics and automation actuators market. The bottom-up approach has also been implemented to extract data from secondary research to validate revenues of various segments of the market. Market share has then been estimated for each company to verify revenue shares used earlier in the bottom-up approach. With the data triangulation procedure and validation of data through primaries, sizes of the parent market and each individual market have been determined and confirmed in this study.

Steps involved in the bottom-up approach:

  • The bottom-up approach was used to arrive at the regional splits of the robotics and automation actuators market.
  • The regional split of the global market was carried out based on the number of actuators used by each country. This approach was followed to arrive at the market size for robotics and automation actuators and was validated through various primary interviews
  • Market size of the robotics and automation actuators = {(spent on process automation) *(share of actuators in process automation)} + {(totals sales of robotics) *(share of actuators in process automation)}
  • Electric actuator = {(% share in robotics*market size for robotics) + (% share in process automation*market size for process automation)}
  • Linear actuator = {(% share in robotics*market size for robotics) + (% share in process automation*market size for process automation)}
  • Total market = {market for process automation + market for robotics}

Market Size Estimation Methodology: Bottom-Up Approach
Robotics and Automation Actuators Market   Size, and Share

Top-Down Approach

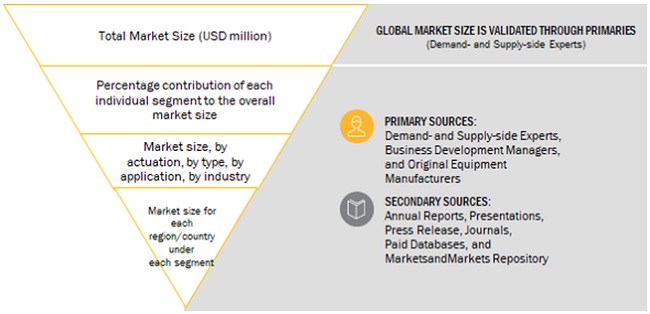
In the top-down approach, the overall market size was used to estimate the size of individual subsegments (mentioned in the market segmentation) through percentage splits in secondary and primary research. For the calculation of specific market segments, the most appropriate immediate market size was used to implement the top-down approach. The bottom-up approach has also been implemented to validate revenues obtained for various market segments.

Market Size Estimation Methodology: Top-Down Approach
Robotics and Automation Actuators Market   Size, and Share

Data Triangulation

After arriving at the overall market size from the market size estimation process, the total market was split into several segments and subsegments. Data triangulation and market breakdown procedures explained below were implemented, wherever applicable, to complete the overall market engineering process and arrive at the estimated numbers for robotics and automation actuators market segments and subsegments. The data was triangulated by studying various factors and trends from, both demand- and supply-sides. Along with this, the market size was validated using both, top-down and bottom-up approaches.

The Growing Significance of Robotics in the Automation Actuators Market

Robotics is playing a significant role in the automation actuators market. Its applications are diverse and can be found in various industries. One of the primary applications of robotics in this market is in the manufacturing industry, where it is used to automate processes such as assembly, welding, painting, and material handling. This results in increased efficiency, reduced errors, and improved quality and consistency of products.

Another industry that has benefited from the use of robotics in automation actuators is the automotive industry. Here, robots are used for tasks such as welding, painting, and assembly of parts, which results in increased production efficiency, reduced costs, and improved safety by eliminating the need for workers to perform hazardous tasks. Similarly, in the aerospace industry, robotics is used to automate various tasks such as drilling, riveting, and painting of aircraft components, leading to improved accuracy, consistency, and production efficiency.

The use of robotics in automation actuators is becoming increasingly common as technology continues to advance and the demand for automation increases. Its impact on various industries is significant, and the benefits it provides, such as increased efficiency, reduced costs, and improved safety, make it a valuable tool for businesses looking to improve their operations.

The Role of Robotics and Automation in Actuator Production Processes

Robotics and automation are the primary growth factors in the actuators industry. Automation and robotics are transforming the way actuators are produced, tested, and installed, resulting in increased production efficiency, reduced costs, and improved safety.

Robotics and automation are allowing manufacturers to automate the production process, reducing the need for manual labor and increasing production efficiency. The use of robots in the production of actuators reduces errors and improves consistency, leading to improved quality and lower costs. Additionally, robotics allows for more efficient testing of actuators, ensuring that they meet industry standards and are safe for use in a variety of applications.

Automation is also allowing for improved efficiency in the installation of actuators. By automating the installation process, manufacturers can reduce the time and cost associated with manual labor, while also ensuring that the installation is accurate and consistent. This results in improved quality and reduced costs for end-users.

Robotics and automation are driving growth in the actuators industry by improving production efficiency, reducing costs, and improving safety. As technology continues to advance, the use of robotics and automation in the production, testing, and installation of actuators is expected to become even more widespread, leading to further growth and innovation in the industry.

Report Objectives

  • To define, describe, and forecast the size of the market based on type, vertical, application and actuation along with a regional analysis.
  • To understand the structure of the Robotics and automation actuators market by identifying the subsegments
  • To provide detailed information about the key factors influencing the growth of the market (drivers, restraints, opportunities, challenges, and industry-specific challenges)
  • To analyze micromarkets with respect to individual growth trends, future prospects, and their contribution to the total market
  • To project the size of the market and its submarkets, in terms of value, with respect to the five regions (along with their respective key countries)
  • To profile key players and comprehensively analyze their core competencies
  • To understand the competitive landscape and identify major growth strategies adopted by players across key regions
  • To analyze competitive developments such as new product launches, contracts, agreements, acquisition, collaboration, and joint ventures in the Robotics and automation actuators market

Available Customizations

Along with the market data, MarketsandMarkets offers customizations as per the specific needs of companies. The following customization options are available for the report:

Product Analysis

  • Product matrix, which gives a detailed comparison of the product portfolio of each company

Regional Analysis

  • Further breakdown of the market segments at country-level

Company Information

  • Detailed analysis and profiling of additional market players (up to 5)
Custom Market Research Services

We will customize the research for you, in case the report listed above does not meet with your exact requirements. Our custom research will comprehensively cover the business information you require to help you arrive at strategic and profitable business decisions.

Request Customization

Instant Answers with GPT - Ask Now!

Ask real questions. Get complete answers !
Report Code
AS 6962
Published ON
Jun, 2022
Choose License Type
BUY NOW
  • SHARE
X
Request Customization
Speak to Analyst
Speak to Analyst
OR FACE-TO-FACE MEETING
PERSONALIZE THIS RESEARCH
  • Triangulate with your Own Data
  • Get Data as per your Format and Definition
  • Gain a Deeper Dive on a Specific Application, Geography, Customer or Competitor
  • Any level of Personalization
REQUEST A FREE CUSTOMIZATION
LET US HELP YOU!
  • What are the Known and Unknown Adjacencies Impacting the Robotics and Automation Actuators Market
  • What will your New Revenue Sources be?
  • Who will be your Top Customer; what will make them switch?
  • Defend your Market Share or Win Competitors
  • Get a Scorecard for Target Partners
CUSTOMIZED WORKSHOP REQUEST
knowledgestore logo

Want to explore hidden markets that can drive new revenue in Robotics and Automation Actuators Market?

Find Hidden Markets
  • Call Us
  • +1-888-600-6441 (Corporate office hours)
  • +1-888-600-6441 (US/Can toll free)
  • +44-800-368-9399 (UK office hours)
CONNECT WITH US
ABOUT TRUST ONLINE
©2024 MarketsandMarkets Research Private Ltd. All rights reserved
DMCA.com Protection Status
Website Feedback