PVC Additives Market by Type (Stabilizers, Impact Modifiers, Processing Aids, Lubricants, Plasticizers), Fabrication Process (Extrusion, Injection Molding), Application (Pipes & Fittings, Profiles & Tubing, Rigid Sheet & Panel) - Global Forecast to 2021


[162 Pages Report] The Global PVC Additives Market was valued at 2.88 Billion in 2015 and is projected to reach 4.08 Billion by 2021, at a CAGR of 6.0% from 2016 to 2021. In this report, 2015 is considered as the base year and the forecast period is from 2016 to 2021.
The objectives of this study are:
- To define, describe, and analyze the global PVC additives market on the basis of type, fabrication process, application, and region
- To forecast and analyze the market size (in terms of value and volume) and different submarkets in five regions, namely, Asia-Pacific, Europe, North America, South America, and the Middle East & Africa
- To forecast and analyze the market at the country-level for each region
- To strategically analyze each submarket with respect to individual growth trends and its contribution to the global PVC additives market
- To analyze opportunities in the market for stakeholders by identifying high growth segments of the global PVC additives market
- To identify significant trends and factors driving or inhibiting the growth of the market and submarkets
- To analyze competitive developments, such as expansions, joint ventures, new products launches, agreements, and mergers & acquisitions in the global PVC additives market
- To strategically profile key market players and comprehensively analyze their growth strategies
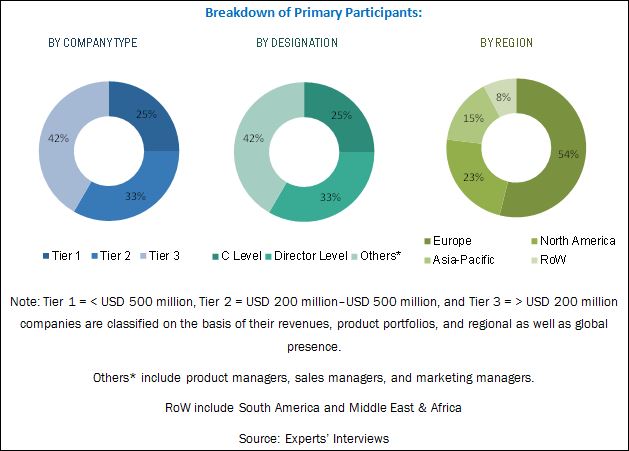
This technical, market-oriented, and commercial research study of the global PVC additives market involves extensive use of secondary sources, directories, and databases (such as Hoovers, Bloomberg BusinessWeek, and Factiva) to identify and collect information. The primary sources mainly include several industry experts from core and related industries and preferred suppliers, manufacturers, distributors, service providers, and organizations related to all segments of the industry�s supply chain. After arriving at the overall market size, the total market has been split into several segments. The figure below illustrates the breakdown of the primary interviews based on company type, designation, and region conducted during the research study:
To know about the assumptions considered for the study, download the pdf brochure
Asia-Pacific is the fastest-growing market for PVC additives due to the high production and consumption of PVC in this region. Increase in infrastructure activities and the replacement of conventional materials such as steel, concrete, and iron with lightweight plastics are factors driving the growth of the PVC additives market. Key manufacturers of PVC additives includes Kaneka Corporation (Japan), Arkema S.A. (France), BASF SE (Germany), Songwon Industrial Co., Ltd. (South Korea), Akzo Nobel N.V. (Netherlands), Adeka Corporation (Japan), and Clariant AG (Switzerland).
Target audiences for the PVC additives market report:
- PVC Additives Manufacturers
- PVC Additives Suppliers
- Raw Material Suppliers
- Investment Banks
- Government Bodies
Scope of the Report
This report categorizes the global PVC additives market on the basis of type, fabrication process, application, and region.
PVC Additives Market, By Type:
- Stabilizers
- Impact Modifiers
- Processing Aids
- Plasticizers
- Lubricants
- Others
PVC Additives Market, By Fabrication Process:
- Extrusion
- Injection Molding
- Others
PVC Additives Market, By Application:
- Pipes & Fittings
- Profiles & Tubing
- Rigid Sheet & Panel
- Wires & Cables
- Bottles
- Others
PVC Additives Market, By Region:
- Asia-Pacific
- Europe
- North America
- Middle East & Africa
- South America
Available Customizations:
With the given market data, MarketsandMarkets offers customizations according to the company�s specific needs. The following customization options are available for the report:
Regional Analysis
- Further breakdown of a region with respect to a particular country, additional application, fabrication process, and/or type
Country Information
- Additional country information (up to three)
Company Information
- Detailed analysis and profiles of additional market players (up to five)
The global PVC additives market was valued at USD 3.05 Billion in 2016, and is projected to reach USD 4.08 Billion by 2021, at a CAGR of 6.0% during the forecast period. The replacement of conventional materials with PVC and the high demand for additive-based PVC are factors anticipated to drive the growth of the global PVC additives market.
On the basis of type, the global PVC additives market has been classified into stabilizers, impact modifiers, processing aids, lubricants, plasticizers, and others. The stabilizers segment is expected to lead the global PVC additives market during the forecast period, followed by the lubricants segment. The stabilizers segment is anticipated to grow at the highest CAGR between 2016 and 2021, owing to the increasing usage of stabilizers in pipes & fittings, rigid & semi-rigid films, window profiles, wires & cables, medical, and consumer goods, among other applications.
Based on fabrication process, the global PVC additives market has been segmented into extrusion, injection molding, and others. The extrusion segment is expected to be the fastest-growing fabrication process segment, owing to the increase in manufacturing of high volumes of extruded PVC at minimal cost.
Based on application, the global PVC additives market has been segmented into pipes & fittings, profiles & tubing, rigid sheet & panel, wires & cables, bottles, and others. The pipes & fittings segment is the fastest-growing application segment of the global PVC additives market. PVC additives are widely utilized in PVC pipes & fittings, due to the rising demand for the replacement of conventional concrete, iron, and steel-based pipes & fittings with PVC pipes in the building & construction industry.
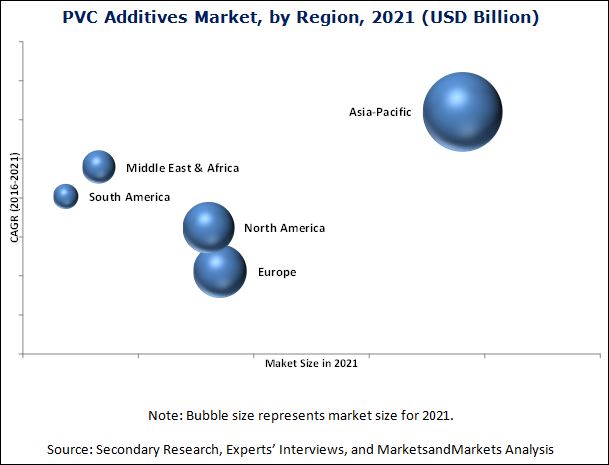
On the basis of region, the global PVC additives market has been classified into Asia-Pacific, Europe, North America, the Middle East & Africa, and South America. The Asia-Pacific region is the largest market for PVC additives. Rapid industrialization and improved living standards are factors anticipated to drive the increasing demand for PVC additives in this region. In addition, the increasing applicability of PVC additives in the building & construction industry is further expected to drive the growth of the Asia-Pacific PVC additives market.
One of the major factors restraining the growth of the global PVC additives market is the low R&D expenditure in emerging markets, which impacts the quality of PVC additives. Some of the key players operating in the global PVC additives market include Kaneka Corporation (Japan), Arkema S.A. (France), BASF SE (Germany), Songwon Industrial Co., Ltd. (South Korea), Akzo Nobel N.V. (Netherlands), Adeka Corporation (Japan), Clariant AG (Switzerland), Pau Tai Industrial Corporation (Taiwan), Baerlocher GmbH (Germany), and Shandong Ruifeng Chemical Co., Ltd. (China), among others.
To speak to our analyst for a discussion on the above findings, click Speak to Analyst
 Exclusive indicates content/data unique to MarketsandMarkets and not available with any competitors.
Table of Contents
1 Introduction (Page No. - 15)
1.1 Objectives of the Study
1.2 Market Definition
1.3 Market Scope
1.3.1 Markets Covered
1.3.2 Years Considered for the Study
1.4 Currency
1.5 Package Size
1.6 Limitations
1.7 Stakeholders
2 Research Methodology (Page No. - 19)
2.1 Research Data
2.1.1 Secondary Data
2.1.1.1 Key Data From Secondary Sources
2.1.2 Primary Data
2.1.2.1 Key Data From Primary Sources
2.1.2.2 Key Industry Insights
2.1.2.3 Breakdown of Primary Interviews
2.2 Market Size Estimation
2.2.1 Bottom-Up Approach
2.2.2 Top-Down Approach
2.3 Data Triangulation
2.4 Research Assumptions
3 Executive Summary (Page No. - 27)
4 Premium Insights (Page No. - 31)
4.1 Significant Opportunities in PVC Additives Market
4.2 PVC Additives Market, By Region
4.3 PVC Additives Market in Asia-Pacific, By Country and Application
4.4 PVC Additives Market, By Application and Region
5 Market Overview (Page No. - 34)
5.1 Introduction
5.2 Market Dynamics
5.2.1 Impact Analysis
5.2.2 Drivers
5.2.2.1 Replacement of Conventional Material With PVC
5.2.2.2 High Demand for Additive-Based PVC
5.2.3 Restraints
5.2.3.1 Low R&D Expenditure in the Emerging Markets
5.2.4 Opportunities
5.2.4.1 Increasing Demand From Applications in Construction, Medical, and Automotive Industries
5.3 Porter�s Five Forces Analysis
5.3.1 Threat of New Entrants
5.3.2 Threat of Substitutes
5.3.3 Bargaining Power of Suppliers
5.3.4 Bargaining Power of Buyers
5.3.5 Intensity of Competitive Rivalry
5.4 Industry Outlook
5.4.1 Packaging
5.4.2 Automotive
5.4.3 Construction
6 PVC Additives Market, By Type (Page No. - 43)
6.1 Introduction
6.2 Stabilizers
6.2.1 Lead Stabilizers
6.2.2 Mixed Metal Stabilizers
6.2.3 Tin Stabilizers
6.2.4 Organic Stabilizers
6.3 Impact Modifiers
6.3.1 Acrylonitrile Butadiene Styrene (ABS)
6.3.2 Acrylic Impact Modifier (AIM)
6.3.3 Methacrylate-Butadiene-Styrene (MBS)
6.3.4 Ethylene Propylene Diene Monomer (EPDM)
6.3.5 Acrylonitrile Styrene Acrylate (ASA)
6.3.6 Chlorinated Polyethylene (CPE)
6.4 Plasticizers
6.4.1 Phthalates
6.4.1.1 Low Phthalates
6.4.1.2 High Phthalates
6.4.2 Non- Phthalates
6.5 Processing Aids
6.5.1 Low Molecular Weight (LMW) Processing Aid
6.5.2 Medium Molecular Weight (MMW) Processing Aid
6.5.3 High Molecular Weight (Hmw) Processing Aid
6.5.4 Ultra-High Molecular Weight (UHMW) Processing Aid
6.6 Lubricants
6.6.1 External Lubricants
6.6.2 Internal Lubricants
6.7 Others
6.7.1 Fillers
6.7.2 Antioxidants
6.7.3 Optical Brighteners
7 PVC Additives Market, By Fabrication Process (Page No. - 60)
7.1 Introduction
7.2 Fabrication Process Revenue Pocket Matrix
7.3 Extrusion
7.3.1 Sheet & Film
7.3.2 Tubing
7.3.3 Blown Film
7.3.4 Over Jacketing Extrusion
7.3.5 Coextrusion
7.3.6 Extrusion Coating
7.4 Injection Molding
7.4.1 2k Molding
7.4.2 Structural Foam Molding
7.4.3 Gas-Assisted Molding
7.5 Others
7.5.1 Thermoforming
7.5.2 Calendering
8 PVC Additives Market, By Application (Page No. - 70)
8.1 Introduction
8.2 Revenue Pocket Matrix
8.3 Pipes & Fittings
8.3.1 Water, Wastewater, and Drainage
8.3.2 Irrigation
8.3.3 Electrical
8.3.4 Others
8.4 Profiles & Tubing
8.4.1 Medical and Surgical
8.4.2 Automotive Interior and Exterior
8.4.3 Construction Fittings
8.4.4 Others
8.5 Rigid Sheets & Panels
8.5.1 Rigid PVC
8.5.2 Panels
8.5.2.1 Doors & Windows
8.5.2.2 Sidings
8.5.2.3 Fences & Fenestration
8.6 Wires & Cables
8.7 Bottles
8.8 Others
9 PVC Additives Market, By Region (Page No. - 84)
9.1 Introduction
9.2 Asia-Pacific
9.2.1 China
9.2.2 Japan
9.2.3 Taiwan
9.2.4 South Korea
9.2.5 India
9.2.6 Australia & New Zealand
9.2.7 Indonesia
9.3 Europe
9.3.1 Germany
9.3.2 Italy
9.3.3 France
9.3.4 Spain
9.3.5 U.K.
9.4 North America
9.4.1 U.S.
9.4.2 Mexico
9.4.3 Canada
9.5 Middle East & Africa
9.5.1 Saudi Arabia
9.5.2 Iran
9.5.3 South Africa
9.6 South America
9.6.1 Brazil
9.6.2 Argentina
9.6.3 Chile
10 Competitive Landscape (Page No. - 127)
10.1 Overview
10.2 Market Share Analysis of Key Players
10.2.1 Kaneka Corporation
10.2.2 Arkema SA
10.2.3 BASF SE
10.2.4 Akzo Nobel N.V.
10.2.5 Chinese Manufacturers
10.3 Competitive Benchmarking
10.4 Competitive Situation and Trends
10.4.1 Expansions
10.4.2 New Product Launches
10.4.3 Agreements
10.4.4 Mergers & Acquisitions
10.4.5 Joint Ventures
11 Company Profiles (Page No. - 133)
(Overview, Financial*, Products & Services, Strategy, and Developments)
11.1 Kaneka Corporation
11.2 Arkema SA
11.3 BASF SE
11.4 Songwon Industrial Co. Ltd.
11.5 Akzo Nobel N.V.
11.6 Adeka Corporation
11.7 Clariant AG
11.8 PAU Tai Industrial Corporation
11.9 Baerlocher GmbH
11.10 Shandong Ruifeng Chemical Co. Ltd.
11.11 Other Market Players
11.11.1 Akdeniz Kimya A.S. (Turkey)
11.11.2 Shandong Rike Chemicals Co., Ltd. (China)
11.11.3 Novista Group (China)
11.11.4 Indofil Industries Limited (India)
11.11.5 En-Door (China)
11.11.6 Sun Ace (Singapore)
11.11.7 Patcham FZC (UAE)
11.11.8 Valtris Specialty Chemicals (U.S.)
*Details Might Not Be Captured in Case of Unlisted Companies
12 Appendix (Page No. - 153)
12.1 Insights From Industry Experts
12.2 Discussion Guide
12.3 Knowledge Store: Marketsandmarkets� Subscription Portal
12.4 Introducing RT: Real-Time Market Intelligence
12.5 Available Customizations
12.6 Related Reports
12.7 Author Details
List of Tables (114 Tables)
Table 1 PVC Additives Market Size, By Type, 2014�2021 (USD Million)
Table 2 Market Size, By Type, 2014�2021 (Kiloton)
Table 3 Stabilizers Market Size, By Region, 2014�2021 (USD Million)
Table 4 Stabilizers Market Size, By Region, 2014�2021 (Kiloton)
Table 5 Impact Modifiers Market Size, By Region, 2014�2021 (USD Million)
Table 6 Impact Modifiers Market Size, By Region, 2014�2021 (Kiloton)
Table 7 Plasticizers Market Size, By Region, 2014�2021 (USD Million)
Table 8 Plasticizers Market Size, By Region, 2014�2021 (Kiloton)
Table 9 Processing Aids Market Size, By Region, 2014�2021 (USD Million)
Table 10 Processing Aids Market Size, By Region, 2014�2021 (Kiloton)
Table 11 Lubricants Market Size, By Region, 2014�2021 (USD Million)
Table 12 Lubricants Market Size, By Region, 2014�2021 (Kiloton)
Table 13 Other PVC Additives Market Size, By Region, 2014�2021 (USD Million)
Table 14 Other Market Size, By Region, 2014�2021 (Kiloton)
Table 15 Market Size, By Fabrication Process, 2014�2021 (USD Million)
Table 16 Market Size, By Fabrication Process, 2014�2021 (Kiloton)
Table 17 Market Size in Extrusion Fabrication Process, By Region, 2014�2021 (USD Million)
Table 18 Market Size in Extrusion Fabrication Process, By Region, 2014�2021 (Kiloton)
Table 19 Market Size in Injection Molding Fabrication Process, By Region, 2014�2021 (USD Million)
Table 20 Market Size in Injection Molding Fabrication Process, By Region, 2014�2021 (Kiloton)
Table 21 Market Size in Other Fabrication Processes, By Region, 2014�2021 (USD Million)
Table 22 Market Size in Other Fabrication Processes, By Region, 2014�2021 (Kiloton)
Table 23 Market Size, By Application, 2014�2021 (USD Million)
Table 24 Market Size, By Application, 2014�2021 (Kiloton)
Table 25 Market Size in Pipes & Fittings, By Region, 2014�2021 (USD Million)
Table 26 Market Size in Pipes & Fittings, By Region, 2014�2021 (Kiloton)
Table 27 Market Size in Profiles & Tubing, By Region, 2014�2021 (USD Million)
Table 28 Market Size in Profiles & Tubing, By Region, 2014�2021 (Kiloton)
Table 29 Market Size in Rigid Sheets & Panels, By Region, 2014�2021 (USD Million)
Table 30 Market Size in Rigid Sheets & Panels, By Region, 2014�2021 (Kiloton)
Table 31 Market Size in Wires & Cables, By Region, 2014�2021 (USD Million)
Table 32 Market Size in Wires & Cables, By Region, 2014�2021 (Kiloton)
Table 33 Market Size in Bottles, By Region, 2014�2021 (USD Million)
Table 34 Market Size in Bottles, By Region, 2014�2021 (Kiloton)
Table 35 Market Size in Other Applications, By Region, 2014�2021 (USD Million)
Table 36 Market Size in Other Applications, By Region, 2014�2021 (Kiloton)
Table 37 Market Size, By Region, 2014�2021 (USD Million)
Table 38 Market Size, By Region, 2014�2021 (Kiloton)
Table 39 Asia-Pacific: PVC Additives Market Size, By Country, 2014�2021 (USD Million)
Table 40 Asia-Pacific: Market Size, By Country, 2014�2021 (Kiloton)
Table 41 Asia-Pacific: Market Size, By Type, 2014�2021 (USD Million)
Table 42 Asia-Pacific: Market Size, By Type, 2014�2021 (Kiloton)
Table 43 Asia-Pacific: Market Size, By Fabrication Process, 2014�2021 (USD Million)
Table 44 Asia-Pacific: Market Size, By Fabrication Process, 2014�2021 (Kiloton)
Table 45 Asia-Pacific: Market Size, By Application, 2014�2021 (USD Million)
Table 46 Asia-Pacific: Market Size, By Application, 2014�2021 (Kiloton)
Table 47 China: PVC Additives Market Size, By Application, 2014�2021 (USD Million)
Table 48 China: Market Size, By Application, 2014�2021 (Kiloton)
Table 49 Japan: PVC Additives Market Size, By Application, 2014�2021 (USD Million)
Table 50 Japan: Market Size, By Application, 2014�2021 (Kiloton)
Table 51 Taiwan: PVC Additives Market Size, By Application, 2014�2021 (USD Million)
Table 52 Taiwan: Market Size, By Application, 2014�2021 (Kiloton)
Table 53 Europe: PVC Additives Market Size, By Country, 2014�2021 (USD Million)
Table 54 Europe: Market Size, By Country, 2014�2021 (Kiloton)
Table 55 Europe: Market Size, By Type, 2014�2021 (USD Million)
Table 56 Europe: Market Size, By Type, 2014�2021 (Kiloton)
Table 57 Europe: Market Size, By Fabrication Process, 2014�2021 (USD Million)
Table 58 Europe: Market Size, By Fabrication Process, 2014�2021 (Kiloton)
Table 59 Europe: Market Size, By Application, 2014�2021 (USD Million)
Table 60 Europe: Market Size, By Application, 2014�2021 (Kiloton)
Table 61 Germany: PVC Additives Market Size, By Application, 2014�2021 (USD Million)
Table 62 Germany: Market Size, By Application, 2014�2021 (Kiloton)
Table 63 Italy: PVC Additives Market Size, By Application, 2014�2021 (USD Million)
Table 64 Italy: Market Size, By Application, 2014�2021 (Kiloton)
Table 65 France: PVC Additives Market Size, By Application, 2014�2021 (USD Million)
Table 66 France: Market Size, By Application, 2014�2021 (Kiloton)
Table 67 North America: PVC Additives Market Size, By Country, 2014�2021 (USD Million)
Table 68 North America: Market Size, By Country, 2014�2021 (Kiloton)
Table 69 North America: Market Size, By Type, 2014�2021 (USD Million)
Table 70 North America: Market Size, By Type, 2014�2021 (Kiloton)
Table 71 North America: Market Size, By Fabrication Process, 2014�2021 (USD Million)
Table 72 North America: Market Size, By Fabrication Process, 2014�2021 (Kiloton)
Table 73 North America: Market Size, By Application, 2014�2021 (USD Million)
Table 74 North America: Market Size, By Application, 2014�2021 (Kiloton)
Table 75 U.S.: PVC Additives Market Size, By Application, 2014�2021 (USD Million)
Table 76 U.S.: Market Size, By Application, 2014�2021 (Kiloton)
Table 77 Mexico: PVC Additives Market Size, By Application, 2014�2021 (USD Million)
Table 78 Mexico: Market Size, By Application, 2014�2021 (Kiloton)
Table 79 Canada: PVC Additives Market Size, By Application, 2014�2021 (USD Million)
Table 80 Canada: Market Size, By Application, 2014�2021 (Kiloton)
Table 81 Middle East & Africa: PVC Additives Market Size, By Country, 2014�2021 (USD Million)
Table 82 Middle East & Africa: Market Size, By Country, 2014�2021 (Kiloton)
Table 83 Middle East & Africa: Market Size, By Type, 2014�2021 (USD Million)
Table 84 Middle East & Africa: Market Size, By Type, 2014�2021 (Kiloton)
Table 85 Middle East & Africa: Market Size, By Fabrication Process, 2014�2021 (USD Million)
Table 86 Middle East & Africa: Market Size, By Fabrication Process, 2014�2021 (Kiloton)
Table 87 Middle East & Africa: Market Size, By Application, 2014�2021 (USD Million)
Table 88 Middle East & Africa: Market Size, By Application, 2014�2021 (Kiloton)
Table 89 Saudi Arabia: PVC Additives Market Size, By Application, 2014�2021 (USD Million)
Table 90 Saudi Arabia: Market Size, By Application, 2014�2021 (Kiloton)
Table 91 Iran: PVC Additives Market Size, By Application, 2014�2021 (USD Million)
Table 92 Iran: Market Size, By Application, 2014�2021 (Kiloton)
Table 93 South Africa: PVC Additives Market Size, By Application, 2014�2021 (USD Million)
Table 94 South Africa: Market Size, By Application, 2014�2021 (Kiloton)
Table 95 South America: Market Size, By Country, 2014�2021 (USD Million)
Table 96 South America: Market Size, By Country, 2014�2021 (Kiloton)
Table 97 South America: Market Size, By Type, 2014�2021 (USD Million)
Table 98 South America: Market Size, By Type, 2014�2021 (Kiloton)
Table 99 South America: Market Size, By Fabrication Process, 2014�2021 (USD Million)
Table 100 South America: Market Size, By Fabrication Process, 2014�2021 (Kiloton)
Table 101 South America: Market Size, By Application, 2014�2021 (USD Million)
Table 102 South America: Market Size, By Application, 2014�2021 (Kiloton)
Table 103 Brazil: PVC Additives Market Size, By Application, 2014�2021 (USD Million)
Table 104 Brazil: Market Size, By Application, 2014�2021 (Kiloton)
Table 105 Argentina: PVC Additives Market Size, By Application, 2014�2021 (USD Million)
Table 106 Argentina: Market Size, By Application, 2014�2021 (Kiloton)
Table 107 Chile: PVC Additives Market Size, By Application, 2014�2021 (USD Million)
Table 108 Chile: Market Size, By Application, 2014�2021 (Kiloton)
Table 109 Brand Influence on PVC Additives Market
Table 110 Expansions, 2014�2016
Table 111 New Product Launches, 2014�2016
Table 112 Agreements, 2014�2016
Table 113 Mergers & Acquisitions, 2014�2016
Table 114 Joint Ventures, 2014�2016
List of Figures (63 Figures)
Figure 1 PVC Additives Market: Research Design
Figure 2 Key Industry Insights
Figure 3 Breakdown of Primary Interviews: By Company Type, Designation and Region
Figure 4 Market Size Estimation: Bottom-Up Approach
Figure 5 Market Size Estimation: Top-Down Approach
Figure 6 PVC Additives Market: Data Triangulation
Figure 7 Stabilizers to Be the Largest PVC Additives Type Between 2016 and 2021
Figure 8 Extrusion to Be the Largest Fabrication Process Between 2016 and 2021
Figure 9 Pipes & Fittings to Be the Largest Application Between 2016 and 2021
Figure 10 Asia-Pacific to Be the Fastest-Growing Market of PVC Additives Between 2016 and 2021
Figure 11 Market of PVC Additives to Register High Growth between 2016 and 2021
Figure 12 Asia-Pacific to Be the Key Additives Market Between 2016 and 2021
Figure 13 Market of PVC Additives in Pipes & Fittings in Asia-Pacific Accounted for the Largest Share in 2015
Figure 14 Asia-Pacific Market in PVC Additives Accounted for Major Share in Pipes & Fittings, in 2015
Figure 15 Overview of Factors Governing PVC Additives Market
Figure 16 Porter�s Five Forces Analysis
Figure 17 Packaging Industry, By Region, 2015
Figure 18 Vehicles Production, By Region, 2015
Figure 19 Construction Industry Growth Rate, 2014
Figure 20 Stabilizers to Dominate the Market of PVC Additives Between 2016 and 2021
Figure 21 Asia-Pacific to Be the Largest Market for Stabilizers Between 2016 and 2021
Figure 22 Europe to Be the Second-Largest Market for Impact Modifiers Between 2016 and 2021
Figure 23 Asia-Pacific to Be the Largest Market for Plasticizers Between 2016 and 2021
Figure 24 North America to Be the Second-Largest Market for Processing Aids Between 2016 and 2021
Figure 25 Asia-Pacific to Be the Largest Lubricants Market in PVC Additives Between 2016 and 2021
Figure 26 Asia-Pacific to Be the Largest Market for Other PVC Additives Between 2016 and 2021
Figure 27 Extrusion Fabrication Process to Dominate the Market of PVC Additives Between 2016 and 2021
Figure 28 Revenue Pocket Matrix: By Fabrication Process
Figure 29 Asia-Pacific to Be the Largest Market for PVC Additives in Extrusion Between 2016 and 2021
Figure 30 Europe to Be the Second-Largest Market for PVC Additives in the Injection Molding Process Between 2016 and 2021
Figure 31 Asia-Pacific to Dominate the Market of PVC Additives in Other Fabrication Processes Between 2016 and 2021
Figure 32 Pipes & Fittings to Dominate the Market of PVC Additives Between 2016 and 2021
Figure 33 Revenue Pocket Matrix, By Application
Figure 34 Asia-Pacific to Be the Largest Market of PVC Additives for Pipes & Fittings Application Between 2016 and 2021
Figure 35 Europe to Be the Second-Largest Market of PVC Additives in Profiles & Tubing Between 2016 and 2021
Figure 36 Asia-Pacific to Drive the Market of PVC Additives in Rigid Sheets & Panels Application Between 2016 and 2021
Figure 37 Asia-Pacific to Be the Largest Market for PVC Additives in Wires & Cables Between 2016 and 2021
Figure 38 Europe to Be the Second-Largest Market of PVC Additives in Bottles Between 2016 and 2021
Figure 39 Asia-Pacific to Be the Largest Market of PVC Additives in Other Applications Between 2016 and 2021
Figure 40 China, Taiwan, and India are the Emerging PVC Additives Markets
Figure 41 China Dominates Market of PVC Additives in Asia-Pacific
Figure 42 South Korea: Market Size, 2014�2021
Figure 43 India: Market Size, 2014�2021
Figure 44 Australia & New Zealand: Market Size, 2014�2021
Figure 45 Indonesia Market Size, 2014�2021
Figure 46 Germany to Register the Highest CAGR in European Market of PVC Additives
Figure 47 Spain Market Size, 2014�2021
Figure 48 U.K.: Market Size, 2014�2021
Figure 49 U.S. Dominates Market of PVC Additives in North America
Figure 50 New Product Launches Was the Most Preferred Growth Strategy Adopted By Key Players
Figure 51 Kaneka Corporation Was the Leading Market Player in 2015
Figure 52 Kaneka Corporation: Company Snapshot
Figure 53 Kaneka Corporation: SWOT Analysis
Figure 54 Arkema SA: Company Snapshot
Figure 55 Arkema SA: SWOT Analysis
Figure 56 BASF SE: Company Snapshot
Figure 57 BASF SE: SWOT Analysis
Figure 58 Songwon Industrial Co. Ltd.: Company Snapshot
Figure 59 Songwon Industrial Co. Ltd.: SWOT Analysis
Figure 60 Akzo Nobel N.V.: Company Snapshot
Figure 61 Akzo Nobel N.V.: SWOT Analysis
Figure 62 Adeka Corporation: Company Snapshot
Figure 63 Clariant AG: Company Snapshot


Growth opportunities and latent adjacency in PVC Additives Market