Motor Lamination Market

Motor Lamination Market by Application (Performance, Comfort, and Safety), Material, Technology, Motor Type (Power Steering & Window, Adaptive front light), ICE & Electric Vehicle, ATV by Application and Region - Global Forecast to 2027

Report Code: AT 6928 Dec, 2022, by marketsandmarkets.com

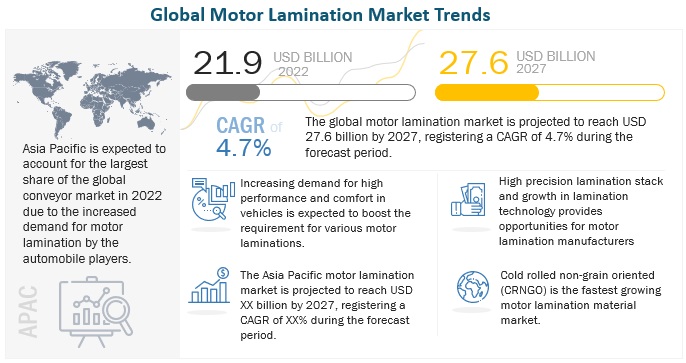
[271 Pages Report] The motor lamination market is estimated to grow from USD 21.9 billion in 2022 to reach USD 27.6 billion by 2027 at a CAGR of 4.7% during the forecast period. The market growth is seen mainly due to the growing demand for luxury vehicle sales across different geographies. Growing safety standards and increased demand for comfort applications are also boosting the demand for motors and lamination stacks globally.
Motor Lamination Market

To know about the assumptions considered for the study, Request for Free Sample Report

Motor Lamination Market Dynamics

Driver: Transition to e-mobility solutions and increase in usage of electric motors will drive the motor lamination market

Environmental degradation and air pollution are the major concerns faced by the world today. Growing awareness of the harmful effects of vehicular emissions has forced automotive manufacturers to develop vehicles that comply with regional regulatory standards. Increasing stringency of emission norms has resulted in increased sales of electric vehicles such as BEVs, HEVs, and PHEVs. According to data from the Federation of Automobile Dealers Associations, retail electric vehicle (EV) sales increased threefold in 2021-22 (April-March) (FADA). Also, despite supply chain bottlenecks and the ongoing Covid-19 pandemic, electric car sales set a new high in 2021. Sales nearly doubled to 6.6 million (a sales share of nearly 9%) compared to 2020, bringing the total number of electric vehicles on the road to 16.5 million. With the increasing demand for electric vehicles, the demand for certain stacks will register an increase simultaneously, considering the increasing demand for performance motors with advanced silicon-based materials and high-performance electrical steels for motor laminations. All these factors substantiate the growth in demand for motors and, subsequently, the lamination technologies, which will drive the market growth.

Restraint: Higher up-front investments in lamination technologies

The manufacturing of lamination sheets involves several steps that include bonding, welding, and stamping. Once magnetic metals are processed, they turn into thin lamination sheets. All these steps in developing, producing, and distributing motor laminations require heavy investments in acquiring new technological stamping, bonding, and welding machines. The maintenance and replacement cost is also considered a capital investment. Companies such as R. Bourgeois and Tempel have adopted advanced technologies such as the Full-bond technique and Dots or the Glulock technology to increase the efficiency and productivity of motors. Advanced machines for lamination stacks involve high costs and highly specialized manufacturing and assembly processes. For example, a stacked stator lamination welding machine costs around USD 30,000, and a motor lamination manufacturing stamping and notching machine costs around USD 50,000.

Furthermore, these machines have a high operating cost. These machines' power requirement is high, resulting in high power consumption. Thus, these factors can negatively impact market growth and act as a restraining factor in the motor lamination market.

Opportunity: Advancement in lamination technologies with better operational efficiency

Lamination sheets are magnetic metal sheets with properties that exhibit higher operational effectiveness under various conditions. The quality of lamination sheets depends on the output of an electric motor. With time, the technology of manufacturing lamination sheets has undergone many changes to reduce fabrication costs and operational time. Techniques such as bonding, stamping, and welding are mainly used to make lamination sheets. The rotor and stator can be made from the same material with the help of precision techniques. The full bond technique and dots technology/ glulock are expected to impact the lamination market significantly. The developments in lamination technologies with better performance will drive the demand for motor laminations during the forecast period.

Challenges: Transition to newer technologies with higher cost

As electric motors are available in different sizes, there is no standard process to manufacture motor lamination. Manufacturers choose technology. Stamping, welding, and bonding of lamination sheets are commonly used technologies. For example, bonding offers many benefits, such as joining magnets and lamination stacks, joining shaft and rotor, and joining stator and housing. Advancements in technology have led to innovations in the manufacturing of lamination sheets/stacks. Companies such as R. Bourgeois have adopted new technologies such as glue bond technology and Backlack technology for producing laminations. Maintenance and repair costs and the resources invested in acquiring skilled labor add to the overall cost. Thus, adopting new technologies is a key challenge for lamination stack manufacturers.

Motor Lamination Market Ecosystem
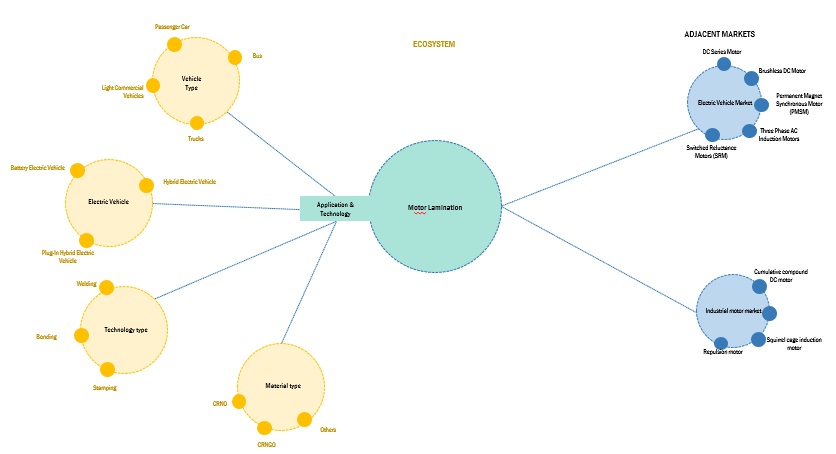
Motor Lamination Market

To know about the assumptions considered for the study, download the pdf brochure

BEV segment for the motor lamination market is estimated to be the largest market during the forecast period

Global BEV sales increased significantly in recent years and have shown strong growth despite the COVID-19 pandemic. Around 4.3 million new batteries-powered EVs (BEVs) and plug-in hybrid electric vehicles (PHEVs) were sold worldwide in the first six months of 2022. BEV sales grew by 75% in the January-June 2022 period. The growth is mainly attributed to the expansion of BEV models to new segments in most regions, continued purchase incentives, and stringent emission standards. According to World Economic Forum, an EU-wide ban on sales of petrol and diesel cars will come into force by 2035, while the UK has brought its phase-out date forward to 2030 from 2035. China, the world’s biggest car market, aims for 40% of vehicles sold in the country to be electric by 2030. Thus, growing BEV sales, the demand for motor laminations is expected to grow in the coming years. Also, according to primary respondents and secondary research, BEVs are expected to witness a greater penetration of advanced automotive solutions with better performance and comfort application motors than PHEVs and HEVs. Considering the developments in advanced systems for better performance and safety, the market for the BEV segment for lamination stacks is expected to grow.

The passenger car segment for the motor lamination market is estimated to be the largest market during the forecast period

The passenger car segment is expected to have the largest market share in the motor lamination market for the vehicle type. With growing investments in R&D and manufacturing capacity of major automotive players in different regions, the demand for motors for comfort and safety applications is certain to register growth. Implementing stringent safety regulatory standards mandates the use of ABS and electronic stability controls, which will ultimately result in more demand for motors. An increase in demand for premium and luxury cars with additional comfort application motors is expected to propel the demand for motors, thus driving the market during the forecast period.

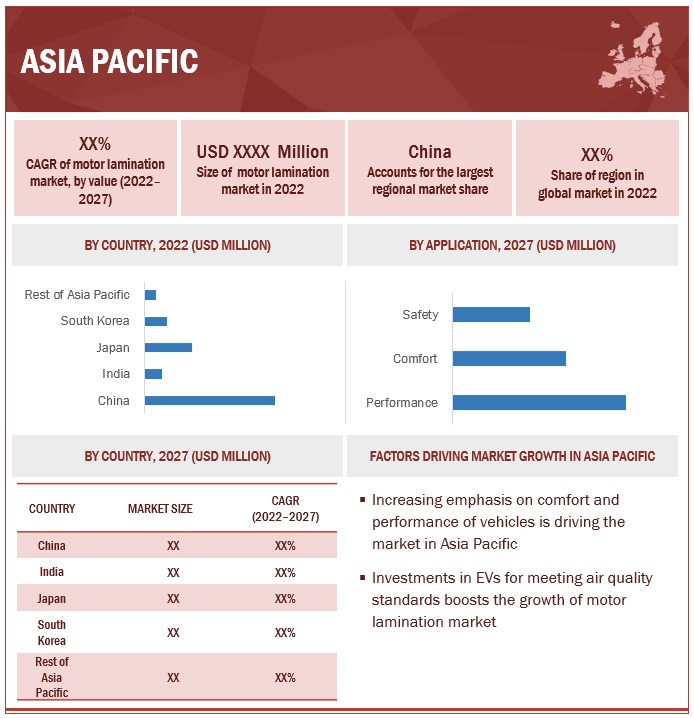
Asia Pacific is likely to be the largest market during the forecast period

Asia Pacific has emerged as a hub for automotive production in recent years. The increasing production of vehicles is the region are primarily attributed to the facilitative regulatory policies of the government like ‘Make in India’. Countries like China has emerged as the leading export hub for vehicle production due to availability of cheap capital, raw materials and skilled labour force to cater to the needs of other regions. Nearly all the major automation and additions for performance, safety, and comfort in vehicles are primarily driven by motors, which indicates that the demand for motor lamination will pick up in sync with the demand for motors. Thus, considering the above factors, it is evident that the motor lamination market is expected to grow significantly in the coming years.
Motor Lamination Market Size, and Share

Key Market Players

Tempel (US), Pitti Engineering Ltd (India), Alinabal, Inc (US), EuroGroup Laminations S.p.A. (Italy), R. Bourgeois (France), and LCS Company (US). The key strategies adopted by major companies to sustain their position in the market are expansions, contracts and agreements, and partnerships.

Want to explore hidden markets that can drive new revenue in Motor Lamination Market?

Scope of the Report

Report Metrics

Details

Base year for estimation 2021
Forecast period 2027
Value (USD Bn) 27.6
Market Growth and Revenue forecast 4.7%
Top Players Tempel (US), Pitti Engineering Ltd (India), Alinabal, Inc (US), EuroGroup Laminations S.p.A. (Italy), R. Bourgeois (France), and LCS Company (US)
Fastest Growing Market Asia-Pacific
Largest Market Asia Pacific
Segments covered By application, By technology, By material, By vehicle type, By motor type, By electric vehicle type, electric vehicle motor lamination market by application (performance, safety & comfort), all-terrain vehicle motor lamination market by application (performance, safety & comfort), By Region (Asia Pacific, Europe, North America, and Row
By application Performance, safety and comfort
By technology Welding, bonding, stamping and others
By vehicle type Passenger cars, light commercial vehicles, buses, and trucks
By material Cold Rolled Non-Oriented Steel, Cold Rolled Non-Grained Oriented Steel, Other materials
By motor type Electric Water pump motor, Radiator cooling fan motor, electronic throttle valve control motor, electronic variable gear ratio motor, Electronic variable valve timing motor Variable nozzle turbo motor, adjustable pedal motor, Electric power steering motor, Wiper motor, Starter motor, EGR Motor, Fuel pump motor, Power antenna motor, Air conditioner motor, Door mirror motor, power window motor, Tilt steering column motor, Blower motor, Power Seat motor, Electric sunroof motor, Door closer motor, Cruise control motor, Adaptive front light motor, Electronic stability control motor, ABS motor, Electronic parking brake motor
By electric type BEV, PHEV, and FCEV
Electric vehicle motor lamination market, by application Performance, safety and comfort
All-terrain vehicle motor lamination market Performance, safety and comfort
By Region Asia Pacific, Europe, North America, and RoW

This research report categorizes the given market, based motor lamination market by application, technology, vehicle type, material, motor type, electric vehicle type, region, electric vehicle motor lamination market, by application and all-terrain vehicle motor lamination market.

Based on the motor lamination market by application, the market has been segmented as follows:
  • Performance
  • Comfort
  • Safety
Based on the motor lamination market by technology, the market has been segmented as follows:
  • Welding
  • Bonding
  • Stamping
  • Others
Based on the motor lamination market by motor type, the market has been segmented as follows:
  • Electric Water pump motor
  • Radiator cooling fan motor
  • Electronic throttle valve control motor
  • Electronic variable gear ratio motor
  • Electronic variable valve timing motor
  • Variable nozzle turbo motor
  • Adjustable pedal motor
  • Electric power steering motor
  • Wiper motor
  • Starter motor
  • EGR Motor
  • Fuel pump motor
  • Power antenna motor
  • Air conditioner motor
  • Door mirror motor
  • Power window motor
  • Tilt steering column motor
  • Blower motor
  • Power Seat motor
  • Electric sunroof motor
  • Door closer motor
  • Cruise control motor
  • Adaptive front light motor
  • Electronic stability control motor
  • ABS motor
  • Electronic parking brake motor
Based on the motor lamination market by vehicle type, the market has been segmented as follows:
  • Passenger Cars
  • Light Commercial Vehicles
  • Trucks
  • Buses
Based on motor lamination market by material type, the market has been segmented as follows:
  • Cold Rolled Non-Oriented Steel
  • Cold Rolled Non-Grained Oriented Steel
  • Other materials
Based on motor lamination market by electric vehicle type, the market has been segmented as follows:
  • BEV
  • PHEV
  • FCEV
Based on the Electric vehicle motor lamination market, by application, the market has been segmented as follows:
  • Performance
  • Comfort
  • Safety
Based on All-terrain vehicle motor lamination market, the market has been segmented as follows:
  • Performance
  • Comfort
  • Safety
Based on motor lamination market by region, the market has been segmented as follows:
  • Asia Pacific
    • China
    • India
    • Japan
    • South Korea
    • Rest of Asia Pacific
  • Europe
    • France
    • GermanyItaly
    • Russia
    • Spain
    • UK
    • Rest of Europe
  • North America
    • US
    • Canada
    • Mexico
  • Rest of the World
    • Brazil
    • South Africa
    • Rest of RoW

Frequently Asked Questions (FAQ):

To speak to our analyst for a discussion on the above findings, click Speak to Analyst

Exclusive indicates content/data unique to MarketsandMarkets and not available with any competitors.

TABLE OF CONTENTS
 
1 INTRODUCTION (Page No. - 28)
    1.1 STUDY OBJECTIVES 
    1.2 MARKET DEFINITION 
           1.2.1 INCLUSIONS AND EXCLUSIONS
    1.3 STUDY SCOPE 
           FIGURE 1 MOTOR LAMINATION MARKET SEGMENTATION
           1.3.1 MARKET, BY REGION
           1.3.2 YEARS CONSIDERED
    1.4 CURRENCY AND PRICING 
           TABLE 1 CURRENCY EXCHANGE RATES (WRT PER USD)
    1.5 SUMMARY OF CHANGES 
 
2 RESEARCH METHODOLOGY (Page No. - 33)
    2.1 RESEARCH DATA 
           FIGURE 2 RESEARCH DESIGN
           FIGURE 3 RESEARCH METHODOLOGY MODEL
           2.1.1 SECONDARY DATA
                    2.1.1.1 Secondary sources for market
                    2.1.1.2 Key secondary sources for market
                    2.1.1.3 Key data from secondary sources
           2.1.2 PRIMARY DATA
                    FIGURE 4 BREAKDOWN OF PRIMARY INTERVIEWS: BY STAKEHOLDER, DESIGNATION, AND REGION
                    2.1.2.1 Primary participants
    2.2 MARKET ESTIMATION METHODOLOGY 
    2.3 RESEARCH METHODOLOGY: HYPOTHESIS BUILDING 
           FIGURE 5 RESEARCH METHODOLOGY: HYPOTHESIS BUILDING
           2.3.1 BOTTOM-UP APPROACH
                    FIGURE 6 MARKET SIZE: BOTTOM-UP APPROACH (BY APPLICATION)
           2.3.2 TOP-DOWN APPROACH
                    FIGURE 7 MARKET SIZE: TOP-DOWN APPROACH (MATERIAL TYPE)
                    FIGURE 8 MARKET: RESEARCH DESIGN AND METHODOLOGY
           2.3.3 FACTOR ANALYSIS FOR MARKET SIZING: DEMAND AND SUPPLY SIDE
                    FIGURE 9 FACTOR ANALYSIS FOR MARKET SIZING: DEMAND AND SUPPLY SIDE
    2.4 DATA TRIANGULATION 
           FIGURE 10 DATA TRIANGULATION METHODOLOGY
    2.5 FACTOR ANALYSIS 
    2.6 RESEARCH ASSUMPTIONS 
           2.6.1 GLOBAL ASSUMPTIONS
    2.7 ASSUMPTIONS 
    2.8 RESEARCH LIMITATIONS 
 
3 EXECUTIVE SUMMARY (Page No. - 46)
    3.1 REPORT SUMMARY 
           FIGURE 11 MOTOR LAMINATION MARKET OUTLOOK
           FIGURE 12 MARKET, BY REGION, 2022 VS. 2027 (USD MILLION)
 
4 PREMIUM INSIGHTS (Page No. - 50)
    4.1 MOTOR LAMINATION MARKET OVERVIEW 
           FIGURE 13 ATTRACTIVE OPPORTUNITIES IN MARKET, 2022 VS. 2027 (USD MILLION)
    4.2 MARKET, BY APPLICATION 
           FIGURE 14 COMFORT APPLICATION SEGMENT TO LEAD MARKET BY 2027 (USD MILLION)
    4.3 MARKET, BY MOTOR TYPE 
           FIGURE 15 ELECTRONIC STABILITY CONTROL MOTORS TO LEAD MARKET DURING FORECAST PERIOD (USD MILLION)
    4.4 MARKET, BY MATERIAL 
           FIGURE 16 CRNO SEGMENT TO ACCOUNT FOR LARGEST SHARE OF MARKET IN 2022 (USD MILLION)
    4.5 MARKET, BY TECHNOLOGY 
           FIGURE 17 BONDING SEGMENT TO ACCOUNT FOR LARGEST SHARE OF MARKET IN 2022 (USD MILLION)
    4.6 MARKET, BY VEHICLE TYPE 
           FIGURE 18 PASSENGER CARS TO ACCOUNT FOR LARGEST SHARE OF MARKET IN 2022 (USD MILLION)
    4.7 MARKET, BY ELECTRIC VEHICLE TYPE 
           FIGURE 19 BEVS TO LEAD MARKET DURING FORECAST PERIOD (USD MILLION)
    4.8 ELECTRIC VEHICLE MOTOR LAMINATION MARKET, BY APPLICATION 
           FIGURE 20 PERFORMANCE APPLICATION SEGMENT TO LEAD MARKET DURING FORECAST PERIOD (USD MILLION)
    4.9 ATV MOTOR LAMINATION MARKET, BY APPLICATION 
           FIGURE 21 PERFORMANCE SEGMENT TO LEAD MARKET DURING FORECAST PERIOD (USD MILLION)
    4.10 MARKET, BY REGION 
           FIGURE 22 ASIA PACIFIC SEGMENT TO LEAD MARKET DURING FORECAST PERIOD (USD MILLION)
    4.11 MARKET, BY REGION 
                    FIGURE 23 ASIA PACIFIC TO HOLD LARGEST SHARE OF MARKET DURING FORECAST PERIOD
 
5 MARKET OVERVIEW AND INDUSTRY TRENDS (Page No. - 56)
    5.1 INTRODUCTION 
    5.2 MARKET DYNAMICS 
           FIGURE 24 MOTOR LAMINATION MARKET DYNAMICS
           5.2.1 DRIVERS
                    5.2.1.1 Transition to e-mobility solutions and increased usage of electric motors
                               FIGURE 25 EMISSION NORMS FOR ON-HIGHWAY VEHICLES, 2014–2025
                    5.2.1.2 Increase in demand for high-performance motors for automotive applications
           5.2.2 RESTRAINTS
                    5.2.2.1 Higher up-front investments in lamination technologies
                    5.2.2.2 Low market penetration and serviceability in developing economies
                    5.2.2.3 Presence of in-house OEMs restricts growth of lamination manufacturing companies
           5.2.3 OPPORTUNITIES
                    5.2.3.1 Demand for high-precision motor lamination sheets with distinct material features
                    5.2.3.2 Advancements in lamination technologies with better operational efficiency
                               TABLE 2 MOTOR LAMINATION MANUFACTURERS & TECHNOLOGIES
           5.2.4 CHALLENGES
                    5.2.4.1 Transition to newer technologies with higher cost
                    5.2.4.2 Technological complexity with growing lamination technologies and customized requirements
    5.3 TRENDS/DISRUPTIONS IMPACTING CUSTOMER BUSINESSES 
           FIGURE 26 REVENUE SHIFT FOR MARKET
    5.4 MARKET SCENARIO 
           FIGURE 27 MARKET SCENARIO, 2022–2027 (USD MILLION)
           5.4.1 MOST LIKELY/REALISTIC SCENARIO
                    TABLE 3 MARKET (REALISTIC SCENARIO), BY REGION, 2022–2027 (USD MILLION)
           5.4.2 HIGH-IMPACT SCENARIO
                    TABLE 4 HIGH-IMPACT SCENARIO: MARKET, BY REGION, 2022–2027 (USD MILLION)
           5.4.3 LOW-IMPACT SCENARIO
                    TABLE 5 LOW-IMPACT SCENARIO: MARKET, BY REGION, 2022–2027 (USD MILLION)
    5.5 PATENT ANALYSIS 
           TABLE 6 PATENT ANALYSIS FOR MOTOR LAMINATIONS
    5.6 SUPPLY CHAIN ANALYSIS 
           FIGURE 28 SUPPLY CHAIN ANALYSIS: MARKET
    5.7 CASE STUDY ANALYSIS 
           5.7.1 FABRICATION OF THIN LAMINATION STATOR CORES BY UNIFORM DROPLET SPRAY PROCESS
           5.7.2 DEVELOPMENT IN MANUFACTURING OF MOTOR LAMINATION FOR E-MOBILITY SOLUTIONS
    5.8 TECHNOLOGY ANALYSIS 
           5.8.1 BECKERS' BECKRY®CORE WATERBORNE CORE PLATE VARNISH MOTOR LAMINATION FOR E-MOBILITY
           5.8.2 METGLAS ADVANCED MATERIALS FOR MOTOR LAMINATIONS
    5.9 MARKET ECOSYSTEM 
           FIGURE 29 MOTOR LAMINATION MARKET ECOSYSTEM
           TABLE 7 MARKET: ECOSYSTEM
    5.10 AVERAGE SELLING PRICING ANALYSIS 
           TABLE 8 AVERAGE PRICE OF MOTOR LAMINATIONS, 2021
    5.11 PORTER’S FIVE FORCES ANALYSIS 
                    TABLE 9 PORTER’S FIVE FORCES FOR MARKET
                    FIGURE 30 PORTER’S FIVE FORCES IMPACT ON MARKET
           5.11.1 INTENSITY OF COMPETITIVE RIVALRY
           5.11.2 THREAT OF NEW ENTRANTS
           5.11.3 BARGAINING POWER OF SUPPLIERS
           5.11.4 THREAT OF SUBSTITUTES
           5.11.5 BARGAINING POWER OF BUYERS
    5.12 TRADE ANALYSIS: MOTOR LAMINATIONS 
           5.12.1 IMPORT DATA
                    5.12.1.1 US: Motor lamination imports share, by country (Value %)
                               TABLE 10 EXPORT DATA
    5.13 REGULATORY LANDSCAPE 
    5.14 REGULATORY BODIES, GOVERNMENT AGENCIES, AND OTHER ORGANIZATIONS 
    5.15 KEY CONFERENCES & EVENTS IN 2022–2023 
                    TABLE 11 MOTOR LAMINATION MARKET: KEY CONFERENCES & EVENTS
 
6 MOTOR LAMINATION MARKET, BY APPLICATION (Page No. - 81)
    6.1 INTRODUCTION 
           6.1.1 RESEARCH METHODOLOGY
           6.1.2 PRIMARY INSIGHTS
           6.1.3 ASSUMPTIONS
                    FIGURE 31 MARKET, BY APPLICATION, 2022 VS. 2027 (USD MILLION)
                    TABLE 12 MARKET, BY APPLICATION, 2018–2021 (MILLION UNITS)
                    TABLE 13 MARKET, BY APPLICATION, 2022–2027 (MILLION UNITS)
                    TABLE 14 MARKET, BY APPLICATION, 2018–2021 (USD MILLION)
                    TABLE 15 MARKET, BY APPLICATION, 2022–2027 (USD MILLION)
    6.2 PERFORMANCE 
           6.2.1 GROWING VEHICLE PRODUCTION TO BOOST SEGMENT
                    TABLE 16 PERFORMANCE: MARKET, BY REGION, 2018–2021 (MILLION UNITS)
                    TABLE 17 PERFORMANCE: MARKET, BY REGION, 2022–2027 (MILLION UNITS)
                    TABLE 18 PERFORMANCE: MARKET, BY REGION, 2018–2021 (USD MILLION)
                    TABLE 19 PERFORMANCE: MARKET, BY REGION, 2022–2027 (USD MILLION)
    6.3 COMFORT 
           6.3.1 INCREASED DEMAND FOR COMFORT FEATURES TO DRIVE MARKET
                    TABLE 20 COMFORT: MARKET, BY REGION, 2018–2021 (MILLION UNITS)
                    TABLE 21 COMFORT: MARKET, BY REGION, 2022–2027 (MILLION UNITS)
                    TABLE 22 COMFORT: MARKET, BY REGION, 2018–2021 (USD MILLION)
                    TABLE 23 COMFORT: MARKET, BY REGION, 2022–2027 (USD MILLION)
    6.4 SAFETY 
           6.4.1 STRINGENT SAFETY STANDARDS TO INCREASE SAFETY MOTOR LAMINATION DEMAND
                    TABLE 24 SAFETY: MARKET, BY REGION, 2018–2021 (MILLION UNITS)
                    TABLE 25 SAFETY: MARKET, BY REGION, 2022–2027 (MILLION UNITS)
                    TABLE 26 SAFETY: MARKET, BY REGION, 2018–2021 (USD MILLION)
                    TABLE 27 SAFETY: MARKET, BY REGION, 2022–2027 (USD MILLION)
 
7 MOTOR LAMINATION MARKET, BY MOTOR TYPE (Page No. - 90)
    7.1 INTRODUCTION 
           7.1.1 RESEARCH METHODOLOGY
           7.1.2 PRIMARY INSIGHTS
           7.1.3 ASSUMPTIONS
                    FIGURE 32 MARKET, BY MOTOR TYPE, 2022 VS. 2027 (USD MILLION)
                    TABLE 28 MARKET, BY MOTOR TYPE, 2018–2021 (MILLION UNITS)
                    TABLE 29 MARKET, BY MOTOR TYPE, 2022–2027 (MILLION UNITS)
                    TABLE 30 MARKET, BY MOTOR TYPE, 2018–2021 (USD MILLION)
                    TABLE 31 MARKET, BY MOTOR TYPE, 2022–2027 (USD MILLION)
    7.2 ELECTRIC WATER PUMP MOTORS 
           7.2.1 RISING DEMAND FOR FUEL EFFICIENCY TO DRIVE DEMAND
                    TABLE 32 ELECTRIC WATER PUMP MARKET, BY REGION, 2018–2021 (MILLION UNITS)
                    TABLE 33 ELECTRIC WATER PUMP MARKET, BY REGION, 2022–2027 (MILLION UNITS)
                    TABLE 34 ELECTRIC WATER PUMP MARKET, BY REGION, 2018–2021 (USD MILLION)
                    TABLE 35 ELECTRIC WATER PUMP MARKET, BY REGION, 2022–2027 (USD MILLION)
    7.3 RADIATOR COOLING FAN MOTORS 
           7.3.1 ASIA PACIFIC TO BE LARGEST MARKET BY VALUE
                    TABLE 36 RADIATOR COOLING FAN MARKET, BY REGION, 2018–2021 (MILLION UNITS)
                    TABLE 37 RADIATOR COOLING FAN MARKET, BY REGION, 2022–2027 (MILLION UNITS)
                    TABLE 38 RADIATOR COOLING FAN MARKET, BY REGION, 2018–2021 (USD MILLION)
                    TABLE 39 RADIATOR COOLING FAN MARKET, BY REGION, 2022–2027 (USD MILLION)
    7.4 ELECTRONIC THROTTLE VALVE CONTROL MOTORS 
           7.4.1 DEMAND FOR EFFICIENT FUEL CONSUMPTION TO DRIVE MARKET
                    TABLE 40 ELECTRIC THROTTLE VALVE CONTROL MARKET, BY REGION, 2018–2021 (MILLION UNITS)
                    TABLE 41 ELECTRIC THROTTLE VALVE CONTROL MARKET, BY REGION, 2022–2027 (MILLION UNITS)
                    TABLE 42 ELECTRIC THROTTLE VALVE CONTROL MARKET, BY REGION, 2018–2021 (USD MILLION)
                    TABLE 43 ELECTRIC THROTTLE VALVE CONTROL MARKET, BY REGION, 2022–2027 (USD MILLION)
    7.5 ELECTRONIC VARIABLE GEAR RATIO MOTORS 
           7.5.1 RISING CHOICES FOR AUTONOMOUS CONTROL TO DRIVE DEMAND
                    TABLE 44 ELECTRIC VARIABLE GEAR RATIO MARKET, BY REGION, 2018–2021 (MILLION UNITS)
                    TABLE 45 ELECTRIC VARIABLE GEAR RATIO MARKET, BY REGION, 2022–2027 (MILLION UNITS)
                    TABLE 46 ELECTRIC VARIABLE GEAR RATIO MARKET, BY REGION, 2018–2021 (USD MILLION)
                    TABLE 47 ELECTRIC VARIABLE GEAR RATIO MARKET, BY REGION, 2022–2027 (USD MILLION)
    7.6 ELECTRONIC VARIABLE VALVE TIMING MOTORS 
           7.6.1 RISE IN DEMAND FOR BETTER EFFICIENCY OF ENGINES TO DRIVE MARKET
                    TABLE 48 ELECTRONIC VARIABLE VALVE TIMING MARKET, BY REGION, 2018–2021 (MILLION UNITS)
                    TABLE 49 ELECTRONIC VARIABLE VALVE TIMING MARKET, BY REGION, 2022–2027 (MILLION UNITS)
                    TABLE 50 ELECTRONIC VARIABLE VALVE TIMING MARKET, BY REGION, 2018–2021 (USD MILLION)
                    TABLE 51 ELECTRONIC VARIABLE VALVE TIMING MARKET, BY REGION, 2022–2027 (USD MILLION)
    7.7 VARIABLE NOZZLE TURBO MOTORS 
           7.7.1 INCREASED ADOPTION OF LOW-EMISSION TECHNOLOGY TO PROPEL DEMAND
                    TABLE 52 VARIABLE NOZZLE TURBO MARKET, BY REGION, 2018–2021 (MILLION UNITS)
                    TABLE 53 VARIABLE NOZZLE TURBO MARKET, BY REGION, 2022–2027 (MILLION UNITS)
                    TABLE 54 VARIABLE NOZZLE TURBO MARKET, BY REGION, 2018–2021 (USD MILLION)
                    TABLE 55 VARIABLE NOZZLE TURBO MARKET, BY REGION, 2022–2027 (USD MILLION)
    7.8 ADJUSTABLE PEDAL MOTORS 
           7.8.1 RISING NEED FOR ADVANCED FEATURES TO DRIVE DEMAND FOR ADJUSTABLE PEDAL MOTORS
                    TABLE 56 ADJUSTABLE PEDAL MARKET, BY REGION, 2018–2021 (MILLION UNITS)
                    TABLE 57 ADJUSTABLE PEDAL MARKET, BY REGION, 2022–2027 (MILLION UNITS)
                    TABLE 58 ADJUSTABLE PEDAL MARKET, BY REGION, 2018–2021 (USD MILLION)
                    TABLE 59 ADJUSTABLE PEDAL MARKET, BY REGION, 2022–2027 (USD MILLION)
    7.9 ELECTRIC POWER STEERING MOTORS 
           7.9.1 RISING DEMAND FOR BETTER CONTROL TO DRIVE MARKET
                    TABLE 60 ELECTRIC POWER STEERING MARKET, BY REGION, 2018–2021 (MILLION UNITS)
                    TABLE 61 ELECTRIC POWER STEERING MARKET, BY REGION, 2022–2027 (MILLION UNITS)
                    TABLE 62 ELECTRIC POWER STEERING MARKET, BY REGION, 2018–2021 (USD MILLION)
                    TABLE 63 ELECTRIC POWER STEERING MARKET, BY REGION, 2022–2027 (USD MILLION)
    7.10 WIPER MOTORS 
           7.10.1 INCREASING DEMAND FOR PASSENGER VEHICLES TO DRIVE MARKET FOR WIPER MOTORS
                    TABLE 64 WIPER MARKET, BY REGION, 2018–2021 (MILLION UNITS)
                    TABLE 65 WIPER MARKET, BY REGION, 2022–2027 (MILLION UNITS)
                    TABLE 66 WIPER MARKET, BY REGION, 2018–2021 (USD MILLION)
                    TABLE 67 WIPER MARKET, BY REGION, 2022–2027 (USD MILLION)
    7.11 STARTER MOTORS 
           7.11.1 INCREASING COMFORT FEATURES IN PASSENGER VEHICLES TO DRIVE MARKET
                    TABLE 68 STARTER MARKET, BY REGION, 2018–2021 (MILLION UNITS)
                    TABLE 69 STARTER MARKET, BY REGION, 2022–2027 (MILLION UNITS)
                    TABLE 70 STARTER MARKET, BY REGION, 2018–2021 (USD MILLION)
                    TABLE 71 STARTER MARKET, BY REGION, 2022–2027 (USD MILLION)
    7.12 EGR MOTORS 
           7.12.1 STRINGENT EMISSION NORMS TO PROPEL MARKET GROWTH FOR EGR MOTORS
                    TABLE 72 EGR MARKET, BY REGION, 2018–2021 (MILLION UNITS)
                    TABLE 73 EGR MARKET, BY REGION, 2022–2027 (MILLION UNITS)
                    TABLE 74 EGR MARKET, BY REGION, 2018–2021 (USD MILLION)
                    TABLE 75 EGR MARKET, BY REGION, 2022–2027 (USD MILLION)
    7.13 FUEL PUMP MOTORS 
           7.13.1 RISING INVESTMENTS IN ELECTRIC FUEL PUMP MOTOR COMPANIES TO DRIVE MARKET
                    TABLE 76 FUEL PUMP MARKET, BY REGION, 2018–2021 (MILLION UNITS)
                    TABLE 77 FUEL PUMP MARKET, BY REGION, 2022–2027 (MILLION UNITS)
                    TABLE 78 FUEL PUMP MARKET, BY REGION, 2018–2021 (USD MILLION)
                    TABLE 79 FUEL PUMP MARKET, BY REGION, 2022–2027 (USD MILLION)
    7.14 POWER ANTENNA MOTORS 
           7.14.1 DEMAND FOR BETTER NAVIGATIONAL FEATURES TO DRIVE MARKET
                    TABLE 80 POWER ANTENNA MARKET, BY REGION, 2018–2021 (MILLION UNITS)
                    TABLE 81 POWER ANTENNA MARKET, BY REGION, 2022–2027 (MILLION UNITS)
                    TABLE 82 POWER ANTENNA MARKET, BY REGION, 2018–2021 (USD MILLION)
                    TABLE 83 POWER ANTENNA MARKET, BY REGION, 2022–2027 (USD MILLION)
    7.15 AIR CONDITIONER MOTORS 
           7.15.1 DEMAND FOR COMFORT FEATURES TO DRIVE MARKET FOR AIR CONDITIONER MOTORS
                    TABLE 84 AIR CONDITIONER MARKET, BY REGION, 2018–2021 (MILLION UNITS)
                    TABLE 85 AIR CONDITIONER MARKET, BY REGION, 2022–2027 (MILLION UNITS)
                    TABLE 86 AIR CONDITIONER MARKET, BY REGION, 2018–2021 (USD MILLION)
                    TABLE 87 AIR CONDITIONER MARKET, BY REGION, 2022–2027 (USD MILLION)
    7.16 DOOR MIRROR MOTORS 
           7.16.1 RISING DEMAND FOR AUTONOMOUS VEHICLES TO PROPEL MARKET GROWTH
                    TABLE 88 DOOR MIRROR MARKET, BY REGION, 2018–2021 (MILLION UNITS)
                    TABLE 89 DOOR MIRROR MARKET, BY REGION, 2022–2027 (MILLION UNITS)
                    TABLE 90 DOOR MIRROR MARKET, BY REGION, 2018–2021 (USD MILLION)
                    TABLE 91 DOOR MIRROR MARKET, BY REGION, 2022–2027 (USD MILLION)
    7.17 POWER WINDOW MOTORS 
           7.17.1 INCREASING DEMAND FOR COMFORT APPLICATIONS IN LUXURY CARS TO DRIVE MARKET
                    TABLE 92 POWER WINDOW MARKET, BY REGION, 2018–2021 (MILLION UNITS)
                    TABLE 93 POWER WINDOW MARKET, BY REGION, 2022–2027 (MILLION UNITS)
                    TABLE 94 POWER WINDOW MARKET, BY REGION, 2018–2021 (USD MILLION)
                    TABLE 95 POWER WINDOW MARKET, BY REGION, 2022–2027 (USD MILLION)
    7.18 TILT STEERING COLUMN MOTORS 
           7.18.1 INCREASING DRIVING CAPABILITY AND COMFORT TO DRIVE DEMAND
                    TABLE 96 TILT STEERING COLUMN MARKET, BY REGION, 2018–2021 (MILLION UNITS)
                    TABLE 97 TILT STEERING COLUMN MARKET, BY REGION, 2022–2027 (MILLION UNITS)
                    TABLE 98 TILT STEERING COLUMN MARKET, BY REGION, 2018–2021 (USD MILLION)
                    TABLE 99 TILT STEERING COLUMN MARKET, BY REGION, 2022–2027 (USD MILLION)
    7.19 BLOWER MOTORS 
           7.19.1 DEMAND FOR BETTER COMFORT FEATURES TO DRIVE MARKET
                    TABLE 100 BLOWER MARKET, BY REGION, 2018–2021 (MILLION UNITS)
                    TABLE 101 BLOWER MARKET, BY REGION, 2022–2027 (MILLION UNITS)
                    TABLE 102 BLOWER MARKET, BY REGION, 2018–2021 (USD MILLION)
                    TABLE 103 BLOWER MARKET, BY REGION, 2022–2027 (USD MILLION)
    7.20 POWER SEAT MOTORS 
           7.20.1 RISING DISPOSABLE INCOME AND DEMAND FOR LUXURY VEHICLES TO DRIVE MARKET
                    TABLE 104 POWER SEAT MARKET, BY REGION, 2018–2021 (MILLION UNITS)
                    TABLE 105 POWER SEAT MARKET, BY REGION, 2022–2027 (MILLION UNITS)
                    TABLE 106 POWER SEAT MARKET, BY REGION, 2018–2021 (USD MILLION)
                    TABLE 107 POWER SEAT MARKET, BY REGION, 2022–2027 (USD MILLION)
    7.21 ELECTRIC SUNROOF MOTORS 
           7.21.1 INCREASING DEMAND FOR ADDITIONAL COMFORT FEATURES IN VEHICLES TO DRIVE MARKET
                    TABLE 108 ELECTRIC SUNROOF MARKET, BY REGION, 2018–2021 (MILLION UNITS)
                    TABLE 109 ELECTRIC SUNROOF MARKET, BY REGION, 2022–2027 (MILLION UNITS)
                    TABLE 110 ELECTRIC SUNROOF MARKET, BY REGION, 2018–2021 (USD MILLION)
                    TABLE 111 ELECTRIC SUNROOF MARKET, BY REGION, 2022–2027 (USD MILLION)
    7.22 DOOR CLOSER MOTORS 
           7.22.1 DEMAND FOR AUTONOMOUS COMFORT FEATURES TO DRIVE MARKET
                    TABLE 112 DOOR CLOSER MARKET, BY REGION, 2018–2021 (MILLION UNITS)
                    TABLE 113 DOOR CLOSER MARKET, BY REGION, 2022–2027 (MILLION UNITS)
                    TABLE 114 DOOR CLOSER MARKET, BY REGION, 2018–2021 (USD MILLION)
                    TABLE 115 DOOR CLOSER MARKET, BY REGION, 2022–2027 (USD MILLION)
    7.23 CRUISE CONTROL MOTORS 
           7.23.1 RISING NEED FOR BETTER CONTROL TO DRIVE DEMAND FOR CRUISE CONTROL MOTORS
                    TABLE 116 CRUISE CONTROL MARKET, BY REGION, 2018–2021 (MILLION UNITS)
                    TABLE 117 CRUISE CONTROL MARKET, BY REGION, 2022–2027 (MILLION UNITS)
                    TABLE 118 CRUISE CONTROL MARKET, BY REGION, 2018–2021 (USD MILLION)
                    TABLE 119 CRUISE CONTROL MARKET, BY REGION, 2022–2027 (USD MILLION)
    7.24 ADAPTIVE FRONT LIGHT MOTORS 
           7.24.1 DEMAND FOR BETTER VISIBILITY TO DRIVE MARKET
                    TABLE 120 ADAPTIVE FRONT LIGHT MARKET, BY REGION, 2018–2021 (MILLION UNITS)
                    TABLE 121 ADAPTIVE FRONT LIGHT MARKET, BY REGION, 2022–2027 (MILLION UNITS)
                    TABLE 122 ADAPTIVE FRONT LIGHT MARKET, BY REGION, 2018–2021 (USD MILLION)
                    TABLE 123 ADAPTIVE FRONT LIGHT MARKET, BY REGION, 2022–2027 (USD MILLION)
    7.25 ELECTRONIC STABILITY CONTROL MOTORS 
           7.25.1 INCREASING STRINGENT SAFETY NORMS TO DRIVE DEMAND
                    TABLE 124 ELECTRONIC STABILITY CONTROL MARKET, BY REGION, 2018–2021 (MILLION UNITS)
                    TABLE 125 ELECTRONIC STABILITY CONTROL MARKET, BY REGION, 2022–2027 (MILLION UNITS)
                    TABLE 126 ELECTRONIC STABILITY CONTROL MARKET, BY REGION, 2018–2021 (USD MILLION)
                    TABLE 127 ELECTRONIC STABILITY CONTROL MARKET, BY REGION, 2022–2027 (USD MILLION)
    7.26 ABS MOTORS 
           7.26.1 RISING ACCIDENTS AND STRICT REGULATORY POLICIES TO DRIVE DEMAND FOR ABS MOTORS
                    TABLE 128 ABS MARKET, BY REGION, 2018–2021 (MILLION UNITS)
                    TABLE 129 ABS MARKET, BY REGION, 2022–2027 (MILLION UNITS)
                    TABLE 130 ABS MARKET, BY REGION, 2018–2021 (USD MILLION)
                    TABLE 131 ABS MARKET, BY REGION, 2022–2027 (USD MILLION)
    7.27 ELECTRONIC PARKING BRAKE MOTORS 
           7.27.1 RISING SAFETY CONCERNS TO DRIVE MARKET FOR ELECTRONIC PARKING BRAKE MOTORS
                    TABLE 132 ELECTRONIC PARKING BRAKE MARKET, BY REGION, 2018–2021 (MILLION UNITS)
                    TABLE 133 ELECTRONIC PARKING BRAKE MARKET, BY REGION, 2022–2027 (MILLION UNITS)
                    TABLE 134 ELECTRONIC PARKING BRAKE MARKET, BY REGION, 2018–2021 (USD MILLION)
                    TABLE 135 ELECTRONIC PARKING BRAKE MARKET, BY REGION, 2022–2027 (USD MILLION)
 
8 MOTOR LAMINATION MARKET, BY MATERIAL (Page No. - 138)
    8.1 INTRODUCTION 
           8.1.1 RESEARCH METHODOLOGY
           8.1.2 PRIMARY INSIGHTS
           8.1.3 ASSUMPTIONS
                    FIGURE 33 MARKET, BY MATERIAL, 2022 VS. 2027 (MILLION UNITS)
                    TABLE 136 MARKET, BY MATERIAL, 2018–2021 (MILLION UNITS)
                    TABLE 137 MARKET, BY MATERIAL, 2022–2027 (MILLION UNITS)
    8.2 COLD-ROLLED NON-ORIENTED (CRNO) STEEL 
           8.2.1 DEMAND FOR HIGH-GRADE MATERIALS BY MOTOR MANUFACTURERS TO DRIVE MARKET
                    TABLE 138 CRNO STEEL: MARKET, BY REGION, 2018–2021 (MILLION UNITS)
                    TABLE 139 CRNO STEEL: MARKET, BY REGION, 2022–2027 (MILLION UNITS)
    8.3 COLD-ROLLED NON-GRAINED ORIENTED (CRNGO) STEEL 
           8.3.1 SUITABILITY FOR CUSTOMIZATION FOR DIFFERENT APPLICATIONS TO DRIVE MARKET
                    TABLE 140 CRNGO STEEL: MARKET, BY REGION, 2018–2021 (MILLION UNITS)
                    TABLE 141 CRNGO STEEL: MARKET, BY REGION, 2022–2027 (MILLION UNITS)
    8.4 OTHER MATERIALS 
           8.4.1 GROWING POPULARITY OF VARIOUS OTHER COATINGS TO DRIVE MARKET
                    TABLE 142 OTHER MATERIALS: MARKET, BY REGION, 2018–2021 (MILLION UNITS)
                    TABLE 143 OTHER MATERIALS: MARKET, BY REGION, 2022–2027 (MILLION UNITS)
 
9 MOTOR LAMINATION MARKET, BY TECHNOLOGY (Page No. - 145)
    9.1 INTRODUCTION 
           9.1.1 RESEARCH METHODOLOGY
           9.1.2 PRIMARY INSIGHTS
           9.1.3 ASSUMPTIONS
                    FIGURE 34 MARKET, BY TECHNOLOGY, 2022 VS. 2027 (MILLION UNITS)
                    TABLE 144 MARKET, BY TECHNOLOGY, 2018–2021 (MILLION UNITS)
                    TABLE 145 MARKET, BY TECHNOLOGY, 2022–2027 (MILLION UNITS)
    9.2 WELDING 
           9.2.1 DEVELOPMENTS IN TECHNOLOGY TO DRIVE WELDING SEGMENT
                    TABLE 146 WELDING: MARKET, BY REGION, 2018–2021 (MILLION UNITS)
                    TABLE 147 WELDING: MARKET, BY REGION, 2022–2027 (MILLION UNITS)
    9.3 BONDING 
           9.3.1 BETTER THERMAL AND OPERATIONAL FEATURES OF BONDING TECHNOLOGY TO DRIVE ITS POPULARITY
                    TABLE 148 BONDING: MARKET, BY REGION, 2018–2021 (MILLION UNITS)
                    TABLE 149 BONDING: MARKET, BY REGION, 2022–2027 (MILLION UNITS)
    9.4 STAMPING 
           9.4.1 EASE OF CUSTOMIZATION TO DRIVE MARKET FOR STAMPING
                    TABLE 150 STAMPING: MARKET, BY REGION, 2018–2021 (MILLION UNITS)
                    TABLE 151 STAMPING: MARKET, BY REGION, 2022–2027 (MILLION UNITS)
    9.5 OTHERS 
           9.5.1 R&D OF BONDING AND ADHESIVE TECHNOLOGIES TO DRIVE MARKET FOR OTHER TECHNOLOGIES
                    TABLE 152 OTHER TECHNOLOGIES: MARKET, BY REGION, 2018–2021 (MILLION UNITS)
                    TABLE 153 OTHER TECHNOLOGIES: MARKET, BY REGION, 2022–2027 (MILLION UNITS)
 
10 MOTOR LAMINATION MARKET, BY VEHICLE TYPE (Page No. - 153)
     10.1 INTRODUCTION 
             10.1.1 RESEARCH METHODOLOGY
             10.1.2 PRIMARY INSIGHTS
             10.1.3 ASSUMPTIONS
                       FIGURE 35 MARKET, BY VEHICLE TYPE, 2022 VS. 2027 (USD MILLION)
                       TABLE 154 MARKET, BY VEHICLE TYPE, 2018–2021 (MILLION UNITS)
                       TABLE 155 MARKET, BY VEHICLE TYPE, 2022–2027 (MILLION UNITS)
                       TABLE 156 MARKET, BY VEHICLE TYPE, 2018–2021 (USD MILLION)
                       TABLE 157 MARKET, BY VEHICLE TYPE, 2022–2027 (USD MILLION)
     10.2 PASSENGER CARS 
             10.2.1 EASE IN SEMICONDUCTOR SUPPLY AND RISE IN DEMAND FOR MORE PASSENGER CARS TO DRIVE MARKET
                       TABLE 158 PASSENGER CARS: MARKET, BY REGION, 2018–2021 (MILLION UNITS)
                       TABLE 159 PASSENGER CARS: MARKET, BY REGION, 2022–2027 (MILLION UNITS)
                       TABLE 160 PASSENGER CARS: MARKET, BY REGION, 2018–2021 (USD MILLION)
                       TABLE 161 PASSENGER CARS: MARKET, BY REGION, 2022–2027 (USD MILLION)
     10.3 LIGHT COMMERCIAL VEHICLES 
             10.3.1 GREATER EMPHASIS ON SAFETY AND PERFORMANCE TO DRIVE MARKET
                       TABLE 162 LIGHT COMMERCIAL VEHICLES: MARKET, BY REGION, 2018–2021 (MILLION UNITS)
                       TABLE 163 LIGHT COMMERCIAL VEHICLES: MARKET, BY REGION, 2022–2027 (MILLION UNITS)
                       TABLE 164 LIGHT COMMERCIAL VEHICLES: MARKET, BY REGION, 2018–2021 (USD MILLION)
                       TABLE 165 LIGHT COMMERCIAL VEHICLES: MARKET, BY REGION, 2022–2027 (USD MILLION)
     10.4 TRUCKS 
             10.4.1 RISE IN DEMAND FOR COMMERCIAL TRUCKS TO DRIVE MARKET
                       TABLE 166 TRUCKS: MOTOR LAMINATION MARKET, BY REGION, 2018–2021 (MILLION UNITS)
                       TABLE 167 TRUCK: MARKET, BY REGION, 2022–2027 (MILLION UNITS)
                       TABLE 168 TRUCKS:MARKET, BY REGION, 2018–2021 (USD MILLION)
                       TABLE 169 TRUCKS: MARKET, BY REGION, 2022–2027 (USD MILLION)
     10.5 BUSES 
             10.5.1 GROWING ADOPTION OF BUSES WITH ADVANCED FEATURES TO BOOST DEMAND
                       TABLE 170 BUSES: MARKET, BY REGION, 2018–2021 (MILLION UNITS)
                       TABLE 171 BUSES: MARKET, BY REGION, 2022–2027 (MILLION UNITS)
                       TABLE 172 BUSES: MARKET, BY REGION, 2018–2021 (USD MILLION)
                       TABLE 173 BUSES: MARKET, BY REGION, 2022–2027 (USD MILLION)
 
11 MOTOR LAMINATION MARKET, BY ELECTRIC VEHICLE TYPE (Page No. - 164)
     11.1 INTRODUCTION 
             11.1.1 RESEARCH METHODOLOGY
             11.1.2 PRIMARY INSIGHTS
             11.1.3 ASSUMPTIONS
                       FIGURE 36 MARKET, BY ELECTRIC VEHICLE TYPE, 2022 VS. 2027 (USD MILLION)
                       TABLE 174 MARKET, BY ELECTRIC VEHICLE TYPE, 2018–2021 (THOUSAND UNITS)
                       TABLE 175 MARKET, BY ELECTRIC VEHICLE TYPE, 2022–2027 (THOUSAND UNITS)
                       TABLE 176 MARKET, BY ELECTRIC VEHICLE TYPE, 2018–2021 (USD MILLION)
                       TABLE 177 MARKET, BY ELECTRIC VEHICLE TYPE, 2022–2027 (USD MILLION)
     11.2 BATTERY ELECTRIC VEHICLES 
             11.2.1 TECHNOLOGICAL ADVANCEMENTS TO DRIVE MARKET
                       TABLE 178 BEV: MOTOR LAMINATION MARKET, BY REGION, 2018–2021 (THOUSAND UNITS)
                       TABLE 179 BEV: MARKET, BY REGION, 2022–2027 (THOUSAND UNITS)
                       TABLE 180 BEV: MARKET, BY REGION, 2018–2021 (USD MILLION)
                       TABLE 181 BEV: MARKET, BY REGION, 2022–2027 (USD MILLION)
     11.3 PLUG-IN HYBRID ELECTRIC VEHICLES 
             11.3.1 GROWING PHEV SALES DUE TO STRINGENT EMISSION NORMS TO DRIVE MARKET
                       TABLE 182 PHEV: MARKET, BY REGION, 2018–2021 (THOUSAND UNITS)
                       TABLE 183 PHEV: MARKET, BY REGION, 2022–2027 (THOUSAND UNITS)
                       TABLE 184 PHEV: MARKET, BY REGION, 2018–2021 (USD MILLION)
                       TABLE 185 PHEV: MARKET, BY REGION, 2022–2027 (USD MILLION)
     11.4 FUEL-CELL ELECTRIC VEHICLES 
             11.4.1 DEVELOPMENTS IN FCEV TECHNOLOGY EXPECTED TO DRIVE MARKET
                       TABLE 186 FCEV: MARKET, BY REGION, 2018–2021 (THOUSAND UNITS)
                       TABLE 187 FCEV: MARKET, BY REGION, 2022–2027 (THOUSAND UNITS)
                       TABLE 188 FCEV: MARKET, BY REGION, 2018–2021 (USD MILLION)
                       TABLE 189 FCEV: MARKET, BY REGION, 2022–2027 (USD MILLION)
 
12 ELECTRIC VEHICLE MOTOR LAMINATION MARKET, BY APPLICATION (Page No. - 174)
     12.1 INTRODUCTION 
             12.1.1 RESEARCH METHODOLOGY
             12.1.2 PRIMARY INSIGHTS
             12.1.3 ASSUMPTIONS
                       FIGURE 37 MARKET, BY APPLICATION, 2022 VS. 2027 (USD THOUSAND)
                       TABLE 190 MARKET, BY APPLICATION, 2018–2021 (THOUSAND UNITS)
                       TABLE 191 MARKET, BY APPLICATION, 2022–2027 (THOUSAND UNITS)
                       TABLE 192 MARKET, BY APPLICATION, 2018–2021 (USD THOUSAND)
                       TABLE 193 MARKET, BY APPLICATION, 2022–2027 (USD THOUSAND)
     12.2 PERFORMANCE 
             12.2.1 RISING FUEL PRICES ACCOMPANIED BY TECHNOLOGICAL DEVELOPMENTS TO DRIVE MARKET
                       TABLE 194 PERFORMANCE: ELECTRIC VEHICLE MOTOR LAMINATION MARKET, BY REGION, 2018–2021 (THOUSAND UNITS)
                       TABLE 195 MARKET, BY REGION, 2022–2027 (THOUSAND UNITS)
                       TABLE 196 MARKET, BY REGION, 2018–2021 (USD THOUSAND)
                       TABLE 197 MARKET, BY REGION, 2022–2027 (USD THOUSAND)
     12.3 COMFORT 
             12.3.1 ELECTRIC VEHICLES WITH ADVANCED FEATURES TO DRIVE DEMAND
                       TABLE 198 COMFORT: ELECTRIC VEHICLE MOTOR LAMINATION MARKET, BY REGION, 2018–2021 (THOUSAND UNITS)
                       TABLE 199 MARKET, BY REGION, 2022–2027 (THOUSAND UNITS)
                       TABLE 200 MARKET, BY REGION, 2018–2021 (USD THOUSAND)
                       TABLE 201 MARKET, BY REGION, 2022–2027 (USD THOUSAND)
     12.4 SAFETY 
             12.4.1 INCREASING SAFETY NORMS TO DRIVE MARKET FOR SAFETY APPLICATIONS
                       TABLE 202 SAFETY: ELECTRIC VEHICLE MOTOR LAMINATION MARKET, BY REGION, 2018–2021 (THOUSAND UNITS)
                       TABLE 203 MARKET, BY REGION, 2022–2027 (THOUSAND UNITS)
                       TABLE 204 MARKET, BY REGION, 2018–2021 (USD THOUSAND)
                       TABLE 205 MARKET, BY REGION, 2022–2027 (USD THOUSAND)
 
13 ALL-TERRAIN VEHICLE MOTOR LAMINATION MARKET, BY APPLICATION (Page No. - 183)
     13.1 INTRODUCTION 
             13.1.1 RESEARCH METHODOLOGY
             13.1.2 PRIMARY INSIGHTS
             13.1.3 ASSUMPTIONS
                       FIGURE 38 ALL-TERRAIN VEHICLE MOTOR LAMINATION MARKET, BY APPLICATION, 2022 VS. 2027 (USD THOUSAND)
                       TABLE 206 MARKET, BY APPLICATION, 2018–2021 (THOUSAND UNITS)
                       TABLE 207 MARKET, BY APPLICATION, 2022–2027 (THOUSAND UNITS)
                       TABLE 208 MARKET, BY APPLICATION, 2018–2021 (USD THOUSAND)
                       TABLE 209 MARKET, BY APPLICATION, BY REGION, 2022–2027 (USD THOUSAND)
     13.2 PERFORMANCE 
             13.2.1 INCREASED INTEREST IN ADVENTURE RIDING TO DRIVE MARKET
                       TABLE 210 PERFORMANCE: ALL-TERRAIN VEHICLE MOTOR LAMINATION MARKET, BY REGION, 2018–2021 (THOUSAND UNITS)
                       TABLE 211 MARKET, BY REGION, 2022–2027 (THOUSAND UNITS)
                       TABLE 212 MARKET, BY REGION, 2018–2021 (USD THOUSAND)
                       TABLE 213 MARKET, BY REGION, 2022–2027 (USD THOUSAND)
     13.3 COMFORT 
             13.3.1 INCREASED CONSUMER PURCHASING CAPACITY AND SHIFT TOWARD ATVS TO BOOST MARKET
                       TABLE 214 COMFORT: ALL-TERRAIN VEHICLE MOTOR LAMINATION MARKET, BY REGION, 2018–2021 (THOUSAND UNITS)
                       TABLE 215 MARKET, BY REGION, 2022–2027 (THOUSAND UNITS)
                       TABLE 216 MARKET, BY REGION, 2018–2021 (USD THOUSAND)
                       TABLE 217 MARKET, BY REGION, 2022–2027 (USD THOUSAND)
     13.4 SAFETY 
             13.4.1 STRINGENT SAFETY NORMS FOR ATVS TO INCREASE DEMAND FOR SAFETY LAMINATION
                       TABLE 218 SAFETY: ALL-TERRAIN VEHICLE MOTOR LAMINATION MARKET, BY REGION, 2018–2021 (THOUSAND UNITS)
                       TABLE 219 MARKET, BY REGION, 2022–2027 (THOUSAND UNITS)
                       TABLE 220 MARKET, BY REGION, 2018–2021 (USD THOUSAND)
                       TABLE 221 MARKET, BY REGION, 2022–2027 (USD THOUSAND)
 
14 MOTOR LAMINATION MARKET, BY REGION (Page No. - 192)
     14.1 INTRODUCTION 
             14.1.1 RESEARCH METHODOLOGY
             14.1.2 PRIMARY INSIGHTS
             14.1.3 ASSUMPTIONS
                       FIGURE 39 MOTOR LAMINATION MARKET, BY REGION, 2022 VS. 2027 (USD MILLION)
                       TABLE 222 MARKET, BY REGION, 2018–2021 (MILLION UNITS)
                       TABLE 223 MARKET, BY REGION, 2022–2027 (MILLION UNITS)
                       TABLE 224 MARKET, BY REGION, 2018–2021 (USD MILLION)
                       TABLE 225 MARKET, BY REGION, 2022–2027 (USD MILLION)
     14.2 ASIA PACIFIC 
               FIGURE 40 ASIA PACIFIC: MARKET SNAPSHOT
               TABLE 226 ASIA PACIFIC: MARKET, BY COUNTRY, 2018–2021 (MILLION UNITS)
               TABLE 227 ASIA PACIFIC: MARKET, BY COUNTRY, 2022–2027 (MILLION UNITS)
               TABLE 228 ASIA PACIFIC: MARKET, BY COUNTRY, 2018–2021 (USD MILLION)
               TABLE 229 ASIA PACIFIC: MARKET, BY COUNTRY, 2022–2027 (USD MILLION)
             14.2.1 CHINA
                       14.2.1.1 Heavy investments in domestic manufacturing to boost motor lamination market in China
                                   TABLE 230 CHINA: MARKET, BY APPLICATION, 2018–2021 (MILLION UNITS)
                                   TABLE 231 CHINA: MARKET, BY APPLICATION, 2022–2027 (MILLION UNITS)
                                   TABLE 232 CHINA: MARKET, BY APPLICATION, 2018–2021 (USD MILLION)
                                   TABLE 233 CHINA: MARKET, BY APPLICATION, 2022–2027 (USD MILLION)
             14.2.2 INDIA
                       14.2.2.1 Government reforms to drive motor lamination market
                                   TABLE 234 INDIA: MARKET, BY APPLICATION, 2018–2021 (MILLION UNITS)
                                   TABLE 235 INDIA: MARKET, BY APPLICATION, 2022–2027 (MILLION UNITS)
                                   TABLE 236 INDIA: MARKET, BY APPLICATION, 2018–2021 (USD MILLION)
                                   TABLE 237 INDIA: MARKET, BY APPLICATION, 2022–2027 (USD MILLION)
             14.2.3 JAPAN
                       14.2.3.1 Increase in government support and presence of key players to drive market
                                   TABLE 238 JAPAN: MARKET, BY APPLICATION, 2018–2021 (MILLION UNITS)
                                   TABLE 239 JAPAN: MARKET, BY APPLICATION, 2022–2027 (MILLION UNITS)
                                   TABLE 240 JAPAN: MARKET, BY APPLICATION, 2018–2021 (USD MILLION)
                                   TABLE 241 JAPAN: MARKET, BY APPLICATION, 2022–2027 (USD MILLION)
             14.2.4 SOUTH KOREA
                       14.2.4.1 High investments in R&D for electric vehicles to drive motor lamination market
                                   TABLE 242 SOUTH KOREA: MARKET, BY APPLICATION, 2018–2021 (MILLION UNITS)
                                   TABLE 243 SOUTH KOREA: MARKET, BY APPLICATION, 2022–2027 (MILLION UNITS)
                                   TABLE 244 SOUTH KOREA: MARKET, BY APPLICATION, 2018–2021 (USD MILLION)
                                   TABLE 245 SOUTH KOREA: MARKET, BY APPLICATION, 2022–2027 (USD MILLION)
             14.2.5 REST OF ASIA PACIFIC
                       14.2.5.1 Increase in demand for advanced features to drive rest of Asia Pacific market
                                   TABLE 246 REST OF ASIA PACIFIC: MOTOR LAMINATION MARKET, BY APPLICATION, 2018–2021 (MILLION UNITS)
                                   TABLE 247 REST OF ASIA PACIFIC: MARKET, BY APPLICATION, 2022–2027 (MILLION UNITS)
                                   TABLE 248 REST OF ASIA PACIFIC: MARKET, BY APPLICATION, 2018–2021 (USD MILLION)
                                   TABLE 249 REST OF ASIA PACIFIC: MARKET, BY APPLICATION, 2022–2027 (USD MILLION)
     14.3 EUROPE 
               FIGURE 41 EUROPE: MARKET, BY COUNTRY, 2022 VS. 2027 (USD MILLION)
               TABLE 250 EUROPE: MARKET, BY COUNTRY, 2018–2021 (MILLION UNITS)
               TABLE 251 EUROPE: MARKET, BY COUNTRY, 2022–2027 (MILLION UNITS)
               TABLE 252 EUROPE: MARKET, BY COUNTRY, 2018–2021 (USD MILLION)
               TABLE 253 EUROPE: MARKET, BY COUNTRY, 2022–2027 (USD MILLION)
             14.3.1 GERMANY
                       14.3.1.1 Increase in focus on materials development to drive motor lamination market
                                   TABLE 254 GERMANY: MARKET, BY APPLICATION, 2018–2021 (MILLION UNITS)
                                   TABLE 255 GERMANY: MARKET, BY APPLICATION, 2022–2027 (MILLION UNITS)
                                   TABLE 256 GERMANY: MARKET, BY APPLICATION, 2018–2021 (USD MILLION)
                                   TABLE 257 GERMANY: MARKET, BY APPLICATION, 2022–2027 (USD MILLION)
             14.3.2 FRANCE
                       14.3.2.1 Increase in adoption of electric vehicles to drive motor lamination market
                                   TABLE 258 FRANCE: MARKET, BY APPLICATION, 2018–2021 (MILLION UNITS)
                                   TABLE 259 FRANCE: MARKET, BY APPLICATION, 2022–2027 (MILLION UNITS)
                                   TABLE 260 FRANCE: MARKET, BY APPLICATION, 2018–2021 (USD MILLION)
                                   TABLE 261 FRANCE: MARKET, BY APPLICATION, 2022–2027 (USD MILLION)
             14.3.3 UK
                       14.3.3.1 Huge investments in R&D activities to drive motor lamination market
                                   TABLE 262 UK: MARKET, BY APPLICATION, 2018–2021 (MILLION UNITS)
                                   TABLE 263 UK: MARKET, BY APPLICATION, 2022–2027 (MILLION UNITS)
                                   TABLE 264 UK: MARKET, BY APPLICATION, 2018–2021 (USD MILLION)
                                   TABLE 265 UK: MARKET, BY APPLICATION, 2022–2027 (USD MILLION)
             14.3.4 SPAIN
                       14.3.4.1 Demand for premium and luxury vehicles to drive motor lamination market
                                   TABLE 266 SPAIN: MARKET, BY APPLICATION, 2018–2021 (MILLION UNITS)
                                   TABLE 267 SPAIN: MARKET, BY APPLICATION, 2022–2027 (MILLION UNITS)
                                   TABLE 268 SPAIN: MARKET, BY APPLICATION, 2018–2021 (USD MILLION)
                                   TABLE 269 SPAIN: MARKET, BY APPLICATION, 2022–2027 (USD MILLION)
             14.3.5 ITALY
                       14.3.5.1 Presence of ultra-premium vehicle manufacturers to drive motor lamination market
                                   TABLE 270 ITALY: MARKET, BY APPLICATION, 2018–2021 (MILLION UNITS)
                                   TABLE 271 ITALY: MARKET, BY APPLICATION, 2022–2027 (MILLION UNITS)
                                   TABLE 272 ITALY: MARKET, BY APPLICATION, 2018–2021 (USD MILLION)
                                   TABLE 273 ITALY: MARKET, BY APPLICATION, 2022–2027 (USD MILLION)
             14.3.6 RUSSIA
                       14.3.6.1 Demand for motor lamination in Russia mainly driven by demand for comfort motors
                                   TABLE 274 RUSSIA: MARKET, BY APPLICATION, 2018–2021 (MILLION UNITS)
                                   TABLE 275 RUSSIA: MARKET, BY APPLICATION, 2022–2027 (MILLION UNITS)
                                   TABLE 276 RUSSIA: MARKET, BY APPLICATION, 2018–2021 (USD MILLION)
                                   TABLE 277 RUSSIA: MARKET, BY APPLICATION, 2022–2027 (USD MILLION)
             14.3.7 REST OF EUROPE
                       14.3.7.1 Increase in concern for vehicular pollution to drive motor lamination market
                                   TABLE 278 REST OF EUROPE: MARKET, BY APPLICATION, 2018–2021 (MILLION UNITS)
                                   TABLE 279 REST OF EUROPE: MARKET, BY APPLICATION, 2022–2027 (MILLION UNITS)
                                   TABLE 280 REST OF EUROPE: MARKET, BY APPLICATION, 2018–2021 (USD MILLION)
                                   TABLE 281 REST OF EUROPE: MARKET, BY APPLICATION, 2022–2027 (USD MILLION)
     14.4 NORTH AMERICA 
               FIGURE 42 NORTH AMERICA: MARKET SNAPSHOT
               TABLE 282 NORTH AMERICA: MARKET, BY COUNTRY, 2018–2021 (MILLION UNITS)
               TABLE 283 NORTH AMERICA: MARKET, BY COUNTRY, 2022–2027 (MILLION UNITS)
               TABLE 284 NORTH AMERICA: MARKET, BY COUNTRY, 2018–2021 (USD MILLION)
               TABLE 285 NORTH AMERICA: MARKET, BY COUNTRY, 2022–2027 (USD MILLION)
             14.4.1 US
                       14.4.1.1 Growth in electric car market to drive demand for motor laminations
                                   TABLE 286 US: MARKET, BY APPLICATION, 2018–2021 (MILLION UNITS)
                                   TABLE 287 US: MARKET, BY APPLICATION, 2022–2027 (MILLION UNITS)
                                   TABLE 288 US: MARKET, BY APPLICATION, 2018–2021 (USD MILLION)
                                   TABLE 289 US: MARKET, BY APPLICATION, 2022–2027 (USD MILLION)
             14.4.2 CANADA
                       14.4.2.1 Government support for electric vehicles to drive demand for motor laminations
                                   TABLE 290 CANADA: MOTOR LAMINATION MARKET, BY APPLICATION, 2018–2021 (MILLION UNITS)
                                   TABLE 291 CANADA: MARKET, BY APPLICATION, 2022–2027 (MILLION UNITS)
                                   TABLE 292 CANADA: MARKET, BY APPLICATION, 2018–2021 (USD MILLION)
                                   TABLE 293 CANADA: MARKET, BY APPLICATION, 2022–2027 (USD MILLION)
             14.4.3 MEXICO
                       14.4.3.1 Increase in vehicle manufacturing facilities to drive demand for motor lamination
                                   TABLE 294 MEXICO: MARKET, BY APPLICATION, 2018–2021 (MILLION UNITS)
                                   TABLE 295 MEXICO: MARKET, BY APPLICATION, 2022–2027 (MILLION UNITS)
                                   TABLE 296 MEXICO: MARKET, BY APPLICATION, 2018–2021 (USD MILLION)
                                   TABLE 297 MEXICO: MARKET, BY APPLICATION, 2022–2027 (USD MILLION)
     14.5 REST OF THE WORLD 
               FIGURE 43 REST OF THE WORLD: MOTOR LAMINATION MARKET, BY COUNTRY, 2022 VS. 2027 (USD MILLION)
               TABLE 298 REST OF THE WORLD: MARKET, BY COUNTRY, 2018–2021 (MILLION UNITS)
               TABLE 299 REST OF THE WORLD: MARKET, BY COUNTRY, 2022–2027 (MILLION UNITS)
               TABLE 300 REST OF THE WORLD: MARKET, BY COUNTRY, 2018–2021 (USD MILLION)
               TABLE 301 REST OF THE WORLD: MARKET, BY COUNTRY, 2022–2027 (USD MILLION)
             14.5.1 BRAZIL
                       14.5.1.1 Demand for performance motors to drive motor lamination market
                                   TABLE 302 BRAZIL: MARKET, BY APPLICATION, 2018–2021 (MILLION UNITS)
                                   TABLE 303 BRAZIL: MARKET, BY APPLICATION, 2022–2027 (MILLION UNITS)
                                   TABLE 304 BRAZIL: MARKET, BY APPLICATION, 2018–2021 (USD MILLION)
                                   TABLE 305 BRAZIL: MARKET, BY APPLICATION, 2022–2027 (USD MILLION)
             14.5.2 SOUTH AFRICA
                       14.5.2.1 Demand from premium car makers to drive motor lamination market
                                   TABLE 306 SOUTH AFRICA: MARKET, BY APPLICATION, 2018–2021 (MILLION UNITS)
                                   TABLE 307 SOUTH AFRICA: MARKET, BY APPLICATION, 2022–2027 (MILLION UNITS)
                                   TABLE 308 SOUTH AFRICA: MARKET, BY APPLICATION, 2018–2021 (USD MILLION)
                                   TABLE 309 SOUTH AFRICA: MARKET, BY APPLICATION, 2022–2027 (USD MILLION)
             14.5.3 OTHER COUNTRIES IN ROW
                       14.5.3.1 Increase in stringent safety norms to drive motor lamination market
                                   TABLE 310 OTHER COUNTRIES IN REST OF WORLD: MARKET, BY APPLICATION, 2018–2021 (MILLION UNITS)
                                   TABLE 311 OTHER COUNTRIES IN REST OF WORLD: MARKET, BY APPLICATION, 2022–2027 (MILLION UNITS)
                                   TABLE 312 OTHER COUNTRIES IN REST OF WORLD: MARKET, BY APPLICATION, 2018–2021 (USD MILLION)
                                   TABLE 313 OTHER COUNTRIES IN REST OF WORLD: MARKET, BY APPLICATION, 2022–2027 (USD MILLION)
 
15 COMPETITIVE LANDSCAPE (Page No. - 230)
     15.1 OVERVIEW 
     15.2 MOTOR LAMINATION MARKET SHARE ANALYSIS, 2021 
               TABLE 314 MARKET: SHARE ANALYSIS, 2021
               FIGURE 44 MARKET SHARE, 2021
     15.3 REVENUE ANALYSIS OF KEY MOTOR LAMINATION PLAYERS 
               TABLE 315 MARKET: COMPANY PRODUCT FOOTPRINT, 2021
               TABLE 316 MARKET: COMPANY TECHNOLOGY TYPE FOOTPRINT, 2021
               TABLE 317 MARKET: COMPANY REGION FOOTPRINT, 2021
               TABLE 318 MARKET: COMPETITIVE BENCHMARKING, BY APPLICATION
     15.4 COMPETITIVE EVALUATION QUADRANT: MOTOR LAMINATION MANUFACTURERS 
             15.4.1 STARS
             15.4.2 EMERGING LEADERS
             15.4.3 PERVASIVE PLAYERS
             15.4.4 PARTICIPANTS
                       FIGURE 45 MOTOR LAMINATION MARKET: COMPETITIVE EVALUATION MATRIX, 2021
     15.5 COMPETITIVE EVALUATION QUADRANT: MOTOR MANUFACTURERS 
             15.5.1 STARS
             15.5.2 EMERGING LEADERS
             15.5.3 PERVASIVE PLAYERS
             15.5.4 PARTICIPANTS
                       FIGURE 46 MOTOR LAMINATION MARKET: COMPETITIVE EVALUATION QUADRANT, 2021
 
16 COMPANY PROFILES (Page No. - 240)
(Business overview, Products offered, Recent developments & MnM View)*
     16.1 KEY PLAYERS 
             16.1.1 PITTI LAMINATIONS LTD.
                       TABLE 319 PITTI LAMINATIONS LTD.: BUSINESS OVERVIEW
                       FIGURE 47 PITTI LAMINATIONS LTD.: COMPANY SNAPSHOT
                       TABLE 320 PITTI LAMINATIONS LTD.: PRODUCTS OFFERED
             16.1.2 TEMPEL
                       TABLE 321 TEMPEL: BUSINESS OVERVIEW
                       TABLE 322 TEMPEL: PRODUCTS OFFERED
             16.1.3 EUROGROUP S.P.A
                       TABLE 323 EUROGROUP S.P.A: BUSINESS OVERVIEW
                       TABLE 324 EUROGROUP S.P.A: PRODUCTS OFFERED
             16.1.4 R. BOURGEOIS
                       TABLE 325 R. BOURGEOIS: BUSINESS OVERVIEW
                       TABLE 326 R. BOURGEOIS: PRODUCTS OFFERED
             16.1.5 LAMINATION SPECIALTIES
                       TABLE 327 LAMINATION SPECIALTIES: BUSINESS OVERVIEW
                       TABLE 328 LAMINATION SPECIALTIES: PRODUCTS OFFERED
                       TABLE 329 LAMINATION SPECIALTIES: DEALS
             16.1.6 ALINABAL INC.
                       TABLE 330 ALINABAL INC.: BUSINESS OVERVIEW
                       TABLE 331 ALINABAL INC.: PRODUCTS OFFERED
             16.1.7 PARTZSCH GROUP
                       TABLE 332 PARTZSCH GROUP: BUSINESS OVERVIEW
             16.1.8 WINGARD & CO
                       TABLE 333 WINGARD & CO: BUSINESS OVERVIEW
                       TABLE 334 WINGARD & CO: PRODUCTS OFFERED
             16.1.9 UNITED STATES STEEL CORPORATION
                       TABLE 335 UNITED STATES STEEL CORPORATION: BUSINESS OVERVIEW
                       FIGURE 48 UNITED STATES STEEL CORPORATION: COMPANY SNAPSHOT
                       TABLE 336 UNITED STATES STEEL CORPORATION: PRODUCTS OFFERED
                       TABLE 337 UNITED STATES STEEL CORPORATION: DEALS
             16.1.10 LCS COMPANY
                       TABLE 338 LCS COMPANY: BUSINESS OVERVIEW
                       TABLE 339 LCS COMPANY: PRODUCTS OFFERED
*Details on Business overview, Products offered, Recent developments & MnM View might not be captured in case of unlisted companies.
     16.2 OTHER KEY PLAYERS 
             16.2.1 POLARIS LASER LAMINATIONS
                       TABLE 340 POLARIS LASER LAMINATIONS: BUSINESS OVERVIEW
             16.2.2 ADVANCED TECHNOLOGY & MATERIALS CO., LTD
                       TABLE 341 ADVANCED TECHNOLOGY & MATERIALS CO., LTD: BUSINESS OVERVIEW
             16.2.3 METGLAS INC.
                       TABLE 342 METGLAS INC.: BUSINESS OVERVIEW
             16.2.4 ORCHID
                       TABLE 343 ORCHID: BUSINESS OVERVIEW
             16.2.5 THOMSON LAMINATION COMPANY, INC.
                       TABLE 344 THOMSON LAMINATION COMPANY, INC.: BUSINESS OVERVIEW
             16.2.6 LAKE AIR
                       TABLE 345 LAKE AIR: BUSINESS OVERVIEW
             16.2.7 APERAM
                       TABLE 346 APERAM: BUSINESS OVERVIEW
             16.2.8 SINOTECH
                       TABLE 347 SINOTECH: BUSINESS OVERVIEW
             16.2.9 MAGCORE
                       TABLE 348 MAGCORE: BUSINESS OVERVIEW
             16.2.10 LASER TECHNOLOGIES
                       TABLE 349 LASER TECHNOLOGIES: BUSINESS OVERVIEW
 
17 RECOMMENDATIONS BY MARKETSANDMARKETS (Page No. - 264)
     17.1 ASIA PACIFIC ESTIMATED TO BE ATTRACTIVE MARKET FOR MOTOR LAMINATIONS 
     17.2 RISE IN DEMAND FOR EVS TO CREATE NEW OPPORTUNITIES FOR ADVANCED MOTOR LAMINATIONS 
     17.3 STRINGENT SAFETY PROVISIONS TO BOOST SAFETY MOTOR LAMINATION MARKET 
     17.4 CONCLUSION 
 
18 APPENDIX (Page No. - 266)
     18.1 KEY INSIGHTS OF INDUSTRY EXPERTS 
     18.2 DISCUSSION GUIDE 
     18.3 KNOWLEDGESTORE: MARKETSANDMARKETS’ SUBSCRIPTION PORTAL 
     18.4 AVAILABLE CUSTOMIZATIONS 
             18.4.1 MOTOR LAMINATION MARKET, BY MOTOR TYPE AND VEHICLE TYPE
                       18.4.1.1 Passenger Cars
                       18.4.1.2 Light Commercial Vehicles (LCVs)
                       18.4.1.3 Trucks
                       18.4.1.4 Buses
     18.5 RELATED REPORTS 
     18.6 AUTHOR DETAILS 

The study involved four major activities in estimating the current size of the motor lamination market. Exhaustive secondary research was done to collect information on the market, the peer market, and the parent market. The next step was to validate these findings, assumptions, and sizing with the industry experts across value chains through primary research. The bottom-up and top-down approaches were employed to estimate the complete market size. Thereafter, market breakdown and data triangulation processes were used to estimate the market size of segments and subsegments.

Secondary Research

The secondary sources referred to for this research study include publications from government sources [such as country-level automotive associations and organizations, Organisation for Economic Co-operation and Development (OECD), World Bank, CDC, and Eurostat]; corporate and regulatory filings (such as annual reports, SEC filings, investor presentations, and financial statements); business magazines and research journals; press releases; free and paid automotive databases [Organisation Internationale des Constructeurs d'Automobiles (OICA), MarkLines, etc.] and trade, business, and professional associations; among others. Trade websites and technical articles have been used to identify and collect information useful for an extensive commercial study of the motor lamination market.

Primary Research

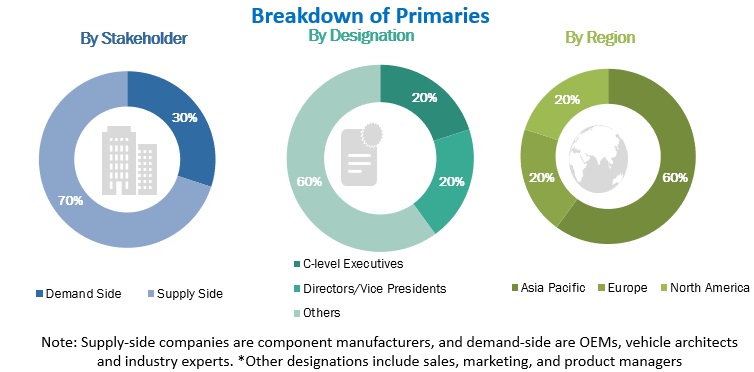
In the primary research process, various primary sources from both the supply side and demand side and other stakeholders were interviewed to obtain qualitative and quantitative information on the market. Primary interviews have been conducted to gather insights such as motor lamination penetration demand by application, material, technology, and highest potential region for the motor lamination market. The primary sources from the supply side included various industry experts, such as CXOs, vice presidents, directors from business development, marketing, product development/innovation teams, vehicle architecture experts and related key executives from various key companies. Below is the breakdown of primary respondents:
Motor Lamination Market Size, and Share

To know about the assumptions considered for the study, download the pdf brochure

Market Size Estimation

The top-down and bottom-up approaches were used to estimate and validate the size of the motor lamination market. In these approaches, the production statistics for passenger cars, LCVs, trucks, and buses in a country and production statistics of BEVs, PHEVs, FCEVs, along with ATVs at the regional level were considered to estimate the aggregate market of various motor lamination segments. The research methodology used to estimate the market size includes the following:

  • Key players in the motor lamination market were identified through secondary research, and their global market shares were determined through primary and secondary research.
  • The research methodology included the study of the annual and quarterly financial reports & regulatory filings of major market players as well as interviews with industry experts for detailed market insights.
  • All application-level penetration rates, percentage shares, splits, and breakdowns for the motor lamination market was determined by using secondary sources and verified through primary sources.
  • All key macro indicators affecting the revenue growth of the market segments and sub-segments have been accounted for, viewed in extensive detail, verified through primary research, and analyzed to get the validated and verified quantitative & qualitative data.
  • The gathered market data was consolidated and added with detailed inputs, analyzed, and presented in this report.

Bottom-Up Approach

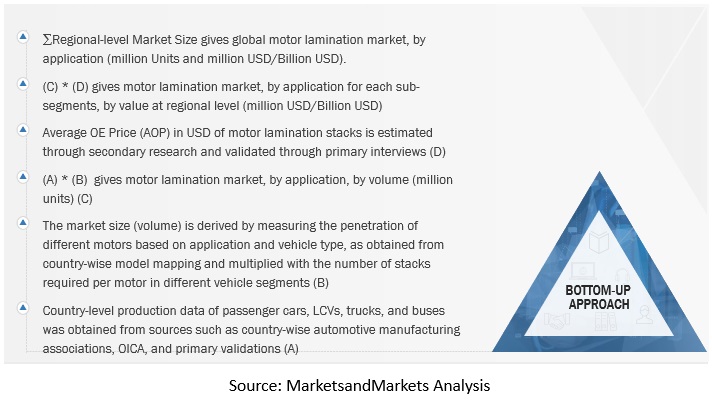
In the bottom-up approach, the market size, by volume, of the automotive motor lamination market has been derived by identifying the country level production trend. The detailed model mapping was conducted to understand the usage of motors, in terms of application (performance, comfort, and safety). To estimate the market, country level production has been derived. The derived production volume is then distinguished by the requirement of motors as per the applications and the number of motors required for each application. This was further categorized by understanding the average lamination stack required/used by each application and motor. This led us to the total number of lamination stack used in each country, by motor type and application. This was further summed at the regional level to get the global volume, in terms of units. Further, the summation of the regional markets provided the global motor lamination market size.

Motor Lamination Market (by Application): Bottom-Up Approach
Motor Lamination Market Size, and Share

To know about the assumptions considered for the study, Request for Free Sample Report

Top-Down Approach

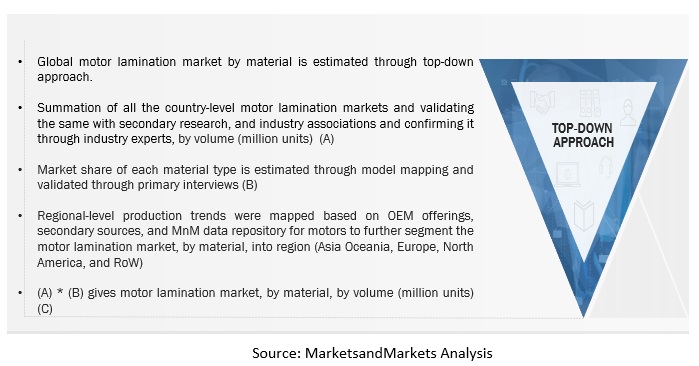
The top-down approach was used to estimate and validate the market size of the motor lamination market, by material, in terms of volume. To derive the market size for lamination by material type (million units), the global motor lamination market (million units) has been multiplied by the respective market share of motor type in each industry from secondary research and validated by primary respondents. The global market has been segmented at the regional level based on secondary findings and data repository for motors to further segment the motor lamination market by material at regional level.

Motor Lamination Market (by Material): Top-Down Approach
Motor Lamination Market Size, and Share

Data Triangulation

After arriving at the overall market size of the global market through the above-mentioned methodology, this market was split into several segments and sub-segments. The data triangulation and market breakdown procedure were employed, wherever applicable, to complete the overall market engineering process and arrive at the exact market value data for the key segments and sub-segments. The extrapolated market data was triangulated by studying various macro indicators and regional trends from both the demand- and supply-side participants.

Report Objectives

  • To define, describe, and project the motor lamination market in terms of volume (thousand units) and value (USD million) based on:
    • Application (performance, safety, and comfort)
    • Technology (welding, bonding, stamping, and others)
    • Vehicle type (passenger cars, LCVs, trucks, and buses)
    • Electric vehicle type (BEVs, PHEVs, and FCEVs)
    • Material type (cold-rolled non-oriented steels, cold-rolled non-grained-oriented steels, and others)
    • Motor type (electric water pump motors, radiator cooling fan motors, electronic throttle valve control motors, electronic variable gear ratio motors, electronic variable valve timing motors, variable nozzle turbo motors, adjustable pedal motors, electric power steering motors, wiper motors, starter motors, EGR motors, fuel pump motors, power antenna motors, air conditioner motors, door mirror motors, power window motors, tilt steering column motors, blower motors, power seat motors, electric sunroof motors, door closer motors, cruise control motors, adaptive front light motors, electronic stability control motors, ABS motors, and electronic parking brake motors)
    • Electric vehicle motor lamination market, by application (performance, safety, and comfort)
    • All-terrain vehicle motor lamination market, by application (performance, safety, and comfort)
    • Region (Asia Pacific, Europe, North America, and RoW)
  • To provide detailed information regarding major factors (drivers, restraints, opportunities, and challenges) influencing the motor lamination market
  • To analyze competitive developments such as joint ventures, mergers & acquisitions, new product developments, and expansions in the motor lamination market
  • To conduct a case study analysis, technology analysis, supply chain analysis, trade analysis, market ecosystem analysis, tariff and regulatory landscape analysis, Porter’s Five Forces analysis, and average selling price analysis
  • To analyze the market share of key players in the motor lamination market and conduct a revenue analysis of the top five players
  • To formulate the competitive leadership mapping of key players in the motor lamination market.

Customization Options

With the given market data, MarketsandMarkets offers customizations according to the company’s specific needs.

The following customization options are available for the report:

Motor Lamination Market, by End use type

  • Appliances
  • Infrastructure
  • Electrical industry

(Note: Countries included in the study: China, India, Japan, South Korea, Thailand, Germany, UK, France, Spain, Italy, US, Canada, Mexico, Brazil, Russia)

Custom Market Research Services

We will customize the research for you, in case the report listed above does not meet with your exact requirements. Our custom research will comprehensively cover the business information you require to help you arrive at strategic and profitable business decisions.

Request Customization

Instant Answers with GPT - Ask Now!

Ask real questions. Get complete answers !
Report Code
AT 6928
Published ON
Dec, 2022
Choose License Type
BUY NOW
  • SHARE
X
Request Customization
Speak to Analyst
Speak to Analyst
OR FACE-TO-FACE MEETING
PERSONALIZE THIS RESEARCH
  • Triangulate with your Own Data
  • Get Data as per your Format and Definition
  • Gain a Deeper Dive on a Specific Application, Geography, Customer or Competitor
  • Any level of Personalization
REQUEST A FREE CUSTOMIZATION
LET US HELP YOU!
  • What are the Known and Unknown Adjacencies Impacting the Motor Lamination Market
  • What will your New Revenue Sources be?
  • Who will be your Top Customer; what will make them switch?
  • Defend your Market Share or Win Competitors
  • Get a Scorecard for Target Partners
CUSTOMIZED WORKSHOP REQUEST
knowledgestore logo

Want to explore hidden markets that can drive new revenue in Motor Lamination Market?

Find Hidden Markets
  • Call Us
  • +1-888-600-6441 (Corporate office hours)
  • +1-888-600-6441 (US/Can toll free)
  • +44-800-368-9399 (UK office hours)
CONNECT WITH US
ABOUT TRUST ONLINE
©2024 MarketsandMarkets Research Private Ltd. All rights reserved
DMCA.com Protection Status
Website Feedback