MOSFET Relay Market

MOSFET Relay Market by Voltage (Below 200V, 200-500V, 500-1kV, 1-7.5kV, 7.5-10kV, Above 10 kV), Application (Industrial, Household Appliances, Test & Measurements, Mining, Automotive, Medical, Renewables, Charging Stations) - Global Forecast to 2030

Report Code: EP 8530 Jan, 2023, by marketsandmarkets.com

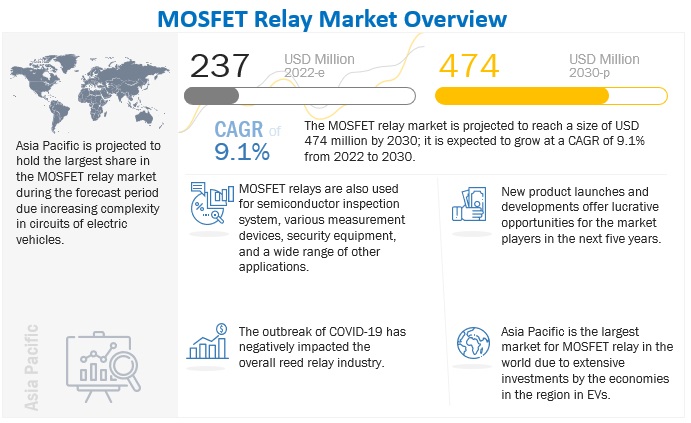
[196 Pages Report] The MOSFET relay market is expected to grow from an estimated USD 237 million in 2022 to USD 474 million by 2030, at a CAGR of 9.1% during the forecast period. Increase in overall revenue projection of semiconductor industry despite covid-19 crisis, growing adoption of high-tech electronics and automation in consumer electronics industry, increasing complexity in circuits in electric vehicles, and robust features of SSR, is likely to propel the growth of MOSFET relay market.

MOSFET relay market Dynamics
MOSFET Relay Market

To know about the assumptions considered for the study, Request for Free Sample Report

Driver: Increasing demand for instrumentation devices

MOSFET relays are mainly utilized in test & measurement/instrumentation devices. Increasingly sophisticated testing and measuring devices are in demand for the electronics, medical, healthcare, and automotive sectors, among others. These complex applications require a high density of assembled components along with high reliability and the utmost accuracy. They are suitable for applications like Automated Test Equipment (ATE), multimeters, semiconductor test boards, oscilloscopes, data loggers, and other measurement instruments. As mentioned earlier for reed relays, as the demand for electronic devices increases, the need for test and measurement instruments will also increase.

According to the statistics shared by the National Investment Promotion & Facilitation Agency (INVEST INDIA), the global electronics market is estimated to be over USD 2 trillion in the next ten years (by 2030). As different industries, including automotive, aerospace & defense, and healthcare, have started adopting electronic devices on a large scale, testing of such devices has also become a prime concern for manufacturers worldwide. Hence, as the demand for electronic devices increases, the need for test and measurement instruments will also increase. This will further boost the demand for reed relays. Furthermore, the advent of advanced communication technologies like 5G and wireless is increasing the demand for testing equipment further.

Restraint: Higher cost and requirement of higher initial investment as compared to EMR

About 70% of end-user industries still use electromechanical relays (EMRs), considering their low cost, reliability, and simple construction. EMR operates on the principle of electromagnetic attraction. In this relay, an electromagnetic field is created as the current passes through the circuit that attracts the nodes and closes the circuit. The working of an EMR is based on mechanical, electrical, and magnetic operations. EMRs are used for functions such as control, automation, and protection of electrical equipment. They are used in applications such as electric fuel pumps, audio amplifiers, lighting control systems, telecommunications, industrial process controllers, motor drive controls, protection systems, HVACs, automobiles, and home appliances.

MOSFET relays exhibit features such as high switching frequency, resistance to shock, long operating life, low noise while operating, small size, and less maintenance. However, the use of MOSFET relays requires the use of heat sinks, which increases their overall cost. The average cost of MOSFET relays is almost double the cost of an EMR. The advanced features of MOSFET relays over EMR come with a higher cost. In the long run, the total ownership of MOSFET relays is beneficial over EMR. However, the high initial investment acts as a restraining factor for the growth of the MOSFET relays market.

Opportunity: Strong growth from enterprises shift towards cloud applications

Cloud-based computing, networking and storage infrastructure, and cloud-native applications are trending in all business verticals. With the growing need for a truly connected world through cloud computing systems, the demand for cloud-based applications is rising. The construction of data centers and deployment of data warehousing are still vital for data storage, computation, and information management.

However, the transfer of data to-and-fro from a centralized data center system is costly and delayed. Thus, the industrial end-users are moving toward cloud platforms such as Microsoft Azure, Google Cloud, Amazon Web Services, IBM Bluemix, and SaaS. The growth trends show the fast deployment of cloud-based applications across end-users. This, in turn, creates opportunities for smart and compact MOSFET relays that can meet the rising power demand for operating such platforms.

Challenge: Robust features and benefits of MOSFET relays

MOSFET relays rely on an electronic circuit to fulfill the desired input and output characteristics. The output of MOSFET relays can be either AC or DC, which is dependent upon the input current rating. The AC load-switching SSRs turn the circuit off when the AC wave passes through the zero point. Similarly, the response time for DC loads is in the millisecond range. MOSFET relays can be made to switch at high frequencies, serving as interfaces for high-speed counting and high-frequency applications. MOSFET relays are an ideal option to be used in harsh environments as they can withstand shocks and vibrations needed to work under erratic and unreliable operating conditions. For instance, an EMR typically has a functional shock resistance of about 50 G and functional vibration resistance of only 20 G, whereas MOSFET relays have a functional shock resistance of up to 500 G and a time duration is 0.5 milliseconds, making it highly resistible.

The typical life expectancy of MOSFET relays is 50 times that of an EMR. The life of an EMR is calculated based on the number of switching cycles, whereas the life of a MOSFET relay is calculated by time-in-operation. The life of MOSFET relays is further increased by the use of a heat sink. The heat sink protects MOSFET relays from overheating and causing a meltdown, thus having a long operating life.

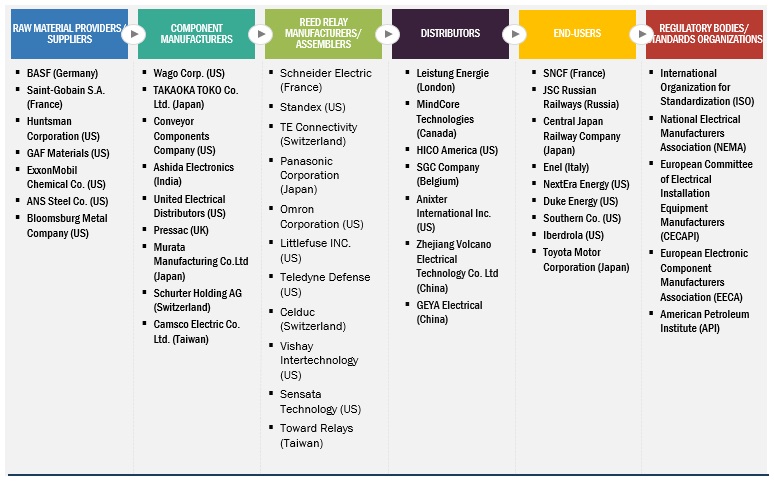
MOSFET relay Market Ecosystem
MOSFET Relay Market

To know about the assumptions considered for the study, download the pdf brochure

Test & Measurements is the second largest growing segment of the MOSFET relay market

For the spread of microcomputer chips, the latest instruments are required to measure a variety of signals at high speeds under various conditions. MOSFET relays are used for measurement scanning functions, automatic zero-point compensation to eliminate zeropoint error, and measurement sequence interfaces (e.g., alarm interface). They offer a substantial advantage over an electromechanical relay because they significantly reduce the test time in a production environment due to their fast-switching speed. MOSFET relays are used in many parts of the test & measurement market to route high voltage signals and charge/discharge and isolate different parts of test circuits and systems.

Above 1kV voltage rating is the third largest segment by voltage rating in MOSFET relay market

High-voltage MOSFET relays in this segment have a voltage range of up to 7.5 kV. It is specifically designed for high-current applications commonly found in industrial equipment. The relay is a solid-state replacement for single-pole, normally open, electromechanical relays. They are prominent in providing highly efficient performance characteristics in insulation resistance and stand-off voltage.

These types of MOSFET relays feature very high isolation voltages (7.5 kV–10 kV) and high vacuum switches with either rhodium or tungsten contacts. They also have PCB or panel mounting and excellent AC characteristics. Rhodium contact relays have low contact resistance, while tungsten contact relays can switch at higher voltages. These relay applications include cardiac defibrillators, test equipment, and high-voltage power supplies.

This MOSFET relay features high-voltage switching and high-load current. The relay provides a surface mount option when the application requires it. Both configurations are ideally suited to test & measurement, solar, and battery management applications. These relay applications include telecommunications, measuring and testing equipment, industrial controls, automatic meter reading devices, and high-inspection arc-free machines with no snubbing circuits.

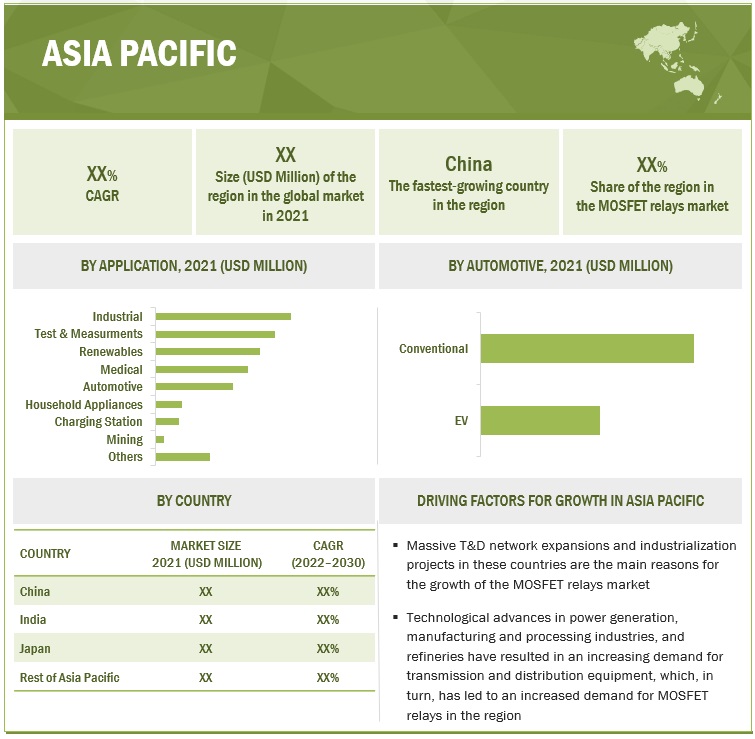
Asia Pacific is expected to account for the largest market size during the forecast period.

The growth of the market in this region can be attributed to the tremendous growth of the automotive, test & measurement, and medical industries in emerging economies such as Japan, India, New Zealand, and the Philippines. India is a key contributor to the growth of the MOSFET relay market in Asia Pacific owing to the expanding industrial and manufacturing sectors. It is also the second fastest-growing market for MOSFET relays in Asia Pacific. Japan is also witnessing steady growth in the MOSFET relay market owing to the presence of key manufacturers such as OMRON and Panasonic.
MOSFET Relay Market Size, and Share

Key Players

Key Players include TE Connectivity (Switzerland), Standex Electronics Inc. (US), Panasonic Corporation (Japan), Schneider Electric (France), and Omron Corporation (US), Wago (US), Relpol S.A (Poland), Broadcom (US), Vishay Intertechnology (US), Sensata Technology (US), Toward Relays (Taiwan), Littlefuse INC. (US), Toshiba (Japan), Teledyne Defense (US), Celduc (Switzerland), Chordn Electric (Switzerland), Carlo Gavazzi (Switzerland).

Want to explore hidden markets that can drive new revenue in MOSFET Relay Market?

Scope of the Report

Report Metrics

Details

Market Size available for years 2020–2030
Base year considered 2021
Forecast period 2022–2030
Forecast units Value (USD Million)
Segments covered By Voltage, By Application
Geographies covered Asia Pacific, North America, Europe, Rest of the World (RoW)
Companies covered Panasonic Corporation (Japan), TE Connectivity (Switzerland), Omron Corporation (Japan), Schneider Electric (France), and Standex Electronics Inc. (US), Wago (US), Relpol S.A (Poland), Broadcom (US), Vishay Intertechnology (US), Sensata Technology (US), Toward Relays (Taiwan), Littlefuse INC. (US), Toshiba (Japan), Teledyne Defense (US), Celduc (Switzerland), Chordn Electric (Switzerland), Carlo Gavazzi (Switzerland).

This research report categorizes the MOSFET relay market based on type, phase, voltage range, end user, and geography.

By Voltage
  • Basic200 V
  • 200 V–500 V
  • 500 V–1 kV
  • above 1 kV
By Application
  • Industrial
  • Household Appliances
  • Test & Measurement
  • Mining
  • Automotive
  • Medical
  • Renewables
  • Charging Station
  • Others
By Geography
  • North America
  • Asia Pacific
  • Europe
  • RoW

Recent Developments

  • In April 2022, Panasonic Corporation introduced PhotoMOS CC TSON 1 Form B Semiconductor Relays which have a small TSON package, built-in capacitor coupled isolation driver IC, and an oscillation circuit.
  • In May 2021, Standex International Corporation acquired photo MOSFET switch-based relay company American Relays, Inc. This acquisition helps Standex International Corporation to strengthen its position in the test and measurement application in the North American relay market.
  • In March 2022, Omron Corporation introduced the G3VM-201WR MOSFET relay which has a voltage of 200V with a current carrying capacity of up to 0.35A. It comes with P-SON four-pin terminal pad package, and it is used in test and measurement applications.

Frequently Asked Questions (FAQ):

To speak to our analyst for a discussion on the above findings, click Speak to Analyst

Exclusive indicates content/data unique to MarketsandMarkets and not available with any competitors.

TABLE OF CONTENTS
 
1 INTRODUCTION (Page No. - 25)
    1.1 STUDY OBJECTIVES 
    1.2 DEFINITION 
    1.3 INCLUSIONS AND EXCLUSIONS 
           1.3.1 MOSFET RELAY MARKET, BY VOLTAGE TYPE
           1.3.2 MOSFET RELAY MARKET, BY APPLICATION
           1.3.3 MOSFET RELAY MARKET, BY REGION
    1.4 MARKET SCOPE 
           1.4.1 MARKET SEGMENTATION
           1.4.2 REGIONAL SCOPE
           1.4.3 YEARS CONSIDERED
    1.5 CURRENCY CONSIDERED 
    1.6 RESEARCH LIMITATIONS 
    1.7 STAKEHOLDERS 
 
2 RESEARCH METHODOLOGY (Page No. - 30)
    2.1 RESEARCH DATA 
           FIGURE 1 MOSFET RELAY MARKET: RESEARCH DESIGN
    2.2 DATA TRIANGULATION 
           FIGURE 2 DATA TRIANGULATION
           2.2.1 SECONDARY DATA
                    2.2.1.1 Key data from secondary sources
           2.2.2 PRIMARY DATA
                    2.2.2.1 Breakdown of primaries
                    2.2.2.2 Key data from primary sources
                               FIGURE 3 BREAKDOWN OF PRIMARY INTERVIEWS: BY COMPANY TYPE, DESIGNATION, AND REGION
                               FIGURE 4 MAIN METRICS CONSIDERED WHILE ANALYZING AND ASSESSING DEMAND FOR MOSFET RELAYS
    2.3 MARKET SIZE ESTIMATION 
           2.3.1 BOTTOM-UP APPROACH
                    FIGURE 5 MARKET SIZE ESTIMATION METHODOLOGY: BOTTOM-UP APPROACH
           2.3.2 TOP-DOWN APPROACH
                    FIGURE 6 MARKET SIZE ESTIMATION METHODOLOGY: TOP-DOWN APPROACH
           2.3.3 DEMAND-SIDE ANALYSIS
                    2.3.3.1 Regional analysis
                    2.3.3.2 Country analysis
                    2.3.3.3 Demand-side assumptions
                    2.3.3.4 Demand-side calculations
           2.3.4 SUPPLY-SIDE ANALYSIS
                    FIGURE 7 KEY STEPS CONSIDERED FOR ASSESSING SUPPLY OF MOSFET RELAYS
                    FIGURE 8 GLOBAL MARKET: SUPPLY-SIDE ANALYSIS
                    2.3.4.1 Supply-side calculations
                    2.3.4.2 Supply-side assumptions
           2.3.5 FORECAST
 
3 EXECUTIVE SUMMARY (Page No. - 41)
    TABLE 1 MARKET SNAPSHOT 
    FIGURE 9 RENEWABLES APPLICATION TO LEAD GLOBAL MARKET DURING FORECAST PERIOD 
    FIGURE 10 200 V–500 V SEGMENT TO LEAD THE GLOBAL MARKET, BY VOLTAGE RANGE, DURING FORECAST PERIOD 
    FIGURE 11 ASIA PACIFIC DOMINATED MARKET IN 2021 
 
4 PREMIUM INSIGHTS (Page No. - 44)
    4.1 ATTRACTIVE OPPORTUNITIES FOR MARKET PLAYERS 
           FIGURE 12 GROWING ADOPTION OF HIGH-TECH ELECTRONICS TO DRIVE MARKET BETWEEN 2022 AND 2030
    4.2 ASIA PACIFIC: MARKET, BY APPLICATION AND COUNTRY, 2021 
           FIGURE 13 INDUSTRIAL APPLICATION HELD LARGEST SHARE OF MARKET IN ASIA PACIFIC IN 2021
    4.3 MARKET, BY REGION 
           FIGURE 14 ASIA PACIFIC MARKET TO EXHIBIT HIGHEST CAGR DURING FORECAST PERIOD
    4.4 MARKET, BY APPLICATION 
           FIGURE 15 RENEWABLES TO ACCOUNT FOR LARGEST MARKET SHARE IN 2030
    4.5 MARKET, BY VOLTAGE RANGE 
           FIGURE 16 BELOW 200 V TO ACCOUNT FOR LARGEST MARKET SHARE IN 2030
 
5 MARKET OVERVIEW (Page No. - 48)
    5.1 INTRODUCTION 
    5.2 MARKET DYNAMICS 
           FIGURE 17 DRIVERS, RESTRAINTS, OPPORTUNITIES, AND CHALLENGES IN MARKET
           5.2.1 DRIVERS
                    5.2.1.1 Increasing complexity in circuits of electric vehicles
                    5.2.1.2 Increasing demand for instrumentation devices
                    5.2.1.3 Growing adoption of smart meters and automatic meter reading systems
                    5.2.1.4 Increase in overall revenue projection of semiconductor industry
           5.2.2 RESTRAINTS
                    5.2.2.1 Need for safe operating temperature to manage dissipating heat generated by MOSFET relay
                    5.2.2.2 Higher cost and requirement for greater initial investment than EMR
                    5.2.2.3 Current leakage during switching off MOSFET relays
           5.2.3 OPPORTUNITIES
                    5.2.3.1 Robust features and benefits of MOSFET relays
           5.2.4 CHALLENGES
                    5.2.4.1 Stringent quality standards
    5.3 TRENDS/DISRUPTIONS IMPACTING CUSTOMERS’ BUSINESSES 
           5.3.1 REVENUE SHIFT AND NEW REVENUE POCKETS FOR GLOBAL MARKET
                    FIGURE 18 REVENUE SHIFT FOR RELAY PROVIDERS
    5.4 MARKET MAP 
           FIGURE 19 MARKET MAP: GLOBAL MARKET
           TABLE 2 MARKET: ROLE IN ECOSYSTEM
    5.5 VALUE CHAIN ANALYSIS 
           FIGURE 20 VALUE CHAIN ANALYSIS: MARKET
           5.5.1 RAW MATERIAL PROVIDERS/SUPPLIERS
           5.5.2 COMPONENT MANUFACTURERS
           5.5.3 RELAY MANUFACTURERS/ASSEMBLERS
           5.5.4 DISTRIBUTORS
           5.5.5 END USERS
           5.5.6 POST-SALES SERVICES
    5.6 TECHNOLOGY ANALYSIS 
           5.6.1 HIGH-POWER MOSFET RELAY TECHNOLOGY
    5.7 PRICING ANALYSIS 
           5.7.1 AVERAGE SELLING PRICE OF MOSFET RELAY
                    TABLE 3 AVERAGE SELLING PRICE OF MOSFET RELAY, 2021
                    TABLE 4 AVERAGE SELLING PRICE OF MOSFET RELAY OFFERED BY KEY PLAYERS, 2021
    5.8 KEY CONFERENCES AND EVENTS, 2022–2024 
           TABLE 5 MARKET: DETAILED LIST OF CONFERENCES AND EVENTS
    5.9 TARIFFS, CODES, AND REGULATIONS 
           5.9.1 TARIFFS RELATED TO RELAY
                    TABLE 6 IMPORT TARIFFS FOR HS 853690 LOW-VOLTAGE PROTECTION EQUIPMENT IN 2019
                    TABLE 7 IMPORT TARIFFS FOR HS 8535 HIGH-VOLTAGE PROTECTION EQUIPMENT IN 2019
    5.10 TRADE ANALYSIS 
           5.10.1 TRADE ANALYSIS RELATED TO ELECTRICAL APPARATUS FOR SWITCHING OR PROTECTING ELECTRICAL CIRCUITS WITH VOLTAGE EXCEEDING 1,000 VOLTS
           5.10.2 IMPORT SCENARIO
                    TABLE 8 IMPORT SCENARIO FOR HS CODE: 8535, BY COUNTRY, 2019–2021 (USD)
           5.10.3 EXPORT SCENARIO
                    TABLE 9 EXPORT SCENARIO FOR HS CODE: 8535, BY COUNTRY, 2019–2021 (USD)
           5.10.4 TRADE ANALYSIS RELATED TO ELECTRICAL APPARATUS FOR SWITCHING OR PROTECTING ELECTRICAL CIRCUITS WITH VOLTAGE NOT EXCEEDING 1,000 VOLTS
           5.10.5 IMPORT SCENARIO
                    TABLE 10 IMPORT SCENARIO FOR HS CODE: 853690, BY COUNTRY, 2019–2021 (USD)
           5.10.6 EXPORT SCENARIO
                    TABLE 11 EXPORT SCENARIO FOR HS CODE: 853690, BY COUNTRY, 2019–2021 (USD)
           5.10.7 REGULATORY BODIES, GOVERNMENT AGENCIES, AND OTHER ORGANIZATIONS
                    TABLE 12 NORTH AMERICA: LIST OF REGULATORY BODIES, GOVERNMENT AGENCIES, AND OTHER ORGANIZATIONS
                    TABLE 13 EUROPE: LIST OF REGULATORY BODIES, GOVERNMENT AGENCIES, AND OTHER ORGANIZATIONS
                    TABLE 14 ASIA PACIFIC: LIST OF REGULATORY BODIES, GOVERNMENT AGENCIES, AND OTHER ORGANIZATIONS
                    TABLE 15 REST OF WORLD: LIST OF REGULATORY BODIES, GOVERNMENT AGENCIES, AND OTHER ORGANIZATIONS
           5.10.8 CODES AND REGULATIONS RELATED TO MOSFET RELAYS
                    TABLE 16 MOSFET RELAY: CODES AND REGULATIONS
    5.11 PATENT ANALYSIS 
                    TABLE 17 MOSFET RELAY: INNOVATIONS AND PATENT REGISTRATIONS, JANUARY 2021–MAY 2022
    5.12 PORTER’S FIVE FORCES ANALYSIS 
                    FIGURE 21 PORTER’S FIVE FORCES ANALYSIS FOR MARKET
                    TABLE 18 MARKET: PORTER’S FIVE FORCES ANALYSIS
           5.12.1 THREAT OF SUBSTITUTES
           5.12.2 BARGAINING POWER OF SUPPLIERS
           5.12.3 BARGAINING POWER OF BUYERS
           5.12.4 THREAT OF NEW ENTRANTS
           5.12.5 INTENSITY OF COMPETITIVE RIVALRY
    5.13 KEY STAKEHOLDERS AND BUYING CRITERIA 
           5.13.1 KEY STAKEHOLDERS IN BUYING PROCESS
                    FIGURE 22 INFLUENCE OF KEY STAKEHOLDERS ON BUYING PROCESS FOR TOP 3 APPLICATIONS
                    TABLE 19 INFLUENCE OF KEY STAKEHOLDERS ON BUYING PROCESS FOR TOP 3 APPLICATIONS
    5.14 BUYING CRITERIA 
                    FIGURE 23 INFLUENCE OF KEY STAKEHOLDERS ON BUYING PROCESS FOR TOP 3 APPLICATIONS
                    TABLE 20 KEY BUYING CRITERIA FOR TOP 3 APPLICATIONS
    5.15 CASE STUDY ANALYSIS 
           5.15.1 LITTELFUSE ARC-FLASH RELAY SAVES PLANT FROM CATASTROPHIC DAMAGE
                    5.15.1.1 Problem statement
                    5.15.1.2 Solution
 
6 MARKET, BY APPLICATION (Page No. - 80)
    6.1 INTRODUCTION 
           FIGURE 24 MARKET, BY APPLICATION, 2021
           TABLE 21 MARKET, BY APPLICATION, 2020–2030 (USD MILLION)
    6.2 INDUSTRIAL 
           6.2.1 USE OF SEMICONDUCTOR MATERIAL TO BOOST DEMAND
                    TABLE 22 INDUSTRIAL: MARKET, BY REGION, 2020–2030 (USD MILLION)
    6.3 HOUSEHOLD APPLIANCES 
           6.3.1 RISE IN DEMAND FOR TECHNOLOGICALLY ADVANCED AND MODERN KITCHEN APPLIANCES TO INCREASE DEMAND
                    TABLE 23 HOUSEHOLD APPLIANCES: MARKET, BY REGION, 2020–2030 (USD MILLION)
    6.4 TEST & MEASUREMENT 
           6.4.1 ABILITY TO MEASURE VARIETY OF SIGNALS AT HIGH SPEEDS UNDER VARIOUS CONDITIONS TO DRIVE DEMAND
                    TABLE 24 TEST & MEASUREMENT: MARKET, BY REGION, 2020–2030 (USD MILLION)
    6.5 MINING 
           6.5.1 INCREASE IN DIGITALIZATION OF MINING OPERATIONS AND MACHINERY TO BOOST DEMAND
                    TABLE 25 MINING: MARKET, BY REGION, 2020–2030 (USD MILLION)
    6.6 AUTOMOTIVE 
           6.6.1 RISE IN DEMAND FOR MIDSIZED AND PREMIUM PASSENGER CARS TO DRIVE DEMAND
           6.6.2 EVS
                    6.6.2.1 Battery management system
                    6.6.2.2 Charging stations
           6.6.3 CONVENTIONAL
                    TABLE 26 AUTOMOTIVE: MARKET, BY REGION, 2020–2030 (USD MILLION)
    6.7 MEDICAL 
           6.7.1 ABILITY OF MOSFET RELAYS TO TRANSFER LOW-LEVEL SIGNALS AND AUTOMATICALLY SWITCH VOLTAGE RANGES TO DRIVE DEMAND
                    TABLE 27 MEDICAL: MARKET, BY REGION, 2020–2030 (USD MILLION)
    6.8 RENEWABLES 
           6.8.1 SHIFT TOWARD RENEWABLE ENERGY SOURCES TO BOOST DEMAND
           6.8.2 SOLAR
           6.8.3 WIND
                    TABLE 28 RENEWABLES: MARKET, BY REGION, 2020–2030 (USD MILLION)
    6.9 CHARGING STATIONS 
           6.9.1 NEED FOR CHARGING STATIONS TO CATER TO GROWING EV MARKET TO BOOST DEMAND
                    TABLE 29 CHARGING STATIONS: MARKET, BY REGION, 2020–2030 (USD MILLION)
    6.10 OTHERS 
           TABLE 30 OTHERS: MARKET, BY REGION, 2020–2030 (USD MILLION)
 
7 MARKET, BY VOLTAGE RANGE (Page No. - 88)
    7.1 INTRODUCTION 
           FIGURE 25 MARKET, BY VOLTAGE RANGE, 2021
           TABLE 31 MARKET, BY VOLTAGE RANGE, 2020–2030 (USD MILLION)
    7.2 BELOW 200 V 
           7.2.1 INSTRUMENTATION AND SIGNAL/ALARM CONTACTS TO DRIVE MARKET
    7.3 200 V–500 V 
           7.3.1 HIGH-SPEED INSPECTION MACHINES AND TELEPHONE EQUIPMENT TO DRIVE MARKET
    7.4 500 V–1 KV 
           7.4.1 HIGH VIBRATION AND SHOCK RESISTANCE FEATURES TO BOOST MARKET
    7.5 ABOVE 1 KV 
           7.5.1 HIGH-RELIABILITY APPLICATIONS TO DRIVE SEGMENT
 
8 MARKET, BY REGION (Page No. - 91)
    8.1 INTRODUCTION 
           FIGURE 26 ASIA PACIFIC MARKET TO GROW AT HIGHEST CAGR DURING FORECAST PERIOD
           FIGURE 27 MARKET SHARE, BY REGION, 2021
           TABLE 32 MARKET, BY REGION, 2020–2030 (USD MILLION)
    8.2 ASIA PACIFIC 
           FIGURE 28 ASIA PACIFIC: MARKET SNAPSHOT
           8.2.1 BY APPLICATION
                    TABLE 33 ASIA PACIFIC: MARKET, BY APPLICATION, 2020–2030 (USD MILLION)
                    TABLE 34 ASIA PACIFIC: MARKET, BY AUTOMOTIVE APPLICATION, 2020–2030 (USD MILLION)
                    TABLE 35 ASIA PACIFIC: MARKET, BY RENEWABLES APPLICATION, 2020–2030 (USD MILLION)
           8.2.2 BY COUNTRY
                    TABLE 36 ASIA PACIFIC: MARKET, BY COUNTRY, 2020–2030 (USD MILLION)
                    8.2.2.1 CHINA
                               8.2.2.1.1 Growth of automotive sector to propel market
                               TABLE 37 CHINA: MARKET, BY APPLICATION, 2020–2030 (USD MILLION)
                               TABLE 38 CHINA: MARKET, BY AUTOMOTIVE APPLICATION, 2020–2030 (USD MILLION)
                               TABLE 39 CHINA: MARKET, BY RENEWABLES APPLICATION, 2020–2030 (USD MILLION)
                    8.2.2.2 India
                               8.2.2.2.1 Increase in adoption of EVs to propel market
                               TABLE 40 INDIA: MARKET, BY APPLICATION, 2020–2030 (USD MILLION)
                               TABLE 41 INDIA: MARKET, BY AUTOMOTIVE APPLICATION, 2020–2030 (USD MILLION)
                               TABLE 42 INDIA: MARKET, BY RENEWABLES APPLICATION, 2020–2030 (USD MILLION)
                    8.2.2.3 Japan
                               8.2.2.3.1 Government initiatives to boost renewable energy generation to drive market
                               TABLE 43 JAPAN: MARKET, BY APPLICATION, 2020–2030 (USD MILLION)
                               TABLE 44 JAPAN: MARKET, BY AUTOMOTIVE APPLICATION, 2020–2030 (USD MILLION)
                               TABLE 45 JAPAN: MARKET, BY RENEWABLES APPLICATION, 2020–2030 (USD MILLION)
                    8.2.2.4 Rest of Asia Pacific
                               TABLE 46 REST OF ASIA PACIFIC: MARKET, BY APPLICATION, 2020–2030 (USD MILLION)
                               TABLE 47 REST OF ASIA PACIFIC: MARKET, BY AUTOMOTIVE APPLICATION, 2020–2030 (USD MILLION)
                               TABLE 48 REST OF ASIA PACIFIC: MARKET, BY RENEWABLES APPLICATION, 2020–2030 (USD MILLION)
    8.3 EUROPE 
           FIGURE 29 EUROPE: MARKET SNAPSHOT
           8.3.1 BY APPLICATION
                    TABLE 49 EUROPE: MARKET, BY APPLICATION, 2020–2030 (USD MILLION)
                    TABLE 50 EUROPE: MARKET, BY AUTOMOTIVE APPLICATION, 2020–2030 (USD MILLION)
                    TABLE 51 EUROPE: MARKET, BY RENEWABLES APPLICATION, 2020–2030 (USD MILLION)
           8.3.2 BY COUNTRY
                    TABLE 52 EUROPE: MARKET, BY COUNTRY, 2020–2030 (USD MILLION)
                    8.3.2.1 UK
                               8.3.2.1.1 Growing industrial automation to propel market for MOSFET relays
                               TABLE 53 UK: MARKET, BY APPLICATION, 2020–2030 (USD MILLION)
                               TABLE 54 UK: MARKET, BY AUTOMOTIVE APPLICATION, 2020–2030 (USD MILLION)
                               TABLE 55 UK: MARKET, BY RENEWABLES APPLICATION, 2020–2030 (USD MILLION)
                    8.3.2.2 Germany
                               8.3.2.2.1 Increasing application in automotive industry to propel market
                               TABLE 56 GERMANY: MARKET, BY APPLICATION, 2020–2030 (USD MILLION)
                               TABLE 57 GERMANY: MARKET, BY AUTOMOTIVE APPLICATION, 2020–2030 (USD MILLION)
                               TABLE 58 GERMANY: MARKET, BY RENEWABLES APPLICATION, 2020–2030 (USD MILLION)
                    8.3.2.3 Poland
                               8.3.2.3.1 Industrial automation and manufacturing sector to drive market growth
                               TABLE 59 POLAND: MARKET, BY APPLICATION, 2020–2030 (USD MILLION)
                               TABLE 60 POLAND: MARKET, BY AUTOMOTIVE APPLICATION, 2020–2030 (USD MILLION)
                               TABLE 61 POLAND: MARKET, BY RENEWABLES APPLICATION, 2020–2030 (USD MILLION)
                    8.3.2.4 France
                               8.3.2.4.1 Government initiatives to increase renewable energy capacity to create demand for MOSFET relays
                               TABLE 62 FRANCE: MARKET, BY APPLICATION, 2020–2030 (USD MILLION)
                               TABLE 63 FRANCE: MARKET, BY AUTOMOTIVE APPLICATION, 2020–2030 (USD MILLION)
                               TABLE 64 FRANCE: MARKET, BY RENEWABLES APPLICATION, 2020–2030 (USD MILLION)
                    8.3.2.5 Italy
                               8.3.2.5.1 Rising investments in automotive sector to drive market
                               TABLE 65 ITALY: MARKET, BY APPLICATION, 2020–2030 (USD MILLION)
                               TABLE 66 ITALY: MARKET, BY AUTOMOTIVE APPLICATION, 2020–2030 (USD MILLION)
                               TABLE 67 ITALY: MARKET, BY RENEWABLES APPLICATION, 2020–2030 (USD MILLION)
                    8.3.2.6 Rest of Europe
                               TABLE 68 REST OF EUROPE: MARKET, BY APPLICATION, 2020–2030 (USD MILLION)
                               TABLE 69 REST OF EUROPE: MARKET, BY AUTOMOTIVE APPLICATION, 2020–2030 (USD MILLION)
                               TABLE 70 REST OF EUROPE: MARKET, BY RENEWABLES APPLICATION, 2020–2030 (USD MILLION)
    8.4 NORTH AMERICA 
           8.4.1 BY APPLICATION
                    TABLE 71 NORTH AMERICA: MARKET, BY APPLICATION, 2020–2030 (USD MILLION)
                    TABLE 72 NORTH AMERICA: MARKET, BY AUTOMOTIVE APPLICATION, 2020–2030 (USD MILLION)
                    TABLE 73 NORTH AMERICA: MARKET, BY RENEWABLES APPLICATION, 2020–2030 (USD MILLION)
           8.4.2 BY COUNTRY
                    TABLE 74 NORTH AMERICA: MARKET, BY COUNTRY, 2020–2030 (USD MILLION)
                    8.4.2.1 US
                               8.4.2.1.1 Growing demand for industrial automation to drive market
                               TABLE 75 US: MARKET, BY APPLICATION, 2020–2030 (USD MILLION)
                               TABLE 76 US: MARKET, BY AUTOMOTIVE APPLICATION, 2020–2030 (USD MILLION)
                               TABLE 77 US: MARKET, BY RENEWABLES APPLICATION, 2020–2030 (USD MILLION)
                    8.4.2.2 Canada
                               8.4.2.2.1 Expanding automotive industry to aid market growth
                               TABLE 78 CANADA: MARKET, BY APPLICATION, 2020–2030 (USD MILLION)
                               TABLE 79 CANADA: MOSFET RELAY MARKET, BY AUTOMOTIVE APPLICATION, 2020–2030 (USD MILLION)
                               TABLE 80 CANADA: MOSFET RELAY MARKET, BY RENEWABLES APPLICATION, 2020–2030 (USD MILLION)
                    8.4.2.3 Mexico
                               8.4.2.3.1 Growing industrial sector, including manufacturing and mining, to fuel demand
                               TABLE 81 MEXICO: MOSFET RELAY MARKET, BY APPLICATION, 2020–2030 (USD MILLION)
                               TABLE 82 MEXICO: MOSFET RELAY MARKET, BY AUTOMOTIVE APPLICATION, 2020–2030 (USD MILLION)
                               TABLE 83 MEXICO: MOSFET RELAY MARKET, BY RENEWABLES APPLICATION, 2020–2030 (USD MILLION)
    8.5 REST OF THE WORLD 
           8.5.1 BY APPLICATION
                    TABLE 84 REST OF THE WORLD: MOSFET RELAY MARKET, BY APPLICATION, 2020–2030 (USD MILLION)
                    TABLE 85 REST OF THE WORLD: MOSFET RELAY MARKET, BY AUTOMOTIVE APPLICATION, 2020–2030 (USD MILLION)
                    TABLE 86 REST OF THE WORLD: MOSFET RELAY MARKET, BY RENEWABLES APPLICATION, 2020–2030 (USD MILLION)
 
9 COMPETITIVE LANDSCAPE (Page No. - 123)
    9.1 OVERVIEW 
    9.2 KEY PLAYER STRATEGIES 
           TABLE 87 OVERVIEW OF KEY STRATEGIES DEPLOYED BY TOP PLAYERS, APRIL 2019–APRIL 2022
    9.3 MARKET SHARE ANALYSIS OF TOP FIVE PLAYERS 
           TABLE 88 MOSFET RELAY MARKET: DEGREE OF COMPETITION
           FIGURE 30 MOSFET RELAY MARKET SHARE ANALYSIS, 2021
    9.4 REVENUE ANALYSIS OF TOP FIVE PLAYERS 
           FIGURE 31 TOP PLAYERS IN MOSFET RELAY MARKET, 2017–2021
    9.5 COMPANY EVALUATION QUADRANT 
           9.5.1 STARS
           9.5.2 PERVASIVE PLAYERS
           9.5.3 EMERGING LEADERS
           9.5.4 PARTICIPANTS
                    FIGURE 32 COMPETITIVE LEADERSHIP MAPPING: MOSFET RELAY MARKET, 2021
           9.5.5 COMPETITIVE BENCHMARKING
                    TABLE 89 MOSFET RELAY MARKET: DETAILED LIST OF KEY START-UPS/SMES
                    TABLE 90 MOSFET RELAY MARKET: DETAILED COMPETITIVE BENCHMARKING OF KEY PLAYERS (START-UPS/SMES)
    9.6 MOSFET RELAY MARKET: COMPANY FOOTPRINT 
           TABLE 91 COMPANY FOOTPRINT: BY APPLICATION
           TABLE 92 COMPANY FOOTPRINT: BY VOLTAGE
           TABLE 93 COMPANY FOOTPRINT: BY REGION
           TABLE 94 OVERALL COMPANY FOOTPRINT
    9.7 COMPETITIVE SCENARIO 
           TABLE 95 MOSFET RELAY MARKET: PRODUCT LAUNCHES, MAY 2018–APRIL 2022
           TABLE 96 MOSFET RELAY MARKET: DEALS, JULY 2020–JUNE 2022
           TABLE 97 MOSFET RELAY MARKET: OTHER DEVELOPMENTS, AUGUST 2020–JUNE 2022
 
10 COMPANY PROFILES (Page No. - 138)
(Business overview, Products/Solutions/Services offered, Recent Developments, MNM view)*
     10.1 KEY PLAYERS 
             10.1.1 SCHNEIDER ELECTRIC
                       TABLE 98 SCHNEIDER ELECTRIC: COMPANY OVERVIEW
                       FIGURE 33 SCHNEIDER ELECTRIC: COMPANY SNAPSHOT (2021)
                       TABLE 99 SCHNEIDER ELECTRIC: PRODUCTS/SOLUTIONS/SERVICES OFFERED
                       TABLE 100 SCHNEIDER ELECTRIC: OTHERS
             10.1.2 STANDEX ELECTRONICS
                       TABLE 101 STANDEX INTERNATIONAL CORPORATION: COMPANY OVERVIEW
                       FIGURE 34 STANDEX ELECTRONICS, INC.: COMPANY SNAPSHOT (2021)
                       TABLE 102 STANDEX ELECTRONICS: PRODUCTS/SOLUTIONS/SERVICES OFFERED
                       TABLE 103 STANDEX ELECTRONICS: DEALS
             10.1.3 TE CONNECTIVITY
                       TABLE 104 TE CONNECTIVITY: COMPANY OVERVIEW
                       FIGURE 35 TE CONNECTIVITY: COMPANY SNAPSHOT (2021)
                       TABLE 105 TE CONNECTIVITY: PRODUCTS/SOLUTIONS/SERVICES OFFERED
                       TABLE 106 TE CONNECTIVITY: DEALS
                       TABLE 107 TE CONNECTIVITY: OTHERS
             10.1.4 PANASONIC CORPORATION
                       TABLE 108 PANASONIC CORPORATION: COMPANY OVERVIEW
                       FIGURE 36 PANASONIC CORPORATION: COMPANY SNAPSHOT (2021)
                       TABLE 109 PANASONIC CORPORATION: PRODUCTS/SOLUTIONS/SERVICES OFFERED
                       TABLE 110 PANASONIC CORPORATION: PRODUCT LAUNCHES
             10.1.5 OMRON CORPORATION
                       TABLE 111 OMRON CORPORATION: COMPANY OVERVIEW
                       FIGURE 37 OMRON CORPORATION: COMPANY SNAPSHOT (2021)
                       TABLE 112 OMRON CORPORATION: PRODUCTS/SOLUTIONS/SERVICES OFFERED
                       TABLE 113 OMRON CORPORATION: PRODUCT LAUNCHES
             10.1.6 VISHAY INTERTECHNOLOGY, INC.
                       TABLE 114 VISHAY INTERTECHNOLOGY, INC.: COMPANY OVERVIEW
                       FIGURE 38 VISHAY INTERTECHNOLOGY, INC.: COMPANY SNAPSHOT (2021)
                       TABLE 115 VISHAY INTERTECHNOLOGY, INC.: PRODUCTS/SOLUTIONS/SERVICES OFFERED
             10.1.7 LITTELFUSE, INC.
                       TABLE 116 LITTELFUSE, INC.: COMPANY OVERVIEW
                       FIGURE 39 LITTELFUSE, INC.: COMPANY SNAPSHOT (2021)
                       TABLE 117 LITTELFUSE, INC.: PRODUCTS/SOLUTIONS/SERVICES OFFERED
                       TABLE 118 LITTELFUSE, INC.: DEALS
                       TABLE 119 LITTELFUSE, INC.: OTHERS
             10.1.8 BROADCOM
                       TABLE 120 BROADCOM: COMPANY OVERVIEW
                       FIGURE 40 BROADCOM: COMPANY SNAPSHOT (2021)
                       TABLE 121 BROADCOM: PRODUCTS/SOLUTIONS/SERVICES OFFERED
             10.1.9 TOSHIBA CORPORATION
                       TABLE 122 TOSHIBA CORPORATION: COMPANY OVERVIEW
                       FIGURE 41 TOSHIBA CORPORATION: COMPANY SNAPSHOT (2021)
                       TABLE 123 TOSHIBA CORPORATION: PRODUCTS/SOLUTIONS/SERVICES OFFERED
                       TABLE 124 TOSHIBA CORPORATION: PRODUCT LAUNCHES
             10.1.10 SENSATA TECHNOLOGIES
                       TABLE 125 SENSATA TECHNOLOGIES: COMPANY OVERVIEW
                       FIGURE 42 SENSATA TECHNOLOGIES: COMPANY SNAPSHOT (2021)
                       TABLE 126 SENSATA TECHNOLOGIES: PRODUCTS/SOLUTIONS/SERVICES OFFERED
                       TABLE 127 SENSATA TECHNOLOGY: DEALS
             10.1.11 CARLO GAVAZZI
                       TABLE 128 CARLO GAVAZZI: COMPANY OVERVIEW
                       TABLE 129 CARLO GAVAZZI: PRODUCTS/SOLUTIONS/SERVICES OFFERED
             10.1.12 CELDUC
                       TABLE 130 CELDUC: COMPANY OVERVIEW
                       TABLE 131 CELDUC: PRODUCTS/SOLUTIONS/SERVICES OFFERED
                       TABLE 132 CELDUC: OTHERS
             10.1.13 BRIGHT TOWARD INDUSTRIAL CO., LTD.
                       TABLE 133 BRIGHT TOWARD INDUSTRIAL CO., LTD.: COMPANY OVERVIEW
                       TABLE 134 BRIGHT TOWARD INDUSTRIAL CO., LTD.: PRODUCTS/SOLUTIONS/SERVICES OFFERED
             10.1.14 WAGO
                       TABLE 135 WAGO: COMPANY OVERVIEW
                       TABLE 136 WAGO: PRODUCTS/SOLUTIONS/SERVICES OFFERED
             10.1.15 TELEDYNE DEFENSE ELECTRONICS
                       TABLE 137 TELEDYNE DEFENSE ELECTRONICS: COMPANY OVERVIEW
                       TABLE 138 TELEDYNE DEFENSE ELECTRONICS: PRODUCTS/SOLUTIONS/SERVICES OFFERED
             10.1.16 RELPOL S.A.
                       TABLE 139 RELPOL S.A.: COMPANY OVERVIEW
                       TABLE 140 RELPOL S.A.: PRODUCTS/SOLUTIONS/SERVICES OFFERED
             10.1.17 CHORDN ELECTRIC
                       TABLE 141 CHORDN ELECTRIC: COMPANY OVERVIEW
                       TABLE 142 CHORDN ELECTRIC: PRODUCTS/SOLUTIONS/SERVICES OFFERED
*Details on Business overview, Products/Solutions/Services offered, Recent Developments, MNM view might not be captured in case of unlisted companies.
 
11 APPENDIX (Page No. - 188)
     11.1 INSIGHTS OF INDUSTRY EXPERTS 
     11.2 DISCUSSION GUIDE 
     11.3 KNOWLEDGESTORE: MARKETSANDMARKETS’ SUBSCRIPTION PORTAL 
     11.4 CUSTOMIZATION OPTIONS 
     11.5 RELATED REPORTS 
     11.6 AUTHOR DETAILS 

This study involved major activities in estimating the current size of the MOSFET relay market. Comprehensive secondary research was done to collect information on the market, peer market, and parent market. The next step involved was the validation of these findings, assumptions, and market sizing with industry experts across the value chain through primary research. The total market size was estimated through country-wise analysis. Then, the market breakdown and data triangulation were performed to estimate the market size of the segments and sub-segments.

Secondary Research

The secondary research involved the use of extensive secondary sources, directories, and databases, such as Hoover’s, Bloomberg BusinessWeek, Factiva, and OneSource, to identify and collect information useful for a technical, market-oriented, and commercial study of the MOSFET relay market. The other secondary sources comprised press releases & investor presentations of companies, white papers, certified publications, articles by recognized authors, manufacturers, associations, trade directories, and databases.

Primary Research

The MOSFET relay market comprises several stakeholders, such as product manufacturers, service providers, distributors, and end-users in the supply chain. The demand-side of this market is characterized by industrial end-users. Moreover, the demand is also fueled by the growing demand of automotive and renewables sector. The supply side is characterized by rising demand for contracts from the industrial sector, and mergers & acquisitions among big players. Various primary sources from both the supply and demand sides of the market were interviewed to obtain qualitative and quantitative information. Primary data has been collected through questionnaires, emails, and telephonic interviews. In the canvassing of primaries, various departments within organizations, such as sales, operations, and administration, were covered to provide a holistic viewpoint in our report.

After interacting with industry experts, brief sessions were conducted with highly experienced independent consultants to reinforce the findings from our primaries. This, along with the in-house subject matter experts’ opinions, has led us to the findings as described in the remainder of this report

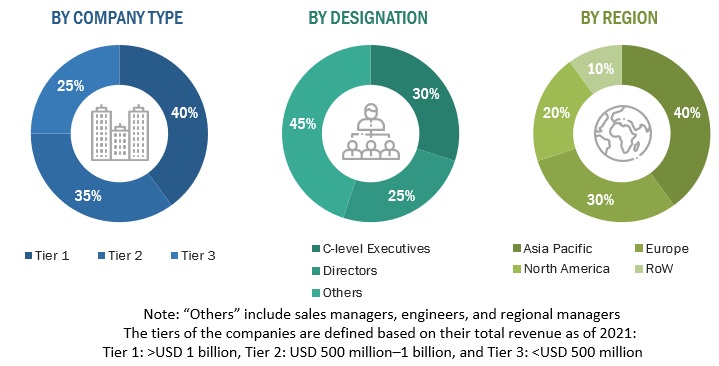
The breakdown of primary respondents is given below:
MOSFET Relay Market Size, and Share

To know about the assumptions considered for the study, download the pdf brochure

Market Size Estimation

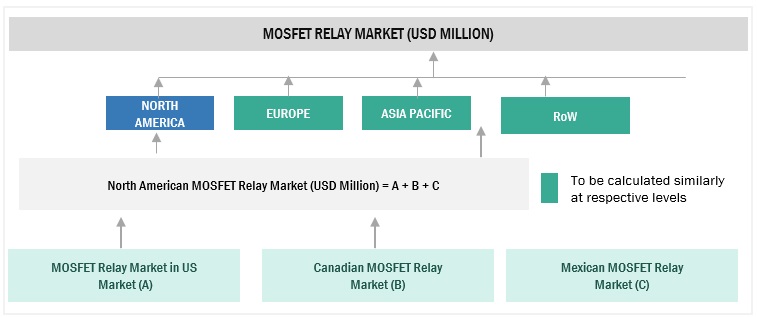
The bottom-up approach has been used to estimate and validate the size of the MOSFET relay market.

  • In this approach, the MOSFET relay production statistics for each product type have been considered at a geographical level.
  • Extensive secondary and primary research has been carried out to understand the global market scenario for various types of MOSFET relays.
  • Several primary interviews have been conducted with key opinion leaders related to MOSFET relay system development, including key OEMs and Tier I suppliers.
  • Qualitative aspects such as market drivers, restraints, opportunities, and challenges have been taken into consideration while calculating and forecasting the market size.

MOSFET relay Market Size: Bottom-Up Approach
MOSFET Relay Market Size, and Share

To know about the assumptions considered for the study, Request for Free Sample Report

Data Triangulation

The overall market size is estimated using the market size estimation processes as explained above, followed by splitting of the market into several segments and subsegments. To complete the overall market engineering process and arrive at the exact statistics of each market segment and subsegment, data triangulation, and market breakdown procedures were employed, wherever applicable. The data was triangulated by studying various factors and trends from both the demand and supply sides in the MOSFET relay market ecosystem.

Report Objectives

  • To define, describe, and forecast the size of the MOSFET relay market by voltage, by application, and geography, in terms of value
  • To estimate and forecast the MOSFET relay market for various segments with respect to 4 main geograpies, namely, North America, Europe, Asia Pacific, Rest of the World (RoW), in terms of value
  • To provide comprehensive information about the drivers, restraints, opportunities, and industry-specific challenges that affect the market growth
  • To provide a detailed overview of the MOSFET relay value chain, along with industry trends, use cases, security standards, and Porter’s five forces
  • To strategically analyze micromarkets with respect to individual growth trends, prospects, and contribution to the total market
  • To analyze the opportunities in the market for stakeholders by identifying high-growth segments and detail the competitive landscape for market players
  • To strategically profile key players and comprehensively analyze their market rankings and core competencies
  • To analyze competitive developments, such as joint ventures, mergers and acquisitions, contracts, and agreements, and new product launches, in the MOSFET relay market
  • To benchmark players within the market using the proprietary competitive leadership mapping framework, which analyzes market players on various parameters within the broad categories of business strategy excellence and strength of product portfolio
  • This report covers the MOSFET relay market size in terms of value.

Available Customization

With the given market data, MarketsandMarkets offers customizations based on the company’s specific needs. The following customization options are available for the report:

Custom Market Research Services

We will customize the research for you, in case the report listed above does not meet with your exact requirements. Our custom research will comprehensively cover the business information you require to help you arrive at strategic and profitable business decisions.

Request Customization

Instant Answers with GPT - Ask Now!

Ask real questions. Get complete answers !
Report Code
EP 8530
Published ON
Jan, 2023
Choose License Type
BUY NOW
  • SHARE
X
Request Customization
Speak to Analyst
Speak to Analyst
OR FACE-TO-FACE MEETING
PERSONALIZE THIS RESEARCH
  • Triangulate with your Own Data
  • Get Data as per your Format and Definition
  • Gain a Deeper Dive on a Specific Application, Geography, Customer or Competitor
  • Any level of Personalization
REQUEST A FREE CUSTOMIZATION
LET US HELP YOU!
  • What are the Known and Unknown Adjacencies Impacting the MOSFET Relay Market
  • What will your New Revenue Sources be?
  • Who will be your Top Customer; what will make them switch?
  • Defend your Market Share or Win Competitors
  • Get a Scorecard for Target Partners
CUSTOMIZED WORKSHOP REQUEST
knowledgestore logo

Want to explore hidden markets that can drive new revenue in MOSFET Relay Market?

Find Hidden Markets
  • Call Us
  • +1-888-600-6441 (Corporate office hours)
  • +1-888-600-6441 (US/Can toll free)
  • +44-800-368-9399 (UK office hours)
CONNECT WITH US
ABOUT TRUST ONLINE
©2024 MarketsandMarkets Research Private Ltd. All rights reserved
DMCA.com Protection Status
Website Feedback