Mobile Power Plant Market by Fuel Type (Natural Gas/LPG, Diesel), Power Rating (1-10 MW, 11-20 MW, 21-50 MW), Application (Oil & Gas, Emergency Power, Remote Area Electrification), and Region - Global Forecast to 2022


[121 Pages Report] The mobile power plant market was valued at USD 1.27 Billion in 2016 and is estimated to grow at a CAGR of 4.56% from 2017 to 2022, to reach a market size of USD 1.73 Billion by 2022.
The years considered for the study are as follows:
- Base Year: 2016
- Estimated Year: 2017
- Projected Year: 2022
- Forecast Period: 2017 to 2022
The base year considered for company profiles is 2016. Whenever information was unavailable for the base year, the prior year has been considered.
Objectives of the Study
- To define, describe, and forecast the market, in terms of value, on the basis of power rating, fuel type, application, and region
- To provide detailed information regarding the major factors influencing the market growth (drivers, restraints, opportunities, and challenges)
- To estimate and forecast the size of the market, in terms of value, with respect to 5 main regions, namely, the Middle East & Africa, Asia Pacific (APAC), North America, Europe, and South America
- To study the individual growth trends and future prospects of mobile power plant providers and analyze the key contributors in this market
- To strategically analyze micro-markets with respect to individual growth trends, future prospects, and contribution to the total market
- To track and analyze competitive developments such as contracts & agreements, mergers & acquisitions, and new product launches in the market
- To profile key market players and comprehensively analyze their market positions and core competencies
Research Methodology
This research study involved the use of extensive secondary sources, directories, and databases, such as Hoover�s, Bloomberg Businessweek, Factiva, and OneSource, to identify and collect information useful for a technical, market-oriented, and commercial study of the market. Primary sources include industry experts from the core and related industries, preferred suppliers, manufacturers, distributors, service providers, technology developers, standards and certification organizations of companies, and organizations related to all the segments of this industry�s value chain. The research methodology has been explained below.
- Study of annual revenues and market developments of major players that offer mobile power plant products and solutions
- Assessment of future trends in the market
- Assessment of the market with respect to the type of fuel used in mobile power plant
- Study of market trends in various regions or countries supported by the application of mobile power plant
- Study of contracts and developments related to the market by key players across different regions
Finalization of the overall market sizes by triangulating the supply-side data, which includes product developments, supply chain, and annual revenues of companies manufacturing mobile power plant across the globe
To know about the assumptions considered for the study, download the pdf brochure
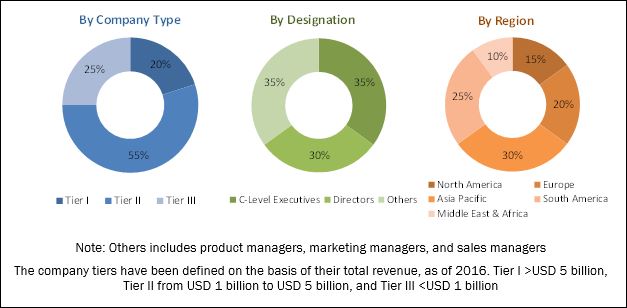
After arriving at the overall market size, the total market has been split into segments and sub-segments. The figure given above illustrates the breakdown of primaries conducted during the research study on the basis of company type, designation, and region.
The market ecosystem comprises service providers such as GE (US), Siemens (Germany), APR Energy (US), Kawasaki Heavy Industries (Japan), PW Power Systems (US), Metka (Greece), Solar Turbines (US), Turbine Technology Services (US), Vericor (US), Mapna (Iran), Meidensha (Japan), and Ethos Energy (UK).
Target Audience:
The report�s target audience includes:
- Mobile power plant manufacturers and suppliers
- Mobile power plant system providers
- Mobile power plant research institutes
- Government and research organizations
- Institutional researchers and professors
- National and local government organizations
- Research organizations and consulting companies
- Technology providers
Scope of the Report:
The market has been segmented as follows.
By Fuel Type:
- Natural Gas/LPG
- Diesel
- Others (HFO, Biofuels etc.)
By Power Rating:
- 1-10 MW
- 11-20 MW
- 21-50 MW
By Application:
- Oil & Gas Rigs
- Emergency power for natural disaster
- Remote area electrification
- Others
By Region:
- North America
- Asia Pacific
- Europe
- South America
- Middle East and Africa
Available Customizations:
With the given market data, MarketsandMarkets offers customizations as per the client�s specific needs. The following customization options are available for this report:
Regional Analysis
Further breakdown of region-/country-specific analyses
Company Information
Detailed analyses and profiling of additional market players (up to five)
The global mobile power plant market is estimated to grow at a CAGR of 4.56% from 2017 to 2022, to reach a projected market size of USD 1.73 Billion by 2022. The market growth would be driven by the increasing investments in remote area electrification and power requirement after frequent natural disasters.
The report segments the market by fuel type into natural gas/LPG, diesel, and others. The natural gas/LPG segment is estimated to hold the largest share of the market in 2017. Natural gas is clean, efficient, and affordable as compared to other fuels. These advantages of natural gas would drive the market for natural gas based mobile power plant.
The mobile power plant market, by power rating, is segmented into 1-10 MW, 11-20 MW, 21-50 MW. The 21-50 MW market has the largest market share in 2017 and is estimated to grow at the highest rate during the forecast period.
The report further segments the market by application into oil & gas rigs, emergency power, remote area electrification, and others. Emergency power is estimated to be the largest segment of the market, by value. Frequent natural disasters in countries such as Japan, China, US, and India are expected to drive the emergency power market during the forecast period.
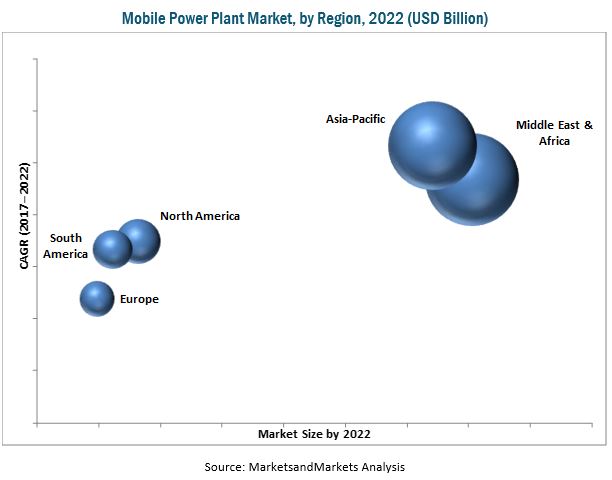
The Middle East & Africa region is projected to be the largest market for mobile power plant. The market growth in this region can be attributed to increasing investments in remote area electrification in the Sub-Saharan African region and development of oil & gas sector in the region. Asia Pacific is estimated to be the fastest growing market during the forecast period. Increasing investments in coastal area electrification in Southeast Asia and increasing number of natural disasters in India, Japan, and China would boost the market of mobile power plant in the future.
The growth of the mobile power plant market is hampered by varied regional terrains, which hinder transportation of mobile power plant and availability of fuel to nearby areas where mobile power plants are installed.
The key players in this market include GE (US), Siemens (Germany), APR Energy (US), Kawasaki Heavy Industries (Japan), PW Power Systems (US), Metka (Greece), Solar Turbines (US), Turbine Technology Services (US), Vericor (US), Mapna (Iran), Meidensha (Japan), and Ethos Energy (UK). These companies together hold a major share of the global market.
To speak to our analyst for a discussion on the above findings, click Speak to Analyst
 Exclusive indicates content/data unique to MarketsandMarkets and not available with any competitors.
Table of Contents
1 Introduction (Page No. - 13)
1.1 Objectives of the Study
1.2 Market Definition
1.3 Market Scope
1.3.1 Markets Covered
1.3.2 Regional Scope
1.3.3 Years Considered for the Study
1.4 Currency
1.5 Stakeholders
2 Research Methodology (Page No. - 16)
2.1 Research Data
2.1.1 Secondary Data
2.1.1.1 Key Data From Secondary Sources
2.1.2 Primary Data
2.1.2.1 Key Data From Primary Sources
2.1.2.2 Key Industry Insights
2.1.2.3 Breakdown of Primaries
2.2 Market Size Estimation
2.3 Market Breakdown & Data Triangulation
2.4 Research Assumptions
2.5 Limitations
3 Executive Summary (Page No. - 24)
4 Premium Insights (Page No. - 28)
4.1 Attractive Opportunities in the Market
4.2 Market, By Application
4.3 Market, By Fuel Type
4.4 Market, By Power Rating
4.5 Middle East & Africa: Market, By Country
4.6 Market, By Country
5 Market Overview (Page No. - 33)
5.1 Introduction
5.2 Market Dynamics
5.2.1 Drivers
5.2.1.1 Absence of Power Infrastructure in Some Areas
5.2.1.2 Increasing Demand for Electricity in Remote Areas
5.2.1.3 Frequent Natural Disasters
5.2.2 Restraints
5.2.2.1 Non-Availability of Fuel in Remote Locations
5.2.2.2 Varied Regional Terrain Hindering Transportation
5.2.3 Opportunities
5.2.3.1 The Un �Sustainable Energy for All� Campaign
5.2.4 Challenges
5.2.4.1 Stringent Emission Regulations
6 Market, By Application (Page No. - 38)
6.1 Introduction
6.2 Emergency Power
6.3 Oil & Gas
6.4 Remote Area Electrification
6.5 Others
7 Market, By Fuel Type (Page No. - 43)
7.1 Introduction
7.2 Natural Gas/LPG
7.3 Diesel
7.4 Others
8 Market, By Power Rating (Page No. - 48)
8.1 Introduction
8.2 1�10 MW
8.3 11�20 MW
8.4 21�50 MW
9 Market, By Region (Page No. - 52)
9.1 Introduction
9.2 Middle East & Africa
9.2.1 By Application
9.2.2 By Fuel Type
9.2.3 By Power Rating
9.2.4 By Country
9.2.4.1 Angola
9.2.4.2 Algeria
9.2.4.3 Saudi Arabia
9.2.4.4 Nigeria
9.2.4.5 Rest of the Middle East & Africa
9.3 Asia Pacific
9.3.1 By Application
9.3.2 By Fuel Type
9.3.3 By Power Rating
9.3.4 By Country
9.3.4.1 Indonesia
9.3.4.2 Japan
9.3.4.3 India
9.3.4.4 China
9.3.4.5 Australia
9.3.4.6 Rest of Asia Pacific
9.4 North America
9.4.1 By Application
9.4.2 By Fuel Type
9.4.3 By Power Rating
9.4.4 By Country
9.4.4.1 Us
9.4.4.2 Canada
9.4.4.3 Mexico
9.5 Europe
9.5.1 By Application
9.5.2 By Fuel Type
9.5.3 By Power Rating
9.5.4 By Country
9.5.4.1 Russia
9.5.4.2 Uk
9.5.4.3 Germany
9.5.4.4 France
9.5.4.5 Italy
9.5.4.6 Rest of Europe
9.6 South America
9.6.1 By Application
9.6.2 By Fuel Type
9.6.3 By Power Rating
9.6.4 By Country
9.6.4.1 Venezuela
9.6.4.2 Brazil
9.6.4.3 Argentina
9.6.4.4 Rest of South America
10 Competitive Landscape (Page No. - 86)
10.1 Overview
10.2 Ranking of Players and Industry Concentration, 2016
10.3 Competitive Scenario
10.3.1 Partnerships & Collaborations
10.3.2 New Product Launches
10.3.3 Investments & Expansions
10.3.4 Contracts & Agreements
10.3.5 Others
11 Company Profiles (Page No. - 91)
11.1 Benchmarking
(Business Overview, Products Offered, Recent Developments, and MnM View)*
11.2 Siemens
11.3 General Electric
11.4 PW Power Systems
11.5 APR Energy
11.6 Kawasaki Heavy Industries
11.7 Metka
11.8 Solar Turbines
11.9 Turbine Technology Services
11.10 Vericor
11.11 Mapna Group
11.12 Meidensha
11.13 Ethos Energy
*Details on Business Overview, Products Offered, Recent Developments, and MnM View Might Not Be Captured in Case of Unlisted Companies.
12 Appendix (Page No. - 113)
12.1 Insights of Industry Experts
12.2 Discussion Guide
12.3 Knowledge Store: Marketsandmarkets� Subscription Portal
12.4 Introducing RT: Real-Time Market Intelligence
12.5 Available Customizations
12.6 Related Reports
12.7 Author Details
List of Tables (69 Tables)
Table 1 Mobile Power Plant Market Snapshot
Table 2 Investments Required for Universal Electricity Access By 2030
Table 3 Countries With Greater Risk of Natural Disaster
Table 4 Global Market Size, By Application, 2015�2022 (USD Million)
Table 5 Emergency Power: Market Size, By Region, 2015�2022 (USD Million)
Table 6 Oil & Gas: Market Size, By Region, 2015�2022 (USD Million)
Table 7 Remote Area Electrification: Market Size, By Region, 2015�2022 (USD Million)
Table 8 Others: Market Size, By Region, 2015�2022 (USD Million)
Table 9 Global Market Size, By Fuel Type, 2015�2022 (USD Million)
Table 10 Natural Gas/LPG: Market Size, By Region, 2015�2022 (USD Million)
Table 11 Diesel: Market Size, By Region, 2015�2022 (USD Million)
Table 12 Others: Market Size, By Region, 2015�2022 (USD Million)
Table 13 Global Market Size, By Power Rating, 2015�2022 (USD Million)
Table 14 1�10 MW: Market Size, By Region, 2015�2022 (USD Million)
Table 15 11�20 MW: Market Size, By Region, 2015�2022 (USD Million)
Table 16 21�50 MW: Market Size, By Region, 2015�2022 (USD Million)
Table 17 Global Market Size, By Region, 2015�2022 (USD Million)
Table 18 Top Five Largest Countries: Market Size, 2015�2022 (USD Million)
Table 19 Top Five Fastest Growing Countries: Market, 2015�2022 (USD Million)
Table 20 Middle East & Africa: Market Size, By Country, 2015�2022 (USD Million)
Table 21 Middle East & Africa: Market Size, By Application, 2015�2022 (USD Million)
Table 22 Middle East & Africa: Market Size, By Fuel Type, 2015�2022 (USD Million)
Table 23 Middle East & Africa Market Size, By Power Rating, 2015�2022 (USD Million)
Table 24 Angola: Market Size, By Application, 2015�2022 (USD Million)
Table 25 Algeria: Market Size, By Application, 2015�2022 (USD Million)
Table 26 Saudi Arabia: Market Size, By Application, 2015�2022 (USD Million)
Table 27 Nigeria: Market Size, By Application, 2015-2022 (USD Million)
Table 28 Rest of the Middle East & Africa: Market Size, By Application, 2015�2022 (USD Million)
Table 29 Asia Pacific: Market Size, By Country, 2015�2022 (USD Million)
Table 30 Asia Pacific: Market Size, By Application, 2015�2022 (USD Million)
Table 31 Asia Pacific: Market Size, By Fuel Type, 2015�2022 (USD Million)
Table 32 Asia Pacific: Market Size, By Power Rating, 2015�2022 (USD Million)
Table 33 Indonesia: Market Size, By Application, 2015�2022 (USD Million)
Table 34 Japan: Market Size, By Application, 2015�2022 (USD Million)
Table 35 India: Market Size, By Application, 2015�2022 (USD Million)
Table 36 China: Mobile Power Plant Size, By Application, 2015�2022 (USD Million)
Table 37 Australia:Market Size, By Application, 2015�2022 (USD Million)
Table 38 Rest of Asia Pacific: Market Size, By Application, 2015�2022 (USD Million)
Table 39 North America: Market Size, By Country, 2015�2022 (USD Million)
Table 40 North America: Market Size, By Application, 2015�2022 (USD Million)
Table 41 North America: Market Size, By Fuel Type, 2015�2022 (USD Million)
Table 42 North America: Market Size, By Power Rating, 2015�2022 (USD Million)
Table 43 US: Market Size, By Application, 2015�2022 (USD Million)
Table 44 Canada: Market Size, By Application, 2015�2022 (USD Million)
Table 45 Mexico: Market Size, By Application, 2015�2022 (USD Million)
Table 46 Europe: Market Size, By Country, 2015�2022 (USD Million)
Table 47 Europe: Market Size, By Application, 2015�2022 (USD Million)
Table 48 Europe: Market Size, By Fuel Type, 2015�2022 (USD Million)
Table 49 Europe: Market Size, By Power Rating, 2015�2022 (USD Million)
Table 50 Russia: Market Size, By Application, 2015�2022 (USD Million)
Table 51 UK: Market Size, By Application, 2015�2022 (USD Million)
Table 52 Germany: Market Size, By Application, 2015�2022 (USD Million)
Table 53 France: Market Size, By Application, 2015�2022 (USD Million)
Table 54 Italy: Market Size, By Application, 2015�2022 (USD Million)
Table 55 Rest of Europe: Market Size, By Application, 2015�2022 (USD Million)
Table 56 South America: Market Size, By Country, 2015�2022 (USD Million)
Table 57 South America: Market Size, By Application, 2015�2022 (USD Million)
Table 58 South America: Market Size, By Fuel Type, 2015�2022 (USD Million)
Table 59 South America: Market Size, By Power Rating, 2015�2022 (USD Million)
Table 60 Venezuela: Market Size, By Application, 2015�2022 (USD Million)
Table 61 Brazil: Market Size, By Application, 2015�2022 (USD Million)
Table 62 Argentina: Market Size, By Application, 2015�2022 (USD Million)
Table 63 Rest of South America: Market Size, By Application, 2015�2022 (USD Million)
Table 64 Market Development Between 2014 & 2017
Table 65 Partnerships & Collaborations, 2017
Table 66 New Product Launches, 2014�2017
Table 67 Investments & Expansions, 2017
Table 68 Contracts & Agreements, 2014�2017
Table 69 Others, 2014
List of Figures (37 Figures)
Figure 1 Markets Covered: Market
Figure 2 Mobile Power Plant Market: Research Design
Figure 3 Breakdown of Primary Interviews: By Company Type, Designation, & Region
Figure 4 Market Size Estimation Methodology: Bottom-Up Approach
Figure 5 Market Size Estimation Methodology: Top-Down Approach
Figure 6 Data Triangulation Methodology
Figure 7 Emergency Power Segment is Expected to Dominate the Market During the Forecast Period
Figure 8 Natural Gas/LPG Segment is Expected to Dominate the Market During the Forecast Period
Figure 9 21�50 MW Segment is Expected to Lead the Market During the Forecast Period
Figure 10 The Middle East & Africa Led the Market in 2016
Figure 11 The Rising Demand for Electricity in Remote Areas is Driving the Market During the Forecast Period
Figure 12 Remote Area Electrification Segment is Expected to Grow at the Highest CAGR During the Forecast Period
Figure 13 Natural Gas/LPG Segment is Expected to Grow at the Highest CAGR During the Forecast Period
Figure 14 21�50 MW Segment is Expected to Dominate the Market During the Forecast Period
Figure 15 Angola Held the Largest Share of the Market in the Middle East & Africa in 2016
Figure 16 Indonesian Market is Expected to Grow at the Highest CAGR During the Forecast Period
Figure 17 Market Dynamics: Drivers, Restraints, Opportunities, & Challenges
Figure 18 Emergency Power Segment Led the Market in 2016
Figure 19 Natural Gas Segment is Expected to Dominate the Market, By Fuel Type, During the Forecast Period
Figure 20 21�50 MW Segment is Expected to Dominate the Market During the Forecast Period
Figure 21 Regional Snapshot: the Market in Asia Pacific is Expected to Grow at the Highest CAGR During the Forecast Period
Figure 22 The Middle East & Africa Market is Expected to Be the Largest for the Market During the Forecast Period
Figure 23 Middle East & Africa: Market Snapshot
Figure 24 Angola: the Largest Market in the Middle East & Africa, 2016
Figure 25 Asia Pacific Market Snapshot
Figure 26 Indonesia: the Largest Market in Asia Pacific, 2016
Figure 27 US Led the Market in 2016
Figure 28 Russia Led the European Market, 2016
Figure 29 Venezuela: the Largest Market in South America in 2017
Figure 30 Key Developments in the Market, 2014�2017
Figure 31 GE Held the Largest Share in the Market, By Sales Value, in 2016
Figure 32 Benchmarking of Top Five Players
Figure 33 Siemens: Company Snapshot
Figure 34 General Electric: Company Snapshot
Figure 35 Kawasaki Heavy Industries: Company Snapshot
Figure 36 Metka: Company Snapshot
Figure 37 Meidensha: Company Snapshot


Growth opportunities and latent adjacency in Mobile Power Plant Market