Man-Portable Communication Systems Market by Platforms (Land, Airborne, Naval), by Application (Software Defined Radios, SATCOM, Encryption, Smartphones, Homeland Security, Commercial), & by Geography [North America, Asia-Pacific, Europe, the Middle East & ROW) - Forecast & Analysis (2025–2035)
Market Overview

Source: MarketsandMarkets Analysis, Secondary Research, Primary Interviews
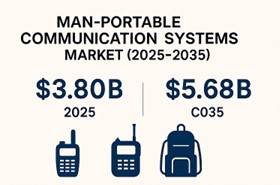
The global man-portable communication systems market is estimated to be ~ USD 3.80 billion in 2025 and is projected to reach around USD 5.68 billion by 2035, reflecting a blended compound annual growth rate (CAGR) of ~4.1%. The modernization of tactical communications supports growth, including the adoption of resilient MANET waveforms, multi-band/multi-bearer radios, and SATCOM-on-the-move kits, all designed for use in contested and austere environments.
Defense budgets in Europe and the Indo-Pacific, coalition interoperability requirements, and lessons from recent conflicts are accelerating refresh cycles for secure, jam-resilient soldier radios, cognitive HF, and dismounted broadband backbones. Programs increasingly emphasize Size-Weight-Power-and-Cost (SWaP-C) reductions, extended battery endurance, Over-the-Air Rekeying (OTAR), and seamless roaming across L-/S-/C-band SATCOM, LTE/5G, and line-of-sight links.
Segmentation Analysis

Source: MarketsandMarkets Analysis, Secondary Research, Primary Interviews
Market by Platform / Form Factor
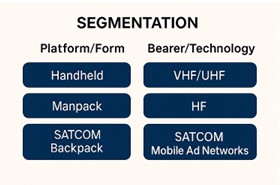
Handheld Radios
Rugged, single/dual-band SDRs used at squad and patrol level for secure PTT and low-rate data. Current refresh cycles prioritize AES/Type-1/CSfC-aligned crypto, GPS/SA apps on the handset, and better battery life. Procurement is volume-driven and favors standard accessories (such as earpieces, chargers, and remote PTT) to simplify sustainment.
Manpack Radios
Higher-power, multi-channel SDRs that deliver extended range, concurrent voice/data, and gateway functions between disparate nets. Newer models add wideband MANET, SATCOM control, and cross-band/cross-domain routing. Unit values are higher due to multi-bearer capability, embedded encryption, and accessories (amplifiers, high-gain antennas).
Wearable / Body-Worn Nodes
Lightweight mesh nodes integrated into plate carriers or vests to create a resilient, self-healing IP backbone at the section/squad level. Key differentiators are SWaP-C, heat management, and silent watch endurance. Adoption grows with the integration of dismounted video/UGV feeds, as well as ATAK/SA tools.
SATCOM Backpack Kits (OTM/OTP)
Backpack terminals (L/S/C/Ka) that provide beyond-line-of-sight reach for voice, chat, and data in austere terrain. Demand is shifting toward electronically steered, quick-acquire antennas, integrated modems, and native routing to MANET/LTE cells. Programs emphasize assured PACE and minimal time-to-link.
Antennas & Ancillaries (Power, Cables, Masts)
Intelligent batteries, multi-chemistry chargers, RF filters, lightweight masts, and cabling kits that determine real-world range and mission time. Standardization around standard soldier batteries and quick-swap packs reduces logistics and total cost of ownership.
Market by Bearer / Technology
VHF/UHF Line-of-Sight (LOS)
The foundational bearer for secure PTT and battle drills. Modern LOS radios increasingly host programmable waveforms, embedded GPS, and limited data services. Priorities: LPI/LPD performance, fast net join, and robust ECCM against barrage/jitter jamming.
HF (including Cognitive HF)
Provides SAT-denied, beyond-line-of-sight communications using ionospheric skip. Cognitive HF adds auto-tuning and channel selection to raise link availability. Used for long-range patrols, maritime interdiction, and redundant C2 paths; demand rises with anti-access/area-denial concerns.
SATCOM (L/S/C/Ka; OTM/OTP)
Assured reachback for voice/data/video across the theater. Programs seek terminals with smaller SWaP, faster acquisition, and integrated crypto. Growth is tied to proliferated LEO/MEO options and managed services that guarantee throughput and priority access.
MANET / Mesh (Wideband IP)
Self-healing, high-throughput networks for SA, video, and sensor backhaul. Differentiated by waveform efficiency, MIMO/beamforming support, hop counts, and mobility at speed. Increasingly acts as the dismounted backbone with native gateways to SATCOM and LTE.
LTE/5G Tactical Cells
Portable eNodeB/gNodeB kits extend broadband connectivity to the edge, supporting video, data, and applications. Used for bases, disaster response, and urban operations, with roaming to civil networks when policy allows. Procurement emphasizes spectrum agility and secure interoperability with SDR/MANET.
Cross-Bearer Gateways & Routing
Software stacks that translate between HF/LOS/MANET/SATCOM/LTE, enforce crypto domains, and automate PACE switching. Value lies in policy-based routing, QoS, and zero-touch provisioning, which reduce the cognitive load on the operator.
Market by Application
Secure Voice & Push-to-Talk
Mission-critical voice with end-to-end encryption and OTAR. Requirements: near-instant call setup, reliable coverage in urban/forest terrain, and interoperability across agencies and coalition partners.
IP Data Networking
Chat, file transfer, telemetry, and command apps delivered over wideband bearers. Buyers evaluate effective throughput in terms of mobility, latency, and app compatibility (e.g., ATAK, BMS, telemedicine).
Situational Awareness (SA) & Blue-Force Tracking (BFT)
Location, mapping, and alerts on handheld devices. Demand is tied to standard data formats, low-bandwidth modes, and confidence in position accuracy without over-the-horizon infrastructure.
ISR Sensor Backhaul (Video/Telemetry)
Dismounted feeds from UAS/UGV/sensors over MANET/LTE with SATCOM backhaul. KPIs: sustained Mbps at range, packet loss under movement, and encryption compliance for classified feeds.
Command & Control (C2)
Voice/data for platoon-to-battalion command posts with cross-domain gateways. Emphasis on resilient backbones, automated reroute under attack, and audit trails for mission reporting.
Disaster Relief & Public Safety
Rapidly deployable kits for multi-agency events, with roaming to public networks and priority services. Buyers seek simple UI, fast network bring-up, and shared device pools.
Market by End User
Army (Infantry/Mechanized)
Most extensive installed base; structured replacements tied to brigade combat team rotations. Focus on durable handhelds, manpacks as gateways, and standardized power ecosystems.
Special Operations Forces (SOF)
Early adopters of multi-channel SDRs, compact SATCOM, and advanced MANET. Procurement centers on low signature (LPI/LPD), modularity, and integration with sensors and tactical apps.
Marines / Expeditionary Forces
Ship-to-shore operations demand amphibious-proof, salt-fog-resistant kits and rapid mesh establishment. Priorities include small-unit video and cross-deck interoperability.
Air Forces (JTAC/TACP)
Air-ground integration with close-air-support tooling, laser/targeting device integration, and high-fidelity voice. Radios must interoperate with aircraft waveforms and meet stringent crypto requirements.
Naval / Maritime Boarding Teams
Salt-fog and shock standards, line-of-sight over water, and compact SATCOM for interdiction missions. Interest in body-worn nodes integrated with cameras and biometrics.
Homeland Security & Public Safety
Cross-agency interoperability, rapid deployability, and cost-effective sustainment. Increasing adoption of LTE/5G tactical cells bridged to SDR/MANET for incident command.
Peacekeeping / Coalition Forces
Mixed-fleet interop, multilingual UI, and simpler logistics (chargers, spares). Procurement favors standards-based waveforms and training packages.
Regional Outlook

Source: MarketsandMarkets Analysis, Secondary Research, Primary Interviews
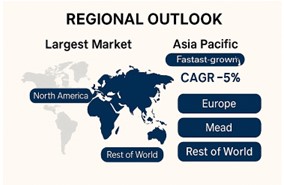
North America remains the largest market due to sustained procurement of modernized SDRs and Type-1 certified solutions. Europe is scaling multi-band radios, MANET, and secure SATCOM as NATO members lift spending. Asia Pacific is the fastest-growing region, driven by border security programs, island/archipelagic communications, and sovereign production initiatives. The Middle East pursues networked soldier programs and vehicle-to-dismount integration, while Latin America and Africa emphasize rugged, cost-effective kits for internal security and disaster response.
Competitive Landscape

Source: MarketsandMarkets Analysis, Secondary Research, Primary Interviews
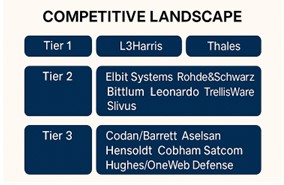
The ecosystem combines Tier-1 radio OEMs, SATCOM specialists, and mesh-network innovators. Representative participants include L3Harris Technologies, Thales Group, Collins Aerospace, Elbit Systems, Rohde & Schwarz, Bittium, and Leonardo across prime radio lines; TrellisWare Technologies and Silvus Technologies in high-performance MANET; and Codan/Barrett, Aselsan, HENSOLDT, Cobham Satcom (Chelton), and Hughes/OneWeb Defense spanning HF, SATCOM terminals, and hybrid backbones. Strategic priorities center on reducing SWaP-C, achieving multi-channel concurrency, enhancing LPI/LPD performance, ensuring assured PACE architectures, and facilitating faster field upgrades through software feature licenses.
Regulatory & Certification
Deployments adhere to MIL-STD-810 (environmental) and MIL-STD-461 (EMI/EMC), with STANAG profiles guiding coalition interoperability. Programs requiring TEMPEST/EMSEC follow national policies. In the U.S., NSA Type-1 or CSfC pathways and JITC interoperability testing, gate fielding of cryptographic and IP-based tactical systems. ITAR/EAR controls govern exportability.
Sustainability & Power
Battery endurance and logistics form a core sustainability lever. New chemistries, intelligent power management, and standard soldier batteries reduce resupply burden. Modular designs, field-repairable ancillaries, and firmware-upgradable SDR architectures extend service life and reduce the total cost of ownership.
Technology Trends
Next-generation systems prioritize multi-channel SDRs that run concurrently with voice/data and flexible waveforms; cognitive HF for SAT-denied reach; beamforming/MIMO MANET for higher throughput and range; and seamless roaming across SATCOM, LTE, and LOS. Edge encryption, Over-the-Air Programming (OTAP), and AI-assisted spectrum management enhance resilience against jamming and direction-finding. At the same time, integrated battle-management apps bring mapping, video, and SA onto a single, handheld UI.
Why This Report
The MarketsandMarkets Man-Portable Communication Systems Report (2025–2035) quantifies demand by platform, bearer, and end-user; benchmarks vendor capabilities; and explains the certification, spectrum, and technology dynamics shaping tactical communications over the next decade.
FAQs (Featured Snippet Ready)
Q1. What is the market size of man-portable communication systems?
A1. The market is estimated to be ~USD 3.80 billion in 2025 and is projected to reach ~USD 5.68 billion by 2035, with a compound annual growth rate (CAGR) of ~4.1%.
Q2. What is driving demand?
A2. Defense modernization, resilient MANET and SATCOM backbones, SWaP-C optimization, and interoperability requirements across NATO and Indo-Pacific coalitions.
Q3. Which platforms lead adoption?
A3. Handheld and manpack SDRs lead by installed base; backpack SATCOM kits and multi-channel radios lead by value in high-bandwidth C2/ISR roles.
Q4. Who are the key vendors?
A4. L3Harris, Thales, Collins Aerospace, Elbit Systems, Rohde & Schwarz, Bittium, Leonardo, TrellisWare, Silvus, Codan/Barrett, Aselsan, HENSOLDT, Cobham Satcom, Hughes/OneWeb Defense.
Q5. What certifications apply?
A5. MIL-STD-810/461, STANAG profiles, TEMPEST/EMSEC where required; NSA Type-1/CSfC and JITC govern U.S. crypto/interoperability approvals; exports follow ITAR/EAR.
Q6. How are sustainability and power addressed?
A6. Common soldier batteries, smart power management, modular/repairable hardware, and firmware upgrade paths reduce logistical burden and extend the lifecycle.

Table Of Contents
1 Introduction (Page No. - 18)
1.1 Key Objectives
1.2 Report Description
1.3 Market Scope
1.4 Stakeholders
1.5 Forecast Assumptions
1.6 Research Methodology
1.6.1 Market Size Estimation
1.6.2 Market Crackdown & Data Triangulation
1.7 Primary Research Insight
1.7.1 Kevin Ferguson–Director Business Development, Ultra Electronics, Canada
2 Executive Summary (Page No. - 30)
3 Market Overview (Page No. - 31)
3.1 Market Definition
3.2 Market Segmentation
3.3 Aerospace & Defense Value Chain: The Bullwhip Effect
3.4 Market Dynamics
3.4.1 Drivers
3.4.1.1 C2 Systems Require Information At Soldier Level
3.4.1.2 Emergence Of Virtual Channels
3.4.1.3 Modernization And Replacement Of Aging Equipment
3.4.1.4 Requirement For More Bandwidth
3.4.2 Restraints
3.4.2.1 Defense Budget Cuts
3.4.2.2 Power Issues: A Major Restraint
3.4.3 Challenges
3.4.3.1 Size, Weight, And Energy Consumption
3.4.3.2 Enhancing Battlefield Wireless Security
3.4.3.3 Reduced Frequency Spectrum
3.4.4 Opportunities
3.4.4.1 Mobile Ad-Hoc Network (MANET)
3.4.4.2 Ka-Band Satellites
3.5 Product Lifecycle
3.6 Market Share Analysis
3.7 Environment Threat Opportunity Profile ETOP Analysis
4 Global Man-Portable Communication Systems Market, By Application (Page No. - 48)
4.1 Software Defined Radios (SDR): Trends & Analysis
4.2 Satellite Communications (SATCOMS): Trends & Analysis
4.3 Encryption: Trends & Analysis
4.4 Smartphones: Trends & Analysis
4.5 Homeland Security: Trends & Analysis
4.6 Man-Portable Commercial Systems: Trends & Analysis
5 Regional Analysis (Page No. - 63)
5.1 Asia-Pacific: The Biggest Growth Region
5.2 Europe: A Stable Defense Market
5.3 North America: A Mature Communications Market
5.4 The Middle East: An Emerging Defense Market
5.5 Row: An Untapped Potential Market
6 Country Analysis (Page No. - 82)
6.1 Australia: The Distinguished Continent
6.2 Brazil: An Emerging Hot Pocket
6.3 Canada: An Exclusive Satellite Market
6.4 Finland: A Developing Defense Market
6.5 France: A Contemporary Communications Market
6.6 Germany: The Technology Pioneer
6.7 India: A Lucrative Market
6.8 Israel: An Immense Leap In Defense Communications
6.9 Japan: A Booming Technology Market
6.10 Oman: A Potential Packed Market
6.11 Russia: A “Future Soldier” Market
6.12 South Africa: An Upcoming Revenue Pocket
6.13 U.K.: An Established Communication Market
6.14 U.S.: An Evident Market Leader
7 Competitive Landscape (Page No. - 141)
7.1 Market Share Analysis, By Company
7.2 Opportunity Analysis, By Region
7.3 Top Growing Countries
8 Company Profiles (Page No. - 146)
8.1 Harris Corporation
8.1.1 Overview
8.1.2 Products & Services
8.1.3 Strategy & Insights
8.1.4 Developments
8.1.5 MNM View
8.1.5.1 Company Review
8.1.5.2 SWOT Analysis
8.2 Thales Group
8.2.1 Overview
8.2.2 Products & Services
8.2.3 Strategy & Insights
8.2.4 Developments
8.2.5 MNM View
8.2.5.1 Company Review
8.2.5.2 SWOT Analysis
8.3 Rockwell Collins
8.3.1 Overview
8.3.2 Products & Services
8.3.3 Strategy & Insights
8.3.4 Developments
8.3.5 MNM View
8.3.5.1 Company Review
8.3.5.2 SWOT Analysis
8.4 BAE Systems
8.4.1 Overview
8.4.2 Products & Services
8.4.3 Strategy & Insights
8.4.4 Developments
8.4.5 MNM View
8.4.5.1 Company Review
8.4.5.2 SWOT Analysis
8.5 Saab AB
8.5.1 Overview
8.5.2 Products & Services
8.5.3 Strategy & Insights
8.5.4 Developments
8.5.5 MNM View
8.5.5.1 Company Review
8.5.5.2 SWOT Analysis
8.6 Aselsan
8.6.1 Overview
8.6.2 Products & Services
8.6.3 Strategy & Insights
8.6.4 Developments
8.7 CobhamPlc
8.7.1 Overview
8.7.2 Products & Services
8.7.3 Strategy & Insights
8.7.4 Developments
8.8 Codan Limited
8.8.1 Overview
8.8.2 Products & Services
8.8.3 Strategy & Insights
8.8.4 Developments
8.9 Elbit Systems
8.9.1 Overview
8.9.2 Products & Services
8.9.3 Strategy & Insights
8.9.4 Developments
8.10 General Dynamics Corporation
8.10.1 Overview
8.10.2 Products & Services
8.10.3 Strategy & Insights
8.10.4 Developments
8.11 ITT Corporation
8.11.1 Overview
8.11.2 Products & Services
8.11.3 Strategy & Insights
8.11.4 Developments
8.12 L-3 Communications Holdings Inc.
8.12.1 Overview
8.12.2 Products & Services
8.12.3 Strategy & Insights
8.12.4 Developments
8.13 Ultra Electronics
8.13.1 Overview
8.13.2 Products & Services
8.13.3 Strategy & Insights
8.13.4 Developments
8.14 Viasat
8.14.1 Overview
8.14.2 Products & Services
8.14.3 Strategy & Insights
8.14.4 Developments
List Of Tables (81 Tables)
Table 1 Bifurcation Of The Years Taken Into Account
Table 2 Impact Analysis Of Drivers: Man-Portable Communication Systems Market
Table 3 Impact Analysis Of Restraints
Table 4 Global MPC Systems Market Value, By Region, 2014-2019 ($Billion)
Table 5 Global MPC Systems Market Value, By Procurement, 2014-2019 ($Million)
Table 6 ETOP Analysis: MPC Systems
Table 7 Global Software Defined Radio Market Value, By Region, 2014-2019 ($Million)
Table 8 Global SATCOM Market Value, By Region, 2014-2019 ($Million)
Table 9 Global Encryption Market Value, By Region, 2014-2019 ($Million)
Table 10 Global Military Smartphones Market Value,By Region, 2014-2019 ($Million)
Table 11 Global Man-Portable Homeland Security Communication Systems Market Value, By Region, 2014-2019 ($Million)
Table 12 Global Man-Portable Commercial Systems Market Value, By Region, 2014-2019 ($Million)
Table 13 Asia-Pacific: Man-Portable Communication Systems Market Value, By Platform, 2014-2019 ($Million)
Table 14 Asia-Pacific: MPC Systems Market Value, By Application, 2014-2019 ($Million)
Table 15 Asia-Pacific: MPC Systems Market Value, By Procurement, 2014-2019 ($Million)
Table 16 Europe: Man-Portable Communication Systems Market Value, By Platform, 2014-2019 ($Million)
Table 17 Europe: MPC Systems Market Value, By Application, 2014-2019 ($Million)
Table 18 Europe: Market Value, By Procurement, 2014-2019 ($Million)
Table 19 North America: Man-Portable Communication Systems Market Value, By Platform, 2014-2019 ($Million)
Table 20 North America: Market Value, By Application, 2014-2019 ($Million)
Table 21 North America: Market Value, By Procurement, 2014-2019 ($Million)
Table 22 The Middle East: Man-Portable Communication Systems Market Value, By Application, 2014-2019 ($Million)
Table 23 The Middle East: Market Value, By Procurement, 2014-2019 ($Million)
Table 24 Row: Market Value, By Application, 2014-2019 ($Million)
Table 25 Row: Market Value, By Procurement, 2014-2019 ($Million)
Table 26 Australia: Market Landscape
Table 27 Australia: Man-Portable Communication Systems Market Value, By Application, 2014-2019 ($Million)
Table 28 Australia: Market Value, By Procurement, 2014-2019 ($Million)
Table 29 Brazil: Market Landscape
Table 30 Brazil: Market Value, By Application, 2014-2019 ($Million)
Table 31 Brazil: Market Value, By Procurement, 2014-2019 ($Million)
Table 32 Canada: Market Landscape
Table 33 Canada: Man-Portable Communication Systems Market Value, By Application, 2014-2019 ($Million)
Table 34 Canada: Market Value, By Procurement, 2014-2019 ($Million)
Table 35 Finland: Market Landscape
Table 36 Finland: Market Value, By Application, 2014-2019 ($Million)
Table 37 Finland: Market Value, By Procurement, 2014-2019 ($Million)
Table 38 France: Market Landscape
Table 39 France: Man-Portable Communication Systems Market Value, By Application, 2014-2019 ($Million)
Table 40 France: Market Value, By Procurement, 2014-2019 ($Million)
Table 41 Germany: Market Landscape
Table 42 Germany: Man-Portable Communication Systems Market Value, By Application, 2014-2019 ($Million)
Table 43 Germany: Market Value, By Procurement, 2014-2019 ($Million)
Table 44 India: Market Landscape
Table 45 India: Man-Portable Communication Systems Market Value, By Application, 2014-2019 ($Million)
Table 46 India: Market Value, By Procurement, 2014-2019 ($Million)
Table 47 Israel: Market Landscape
Table 48 Israel: Man-Portable Communication Systems Market Value, By Application, 2014-2019 ($Million)
Table 49 Israel: Market Value, By Procurement, 2014-2019 ($Million)
Table 50 Japan: Market Landscape
Table 51 Japan: Man-Portable Communication Systems Market Value, By Application, 2014-2019 ($Million)
Table 52 Japan: Market Value, By Procurement, 2014-2019 ($Million)
Table 53 Oman: Market Landscape
Table 54 Oman: Market Value, By Application, 2014-2019 ($Million)
Table 55 Oman: Market Value, By Procurement, 2014-2019 ($Million)
Table 56 Russia: Market Landscape
Table 57 Russia: Man-Portable Communication Systems Market Value, By Application, 2014-2019 ($Million)
Table 58 Russia: Market Value, By Procurement, 2014-2019 ($Million)
Table 59 South Africa: Market Landscape
Table 60 South Africa: Man-Portable Communication Systems Market Value, By Application, 2014-2019 ($Million)
Table 61 South Africa: Market Value, By Procurement, 2014-2019 ($Million)
Table 62 U.K.: Market Landscape
Table 63 U.K.: Man-Portable Communication Systems Market Value, By Application, 2014-2019 ($Million)
Table 64 U.K.: Market Value, By Procurement, 2014-2019 ($Million)
Table 65 U.S.: Market Landscape
Table 66 U.S.: Man-Portable Communication Systems Market Value, By Application, 2014-2019 ($Million)
Table 67 U.S.: Market Value, By Procurement, 2014-2019 ($Million)
Table 68 Harris Corporation: Products/Services & Their Description
Table 69 Thales Group: Products/Services & Their Description
Table 70 Rockwell Collins: Products/Services & Their Description
Table 71 BAE Systems: Products/Services & Their Description
Table 72 Saab AB: Products/Services & Their Description
Table 73 Aselsan: Products/Services & Their Description
Table 74 Cobham: Products/Services & Their Description
Table 75 Codan: Products/Services & Their Description
Table 76 Elbit Systems: Products/Services & Their Description
Table 77 General Dynamics: Products/Services & Their Description
Table 78 ITT Corporation: Products/Services & Their Description
Table 79 L-3 Communications: Products/Services & Their Description
Table 80 Ultra Electronics: Products/Services & Their Description
Table 81 Viasat: Products/Services & Their Description
List Of Figures (61 Figures)
Figure 1 Market Scope
Figure 2 Man-Portable Communication Systems Stakeholders
Figure 3 Research Methodology
Figure 4 Market Size Estimation
Figure 5 Market: Data Triangulation
Figure 6 MPC Systems Market Segmentation
Figure 7 Aerospace & Defense Value Chain
Figure 8 Market Drivers & Restraints
Figure 9 Market Drivers And Restraints Analysis
Figure 10 Challenges: MPC Systems
Figure 11 Man-Portable Communication Systems Product Lifecycle
Figure 12 Global Market Share, By Region, 2014-2019
Figure 13 Global Market, By Platform, 2014-2019 ($Billion)
Figure 14 ETOP Analysis: MPC Systems
Figure 15 Global Software Defined Radio Market Value, By Size, 2014-2019 ($Million)
Figure 16 Global SATCOM Market Value, By Size, 2014-2019 ($Million)
Figure 17 Global Encryption Market Value, By Size 2014-2019 ($Million)
Figure 18 Global Military Smartphones Market Value, By Size, 2014-2019 ($Million)
Figure 19 Global Man-Portable Homeland Security Communication Systems Market Value, By Size, 2014-2019 ($Million)
Figure 20 Global Man-Portable Commercial Systems Market Value, By Size, 2014-2019 ($Million)
Figure 21 Asia-Pacific: Market Value, By Size, 2014-2019 ($Million)
Figure 22 Asia-Pacific: Market Value, By Procurement, Integration, & Maintenance, 2014-2019 ($Million)
Figure 23 Europe: Market Value, 2014-2019 ($Million)
Figure 24 Europe: Market Value, By Procurement, Integration, & Maintenance, 2014-2019 ($Million)
Figure 25 North America: MPC Systems Market Value, By Size, 2014-2019 ($Million)
Figure 26 North America: Market Value, By Procurement, Integration, & Maintenance, 2014-2019 ($Million)
Figure 27 The Middle East: Market, By Size, 2014-2019 ($Million)
Figure 28 The Middle East: Market Value, By Procurement, Integration, & Maintenance, 2014-2019 ($Million)
Figure 29 Row: MPC Systems Market, Revenue Forecast, 2014-2019 ($Million)
Figure 30 Row: Market Value, By Procurement, Integration, & Maintenance, 2014-2019 ($Million)
Figure 31 Australia: Market Value, By Size, 2014-2019 ($Million)
Figure 32 Australia: Market Value, By Procurement, Integration, & Maintenance, 2014-2019 ($Million)
Figure 33 Brazil: Market Value, By Size, 2014-2019 ($Million)
Figure 34 Brazil: Market Value, By Procurement, Integration, & Maintenance, 2014-2019 ($Million)
Figure 35 Canada: MPC Systems Market Value, By Size, 2014-2019 ($Million)
Figure 36 Canada: Market Value, By Procurement, Integration, & Maintenance, 2014-2019 ($Million)
Figure 37 Finland: MPC Systems Market Value, By Size, 2014-2019 ($Million)
Figure 38 Finland: Market Value, By Procurement, Integration, & Maintenance, 2014-2019 ($Million)
Figure 39 France: MPC Systems Market Value, By Size, 2014-2019 ($Million)
Figure 40 France: Market Value, By Procurement, Integration, & Maintenance, 2014-2019 ($Million)
Figure 41 Germany: MPC Systems Market Value, By Size, 2014-2019 ($Million)
Figure 42 Germany: Market Value, By Procurement, Integration, & Maintenance, 2014-2019 ($Million)
Figure 43 India: MPC Systems Market Value, By Size, 2014-2019 ($Million)
Figure 44 India: Market Value, By Procurement, Integration, & Maintenance, 2014-2019 ($Million)
Figure 45 Israel: MPC Systems Market Value, By Size, 2014-2019 ($Million)
Figure 46 Israel: Market Value, By Procurement, Integration, & Maintenance, 2014-2019 ($Million)
Figure 47 Japan: MPC Systems Market Value, By Size, 2014-2019 ($Million)
Figure 48 Japan: Market Value, By Procurement, Integration, & Maintenance, 2014-2019 ($Million)
Figure 49 Oman: MPC Systems Market Value, By Size, 2014-2019 ($Million)
Figure 50 Oman: Market Value, By Procurement, Integration, & Maintenance, 2014-2019 ($Million)
Figure 51 Russia: MPC Systems Market Value, By Size, 2014-2019 ($Million)
Figure 52 Russia: Market Value, By Procurement, Integration, & Maintenance, 2014-2019 ($Million)
Figure 53 South Africa: MPC Systems Market Value, By Size, 2014-2019 ($Million)
Figure 54 South Africa: Market Value, By Procurement, Integration, & Maintenance, 2014-2019 ($Million)
Figure 55 U.K.: MPC Systems Market Value, By Size, 2014-2019 ($Million)
Figure 56 U.K.: Market Value, By Procurement, Integration, & Maintenance, 2014-2019 ($Million)
Figure 57 U.S.: MPC Systems Market Value, By Size, 2014-2019 ($Million)
Figure 58 U.S.: Market Value, By Procurement, Integration, & Maintenance, 2014-2019 ($Million)
Figure 59 Market Share Analysis, By Company
Figure 60 Opportunity Analysis, By Region
Figure 61 Top Growing Countries


Growth opportunities and latent adjacency in Man-Portable Communication Systems Market