Industrial IoT Display Market Size, Share & Growth

Industrial IoT Display Market Size, Share, Statistics and Industry Growth Analysis Report by Technology (LCD, LED, OLED), Panel Size, Application (HMI, Remote Monitoring), End-use Industry (Manufacturing, Energy & Power, Oil & Gas, Mining, Transportation) and Region - Global Forecast to 2028

Report Code: SE 8582 Feb, 2023, by marketsandmarkets.com

Updated on : October 22, 2024

Industrial IoT Display Market Size & Growth 

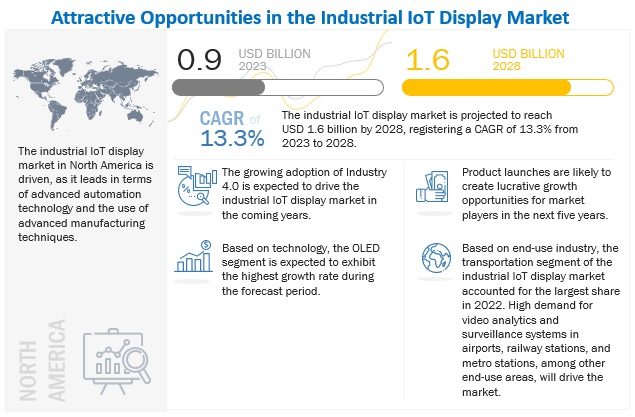
[215 Pages Report] The global Industrial IoT Display Market size is projected to reach USD 1.6 billion by 2028 from an estimated USD 0.9 billion in 2023, growing at a CAGR of 13.3% from 2023 to 2028. The growing adoption of IoT and increasing demand for HMI devices are among the factors driving the growth of the Industrial IoT Display market.
Industrial loT Display Market

To know about the assumptions considered for the study, Request for Free Sample Report

Industrial IoT Display Market Trends :

Driver: Rising emphasis on real-time data analysis and predictive maintenance

With the advent of technologies, such as the Industrial Internet of Things (IoT), predictive analytics is becoming more intelligent and empowering the manufacturing vertical. Along with the rising demand, manufacturers are using the capabilities of predictive analytics to enhance their production abilities. Countries such as the US and China have used predictive analytics to improve manufacturing at a global scale. There will be a prominent use of predictive analytics solutions in the manufacturing vertical for predictive maintenance, asset management, and remote monitoring applications.

Rapid developments in the global manufacturing industry are leading to strong competition in the manufacturing sector. Manufacturers across all end-use industries, such as oil & gas, F&B, automotive, and A&D, are constantly seeking solutions to help them obtain better visibility of manufacturing plants to enhance efficiency.

The convergence of robotics, artificial intelligence, and big data analytics has the potential to lead to significant improvements in productivity, efficiency, and cost reductions. IIoT creates a universe of sensors, allowing for faster deep learning of existing operations. These data technologies enable rapid contextualization as well as automated pattern and trend recognition.

Restraint: High installation and maintenance costs

The installation cost of industrial IoT displays and HMI systems is high, which acts as a major restraint for the growth of the market across Asia Pacific, the Middle East & Africa, and South America, which are among the cost-sensitive markets. The high installation cost of industrial IoT displays and HMI systems is due to the involvement of various stages, such as consultation, acquisition, implementation, and running costs, that further increase the expenditure of the installing company.

The introduction of smart manufacturing has resulted in the adoption of advanced industrial automation equipment, such as smart field devices and industrial robots. To communicate with these types of equipment, the displays and HMIs need to be more advanced with the latest functional technologies such as voice recognition, gesture recognition, and multi-touch screen, which further increases the cost of the system. These technologies are still quite expensive and may lead to an additional financial burden on industries operating in price-sensitive economies.

Opportunity: Growing demand for digital signage in industries

Industries have witnessed an increase in the adoption of digital signage in manufacturing and oil & gas applications. Digital signage displays such as industrial-grade touchscreen monitors, interactive touchscreen signage, and interactive display systems are used in different industrial environments based on the end application and use.

Digital display solutions, such as production display boards and other information displays, are used to improve employee engagement and interaction, deliver accurate information, transmit internal communications, display integral real-time data for lean production, and others. Digital signage systems in manufacturing application can increase awareness among workers toward their safety, alert workers to supply-chain concerns, and help reduce response time related to production quality issues. Digital signage displays also help eliminate or reduce print publishing and, in turn, eliminate wastage. Digital signage in manufacturing application acts as long-term engagement solution and is, therefore, expected to witness high adoption in the coming years.

Challenge: Increasing security risks associated with cloud–HMI platform

Cloud-IoT displays are gaining popularity as they can reduce initial costs, provide easy access, and quick deployment. However, security concerns associated with cloud computing are a major concern for end users. On a cloud-based platform, many customers can use the same service, which raises issues of data vulnerability. It is risky to share critical business information with third-party service providers, as information leaks can cause huge losses to the company. Furthermore, increasing occurrences of viruses and hacking lead to security concerns. The entire information flow could be disrupted if cloud service providers do not implement proper security measures. A majority of vulnerabilities in IoT displays and HMI are related to memory corruption, poor credential management, and code injection bugs, lack of authentication, and insecure defaults—all of which are preventable by improving the security.

By technology, TFT-LCDs to cater to the largest share

TFT-LCD technology held the highest share of the industrial loT display industry in 2022. TFT LCDs utilised for industrial lot displays have a wide range of features. They are extremely robust and are utilised in harsh settings. They have good visibility in a variety of indoor and outdoor environments. They are constructed with high-quality industrial-grade components and materials to withstand harsh testing such as ESD, EMI, and ageing. Their more than ten-year lifespan makes them extremely popular. LCDs are utilised in a variety of applications, including automotive, digital signage, medical and industrial displays, and electronic book readers. TFT-LCDs are in high demand in a variety of areas, including manufacturing, healthcare, transportation, and consumer electronics.

More than 20” panel size is expected to record the highest CAGR in the forecast period

The more than 20” panel size category held the largest share of the industrial lot display market in 2022. During the forecast period, it is also expected to grow at the fastest CAGR. Large panel displays are commonly utilised on the plant floor to display production status. High-resolution industrial monitors and video walls are commonly used in the oil and gas sector to analyse seismic imaging data. They are utilised in the transportation, manufacturing, and healthcare industries, as well as for learning, presentations, signs, and navigation.

Transportation segment accounted for the largest share of the Industrial IoT Display market in 2022

In 2022, transportation accounted for the largest share of the industrial IoT display market. The increasing adoption of video analytics and surveillance systems in airports, railway stations, and metro stations, among other end-use areas, is one of the key factors driving the transportation segment. The growing use of smart cameras for traffic monitoring, as well as for incident detection and reporting applications, is also contributing to the growth.

Industrial loT Display Market Regional Analysis

By 2028, Asia Pacific is projected to grow with the fastest CAGR in the forecast period
Industrial loT Display Market Size, and Share

To know about the assumptions considered for the study, download the pdf brochure

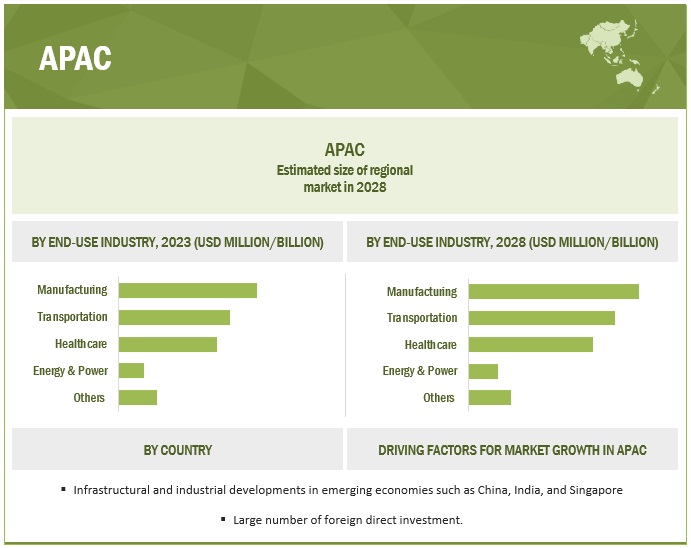
Asia Pacific is expected to record the highest CAGR during the forecast period. Asia Pacific is evolving as a global manufacturing hub as key Asian countries, such as China, India, and Singapore, have adopted a make-in-Asia initiative. For instance, the ‘Made in China 2025’ government initiative provides high-tech industries, such as robotics and AI, subsidies, low-interest loans, rent-free land, and tax breaks. Singapore is also heavily investing in industrial IoT as part of the country's Smart Nation initiative. Thus, the adoption of industrial IoT for remote monitoring and predictive maintenance in various end-use industries has aided in driving the industrial IoT display market size in Asia Pacific.

Top Industrial IoT Display Companies - Key Market Players:

The Industrial IoT Display companies such as

  • E Ink Holdings Inc. (Taiwan),
  • BOE Technology Group Co., Ltd. (China),
  • Advantech Co., Ltd. (Taiwan),
  • Pepperl+Fuchs SE (Germany),
  • Sharp Corporation (Japan),
  • PDi Digital  (Austria),
  • Planar Systems, Inc. (US),
  • Winmate Inc. (Taiwan),
  • Maple Systems Inc. (US)

Industrial IoT Display Market Report Scope :

Report Metric

Detail

Estimated Market Size USD 0.9 billion in 2023
Projected Market Size USD 1.6 billion by 2028
Growth Rate CAGR of  13.3%

Industrial loT Display Market Size Availability for Years

2019–2028

Base Year

2022

Forecast Period

2023–2028

Forecast Units

Value (USD Billion)

Segments Covered

  • By technology,
  • By panel size,
  • By Application,
  • By end-use industry, and
  • By region

Geographies Covered

  • North America,
  • Europe,
  • Asia Pacific, and
  • Rest of the World

Companies Covered

E Ink Holdings Inc. (Taiwan), BOE Technology Group Co., Ltd. (China), Advantech Co., Ltd. (Taiwan), Pepperl+Fuchs SE (Germany), Sharp Corporation (Japan), PDi Digital (Austria), Planar Systems, Inc. (US), Winmate Inc. (Taiwan), Maple Systems Inc. (US), American Industrial Systems Inc. (AIS) (US), Panasonic Corporation (Japan), Innolux Corporation (Taiwan), Display Technology Ltd (UK), LG Electronics (South Korea), Samsung Electronics Co., Ltd. (South Korea), Riverdi Sp. z o.o. (Poland), Melrose Systems (US), DKE CO., LTD. (China), Glide Technology Pvt. Ltd. (India), Schneider Electric (France), Kingtech Group Co., Ltd. (China), Crystal Display Systems Ltd (UK), Pervasive Displays, Inc. (Taiwan), Emsol Automation Pvt Ltd (India), and SENECA S.r.l. (Italy) are some of the key players in the Industrial IoT Display market.
A total of 25 players are covered.

This research report categorizes the Industrial IoT Display market based on technology, panel size, application, end-use industry, and region.

Industrial IoT Display Market Share & Segments :

Based on Technology
  • TFT-LCD
  • LED
  • OLED
  • E-Paper display
Based on Panel Size
  • Less than 10”
  • Between 10”and 20”
  • More than 20”
Based on Application
Based on End-Use Industry
  • Manufacturing
  • Healthcare
  • Energy & Power
  • Transportation
  • Others (Oil & Gas and Mining)
Industrial loT Display Market Size, Based on Region
  • North America
    • US
    • Canada
    • Mexico
  • Europe
    • UK
    • Germany
    • France
    • Rest of Europe
  • Asia Pacific
    • China
    • Japan
    • South Korea
    • Taiwan
    • Rest of Asia Pacific
  • Rest of the World
    • Middle East
    • Africa
    • South America

Recent Developments in Industrial IoT Display Industry :

  • In September 2022, Advantech Co., Ltd. introduced two new UTC-500 series products: the UTC-515I and 520I. They are all-in-one touch PCs with 15.6-inch and 21.5-inch screens, new platform technology, and improved serviceability. The fanless cooling architecture of the UTC-515I/520I enables the system to endure deployment in tough ambient circumstances while also extending the product lifespan by eliminating dust and debris collection inside the system. To fulfill the needs of industrial and commercial situations, its IP65-certified front panel protects against water and dust.
  • In September 2022, Planar launched a fine pitch, high brightness outdoor LED video wall optimized for up close viewing to its range of outdoor fine pitch LED display solutions. The coated LEDs of the Planar Luminate Ultra Series LED video wall display provide robustness and high image detail in high-ambient light conditions.
  • In September 2022, 2021, Planar launched a fine pitch, high brightness outdoor LED video wall optimized for up close viewing to its range of outdoor fine pitch LED display solutions. The coated LEDs of the Planar Luminate Ultra Series LED video wall display provide robustness and high image detail in high-ambient light conditions.

Frequently Asked Questions (FAQ):

To speak to our analyst for a discussion on the above findings, click Speak to Analyst

Exclusive indicates content/data unique to MarketsandMarkets and not available with any competitors.

TABLE OF CONTENTS
 
1 INTRODUCTION (Page No. - 30)
    1.1 STUDY OBJECTIVES 
    1.2 MARKET DEFINITION 
           1.2.1 INCLUSIONS AND EXCLUSIONS
    1.3 STUDY SCOPE 
           1.3.1 MARKETS COVERED
                    FIGURE 1 INDUSTRIAL IOT DISPLAY MARKET SEGMENTATION
           1.3.2 REGIONAL SCOPE
           1.3.3 YEARS CONSIDERED
    1.4 CURRENCY 
    1.5 UNITS CONSIDERED 
    1.6 LIMITATIONS 
    1.7 STAKEHOLDERS 
 
2 RESEARCH METHODOLOGY (Page No. - 34)
    2.1 RESEARCH DATA 
           FIGURE 2 INDUSTRIAL IOT DISPLAY MARKET: RESEARCH DESIGN
           2.1.1 SECONDARY AND PRIMARY RESEARCH
           2.1.2 SECONDARY DATA
                    2.1.2.1 List of key secondary sources
                    2.1.2.2 Key data from secondary sources
           2.1.3 PRIMARY DATA
                    2.1.3.1 Breakdown of primary interviews
                               FIGURE 3 BREAKDOWN OF PRIMARIES
                    2.1.3.2 List of key primary interview participants
                    2.1.3.3 Key data from primary sources
                    2.1.3.4 Key industry insights
    2.2 FACTOR ANALYSIS 
           2.2.1 SUPPLY-SIDE ANALYSIS
                    FIGURE 4 MARKET SIZE ESTIMATION METHODOLOGY: APPROACH 1 (SUPPLY-SIDE ANALYSIS) – REVENUE GENERATED BY COMPANIES FROM SALES OF PRODUCTS OFFERED IN INDUSTRIAL IOT DISPLAY MARKET
           2.2.2 DEMAND-SIDE ANALYSIS
                    FIGURE 5 MARKET SIZE ESTIMATION METHODOLOGY: APPROACH 2  (DEMAND-SIDE ANALYSIS)
    2.3 MARKET SIZE ESTIMATION 
           FIGURE 6 MARKET SIZE ESTIMATION METHODOLOGY: SUPPLY-SIDE ANALYSIS
           2.3.1 BOTTOM-UP APPROACH
                    FIGURE 7 MARKET SIZE ESTIMATION METHODOLOGY: BOTTOM-UP APPROACH
           2.3.2 TOP-DOWN APPROACH
                    FIGURE 8 MARKET SIZE ESTIMATION METHODOLOGY: TOP-DOWN APPROACH
           2.3.3 GROWTH PROJECTIONS AND FORECAST ASSUMPTIONS
                    TABLE 1 MARKET GROWTH ASSUMPTIONS
    2.4 MARKET BREAKDOWN AND DATA TRIANGULATION 
           FIGURE 9 INDUSTRIAL IOT DISPLAY MARKET: DATA TRIANGULATION
    2.5 ASSUMPTIONS 
           TABLE 2 KEY ASSUMPTIONS: MACROECONOMIC AND MICROECONOMIC ENVIRONMENT
    2.6 RECESSION IMPACT 
           TABLE 3 RECESSION IMPACT
    2.7 RISK ASSESSMENT 
           TABLE 4 INDUSTRIAL IOT DISPLAY MARKET
 
3 EXECUTIVE SUMMARY (Page No. - 48)
    3.1 INDUSTRIAL IOT DISPLAY MARKET: RECESSION IMPACT 
           FIGURE 10 RECESSION IMPACT: GDP GROWTH PROJECTION TILL 2023 FOR MAJOR ECONOMIES
           FIGURE 11 RECESSION IMPACT ON MARKET,  2019–2028 (USD MILLION)
           FIGURE 12 TFT-LCD TECHNOLOGY SEGMENT TO ACCOUNT FOR LARGEST SHARE OF INDUSTRIAL IOT DISPLAY MARKET IN 2028
           FIGURE 13 MORE THAN 20” SEGMENT TO ACCOUNT FOR LARGEST SHARE OF MARKET
           FIGURE 14 INTERACTIVE DISPLAYS SEGMENT TO DRIVE MARKET IN FORECAST PERIOD
           FIGURE 15 HEALTHCARE SEGMENT TO RECORD HIGHEST CAGR IN MARKET FROM 2023 TO 2028
           FIGURE 16 ASIA PACIFIC TO BE FASTEST-GROWING MARKET DURING FORECAST PERIOD
 
4 PREMIUM INSIGHTS (Page No. - 53)
    4.1 ATTRACTIVE GROWTH OPPORTUNITIES IN  INDUSTRIAL IOT DISPLAY MARKET 
           FIGURE 17 EMPHASIS ON REAL-TIME DATA ANALYSIS AND PREDICTIVE MAINTENANCE TO FUEL MARKET GROWTH DURING FORECAST PERIOD
    4.2 MARKET, BY TECHNOLOGY 
           FIGURE 18 OLED TO GROW AT HIGHEST CAGR DURING FORECAST PERIOD
    4.3 MARKET, BY PANEL SIZE 
           FIGURE 19 MORE THAN 20” TO RECORD HIGHEST CAGR DURING FORECAST PERIOD
    4.4 MARKET, BY APPLICATION 
           FIGURE 20 INTERACTIVE DISPLAYS TO BE LARGEST SEGMENT OF MARKET BY 2028
    4.5 MARKET, BY END-USE INDUSTRY 
           FIGURE 21 TRANSPORTATION TO BE LARGEST SEGMENT OFMARKET BETWEEN 2023 AND 2028
    4.6 MARKET, BY COUNTRY 
           FIGURE 22 MEXICO TO WITNESS HIGHEST CAGR DURING FORECAST PERIOD
    4.7 MARKET, BY REGION 
           FIGURE 23 NORTH AMERICA TO ACCOUNT FOR LARGEST SHARE OF INDUSTRIAL IOT DISPLAY MARKET BY 2028
 
5 MARKET OVERVIEW (Page No. - 57)
    5.1 INTRODUCTION 
    5.2 MARKET DYNAMICS 
           FIGURE 24 DRIVERS, RESTRAINTS, OPPORTUNITIES,  AND CHALLENGES IN  MARKET
           5.2.1 DRIVERS
                    5.2.1.1 Growing adoption of IoT
                    5.2.1.2 Increasing demand for HMI devices
                    5.2.1.3 Rising emphasis on real-time data analysis and predictive maintenance
                    5.2.1.4 Growing adoption of Industry 4.0
                               FIGURE 25 DRIVERS AND THEIR IMPACT ON  MARKET
           5.2.2 RESTRAINTS
                    5.2.2.1 Higher cost of industrial IoT displays than traditional whiteboards
                    5.2.2.2 High installation and maintenance costs
                    5.2.2.3 Requirement of maintenance and frequent software upgrades
                               FIGURE 26 RESTRAINTS AND THEIR IMPACT ON  MARKET
           5.2.3 OPPORTUNITIES
                    5.2.3.1 Growing demand for digital signage in industries
                    5.2.3.2 Integration of advanced technologies with displays
                    5.2.3.3 Increasing demand for safety compliance automation solutions
                               FIGURE 27 OPPORTUNITIES AND THEIR IMPACT ON  MARKET
           5.2.4 CHALLENGES
                    5.2.4.1 Increasing security risks associated with cloud–HMI platform
                               FIGURE 28 CHALLENGES AND THEIR IMPACT ON  MARKET
    5.3 SUPPLY CHAIN ANALYSIS 
           FIGURE 29 INDUSTRIAL IOT DISPLAY MARKET: SUPPLY CHAIN ANALYSIS
    5.4 ECOSYSTEM MAPPING 
           TABLE 5 MARKET: ECOSYSTEM MAPPING
           FIGURE 30  MARKET: ECOSYSTEM MAPPING
    5.5 AVERAGE SELLING PRICE OF KEY PLAYERS, BY APPLICATION 
           5.5.1 AVERAGE SELLING PRICE TRENDS
                    TABLE 6 AVERAGE SELLING PRICE FOR INDUSTRIAL IOT DISPLAY APPLICATIONS (USD THOUSAND)
           FIGURE 31 AVERAGE SELLING PRICE TREND: INDUSTRIAL IOT DISPLAY HARDWARE OFFERINGS
    5.6 TRENDS AND DISRUPTIONS IMPACTING CUSTOMER BUSINESS 
           5.6.1 REVENUE SHIFT AND NEW REVENUE POCKETS FOR MARKET PLAYERS
                    FIGURE 32 REVENUE SHIFT IN INDUSTRIAL IOT DISPLAY MARKET
    5.7 KEY TECHNOLOGY TRENDS 
           5.7.1 ARTIFICIAL INTELLIGENCE (AI)
           5.7.2 BLOCKCHAIN
           5.7.3 AUGMENTED REALITY (AR) AND VIRTUAL REALITY (VR)
           5.7.4 COLLABORATIVE ROBOTS
           5.7.5 PREDICTIVE MAINTENANCE
           5.7.6 DIGITAL TWIN
    5.8 COMMUNICATION PROTOCOLS 
           5.8.1 FIELDBUS
                    5.8.1.1 Profibus
                    5.8.1.2 Modbus
                    5.8.1.3 CC-Link
                    5.8.1.4 DeviceNet
                    5.8.1.5 CANopen
                    5.8.1.6 Others
           5.8.2 INDUSTRIAL ETHERNET
                    5.8.2.1 PROFINET
                    5.8.2.2 Ethernet/IP
                    5.8.2.3 EtherCAT
                    5.8.2.4 Modbus TCP
                    5.8.2.5 POWERLINK
                    5.8.2.6 Sercos III
                    5.8.2.7 CC-Link IE
           5.8.3 WIRELESS
                    5.8.3.1 NB-IoT
                    5.8.3.2 Bluetooth
                    5.8.3.3 LoRaWAN
                    5.8.3.4 WLAN
                    5.8.3.5 ISA100.11A
                    5.8.3.6 Cellular
                    5.8.3.7 Zigbee
                    5.8.3.8 WHART
                    5.8.3.9 Others (DNP, WiMAX, IEC 60870-5)
    5.9 PORTER’S FIVE FORCES ANALYSIS 
           TABLE 7 IMPACT OF PORTER’S FIVE FORCES ON INDUSTRIAL IOT DISPLAY MARKET
           FIGURE 33 PORTER’S FIVE FORCES ANALYSIS OF  MARKET
           5.9.1 THREAT OF NEW ENTRANTS
           5.9.2 THREAT OF SUBSTITUTES
           5.9.3 BARGAINING POWER OF SUPPLIERS
           5.9.4 BARGAINING POWER OF BUYERS
           5.9.5 INTENSITY OF COMPETITIVE RIVALRY
    5.10 KEY STAKEHOLDERS AND BUYING CRITERIA 
           5.10.1 INFLUENCE OF KEY STAKEHOLDERS ON BUYING PROCESS
                    FIGURE 34 INFLUENCE OF KEY STAKEHOLDERS ON BUYING PROCESS FOR TOP 3 VERTICALS
                    TABLE 8 INFLUENCE OF KEY STAKEHOLDERS ON BUYING PROCESS FOR TOP 3 VERTICALS (%)
           5.10.2 BUYING CRITERIA
                    FIGURE 35 KEY BUYING CRITERIA FOR TOP 3 VERTICALS
                    TABLE 9 KEY BUYING CRITERIA FOR TOP 3 VERTICALS
    5.11 CASE STUDY ANALYSIS 
           5.11.1 EFFECTIVE USE OF INDUSTRIAL IOT DISPLAY GRADUALLY IMPROVED HONEYWELL’S INITIAL MANAGEMENT MODEL
           5.11.2 HMI UPGRADE HELPED NATIONAL FROZEN FOODS ACHIEVE HIGH PRODUCTION RATES AND EFFICIENCY
    5.12 TRADE ANALYSIS 
           5.12.1 IMPORT SCENARIO
                    TABLE 10 IMPORT DATA, BY COUNTRY, 2017–2021 (USD MILLION)
           5.12.2 EXPORT SCENARIO
                    TABLE 11 EXPORT DATA, BY COUNTRY, 2017–2021 (USD MILLION)
    5.13 PATENT ANALYSIS, 2012–2022 
                    FIGURE 36 NUMBER OF PATENTS GRANTED FOR INDUSTRIAL IOT DISPLAY PRODUCTS, 2012–2022
                    FIGURE 37 REGIONAL ANALYSIS OF PATENTS GRANTED FOR INDUSTRIAL IOT DISPLAY PRODUCTS, 2021
                    TABLE 12 TOP 20 PATENT OWNERS
                    TABLE 13 PATENTS PERTAINING TO INDUSTRIAL IOT DISPLAY, 2020–2021
    5.14 KEY CONFERENCES AND EVENTS, 2023–2024 
                    TABLE 14 INDUSTRIAL IOT DISPLAY MARKET: LIST OF KEY CONFERENCES, 2023–2024
    5.15 TARIFF ANALYSIS 
                    TABLE 15 MFN TARIFF FOR HS CODE 8486-COMPLIANT PRODUCTS EXPORTED BY INDIA
                    TABLE 16 MFN TARIFF FOR HS CODE 8486-COMPLIANT PRODUCTS EXPORTED BY CHINA
                    TABLE 17 MFN TARIFF FOR HS CODE 8486-COMPLIANT PRODUCTS EXPORTED BY BRAZIL
    5.16 STANDARD AND REGULATORY LANDSCAPE 
           5.16.1 REGULATORY BODIES, GOVERNMENT AGENCIES, AND OTHER ORGANIZATIONS
                    TABLE 18 NORTH AMERICA: REGULATORY BODIES, GOVERNMENT AGENCIES, AND OTHER ORGANIZATIONS
                    TABLE 19 EUROPE: REGULATORY BODIES, GOVERNMENT AGENCIES, AND OTHER ORGANIZATIONS
                    TABLE 20 ASIA PACIFIC: REGULATORY BODIES, GOVERNMENT AGENCIES, AND OTHER ORGANIZATIONS
                    TABLE 21 ROW: REGULATORY BODIES, GOVERNMENT AGENCIES, AND OTHER ORGANIZATIONS
           5.16.2 REGULATORY STANDARDS
           5.16.3 GOVERNMENT REGULATIONS
                    5.16.3.1 China
                    5.16.3.2 US
                    5.16.3.3 Singapore
                    5.16.3.4 India
 
6 INDUSTRIAL IOT DISPLAY MARKET, BY TECHNOLOGY (Page No. - 95)
    6.1 INTRODUCTION 
           FIGURE 38 MARKET, BY TECHNOLOGY
           FIGURE 39 OLED SEGMENT TO RECORD HIGHEST CAGR IN IMARKET FROM 2023 TO 2028
           TABLE 22 MARKET, BY TECHNOLOGY, 2019–2022 (USD MILLION)
           TABLE 23 MARKET, BY TECHNOLOGY, 2023–2028 (USD MILLION)
    6.2 TFT-LCD 
           6.2.1 AFFORDABILITY, RELIABILITY, AND EXCELLENT VISUAL PERFORMANCE TO BOLSTER TFT-LCD’S MARKET SHARE
                    TABLE 24 MARKET FOR TFT-LCD, BY APPLICATION,  2019–2022 (USD MILLION)
                    TABLE 25 MARKET FOR TFT-LCD, BY APPLICATION,  2023–2028 (USD MILLION)
    6.3 LED 
           6.3.1 DEMAND FOR LED DISPLAYS IN DIGITAL SIGNAGE, VEHICLES, PUBLIC TRANSPORT, PC MONITORS, AND LAPTOPS TO DRIVE DEMAND
                    TABLE 26 INDUSTRIAL IOT DISPLAY MARKET FOR LED, BY APPLICATION,  2019–2022 (USD MILLION)
                    TABLE 27 MARKET FOR LED, BY APPLICATION,  2023–2028 (USD MILLION)
    6.4 OLED 
           6.4.1 EMISSIVE NATURE OF OLED DISPLAYS TO FACILITATE BETTER CONTRAST, CLARITY, AND IMAGES WITH SUPERIOR PICTURE AND MOTION QUALITY
                    TABLE 28 MARKET FOR OLED, BY APPLICATION,  2019–2022 (USD MILLION)
                    TABLE 29 MARKET FOR OLED, BY APPLICATION,  2023–2028 (USD MILLION)
    6.5 OTHERS (E-PAPER DISPLAY) 
           TABLE 30 MARKET FOR OTHERS, BY APPLICATION,  2019–2022 (USD MILLION)
           TABLE 31 MARKET FOR OTHERS, BY APPLICATION,  2023–2028 (USD MILLION)
 
7 INDUSTRIAL IOT DISPLAY MARKET, BY PANEL SIZE (Page No. - 103)
    7.1 INTRODUCTION 
           FIGURE 40 MARKET, BY PANEL SIZE
           FIGURE 41 MORE THAN 20” SEGMENT TO RECORD HIGHEST CAGR IN MARKET FROM 2023 TO 2028
           TABLE 32 MARKET, BY PANEL SIZE, 2019–2022 (USD MILLION)
           TABLE 33 MARKET, BY PANEL SIZE, 2023–2028 (USD MILLION)
    7.2 LESS THAN 10” 
           7.2.1 HIGHER RESOLUTION AND BETTER COLORS DUE TO TECHNOLOGICAL ADVANCEMENTS TO DRIVE SEGMENT
    7.3 BETWEEN 10” AND 20” 
           7.3.1 MULTIPLE EFFECTIVE FEATURES TO BOOST ADOPTION OF DISPLAYS BETWEEN 10” AND 20” PANEL SIZE
    7.4 MORE THAN 20” 
           7.4.1 HEALTHCARE AND HOSPITALITY SECTORS TO INCREASE DEMAND
 
8 INDUSTRIAL IOT DISPLAY MARKET, BY APPLICATION (Page No. - 107)
    8.1 INTRODUCTION 
           FIGURE 42  MARKET, BY APPLICATION
           FIGURE 43 INTERACTIVE DISPLAYS SEGMENT TO RECORD HIGHEST CAGR IN INDUSTRIAL IOT DISPLAY MARKET FROM 2023 TO 2028
           TABLE 34 MARKET, BY APPLICATION, 2019–2022 (USD MILLION)
           TABLE 35 MARKET, BY APPLICATION, 2023–2028 (USD MILLION)
           TABLE 36 MARKET, BY APPLICATION, 2019–2022 (THOUSAND UNITS)
           TABLE 37 MARKET, BY APPLICATION, 2023–2028 (THOUSAND UNITS)
    8.2 HUMAN-MACHINE INTERFACE (HMI) 
           8.2.1 SIGNIFICANT USAGE IN INDUSTRIAL AREAS TO BOOST DEMAND FOR HMI
                    TABLE 38 MARKET FOR HMI, BY TECHNOLOGY,  2019–2022 (USD MILLION)
                    TABLE 39 MARKET FOR HMI, BY TECHNOLOGY,  2023–2028 (USD MILLION)
                    TABLE 40 MARKET FOR HMI, BY END-USE INDUSTRY,  2019–2022 (USD MILLION)
                    TABLE 41 MARKET FOR HMI, BY END-USE INDUSTRY,  2023–2028 (USD MILLION)
    8.3 REMOTE MONITORING 
           8.3.1 EFFECTIVE REAL-TIME DATA ANALYTICS THROUGH REMOTE MONITORING TO HELP EXTRACT INSIGHTS
                    TABLE 42 MARKET FOR REMOTE MONITORING, BY TECHNOLOGY,  2019–2022 (USD MILLION)
                    TABLE 43 MARKET FOR REMOTE MONITORING, BY TECHNOLOGY,  2023–2028 (USD MILLION)
                    TABLE 44 MARKET FOR REMOTE MONITORING, BY END-USE INDUSTRY, 2019–2022 (USD MILLION)
                    TABLE 45 MARKET FOR REMOTE MONITORING, BY END-USE INDUSTRY, 2023–2028 (USD MILLION)
    8.4 INTERACTIVE DISPLAYS 
           8.4.1 USER-FRIENDLY FEATURES OF INTERACTIVE DISPLAYS TO BOOST DEMAND
                    TABLE 46 MARKET FOR INTERACTIVE DISPLAYS, BY TECHNOLOGY,  2019–2022 (USD MILLION)
                    TABLE 47 MARKET FOR INTERACTIVE DISPLAYS, BY TECHNOLOGY,  2023–2028 (USD MILLION)
                    TABLE 48 MARKET FOR INTERACTIVE DISPLAYS, BY END-USE INDUSTRY, 2019–2022 (USD MILLION)
                    TABLE 49 MARKET FOR INTERACTIVE DISPLAYS, BY END-USE INDUSTRY, 2023–2028 (USD MILLION)
    8.5 ELECTRONIC SHELF LABELS (ESL) 
           8.5.1 HIGH EFFICIENCY AND VALUE ADDITION BY ESL TO SURGE DEMAND
                    TABLE 50 MARKET FOR ELECTRONIC SHELF LABELS, BY TECHNOLOGY, 2019–2022 (USD MILLION)
                    TABLE 51 MARKET FOR ELECTRONIC SHELF LABELS, BY TECHNOLOGY, 2023–2028 (USD MILLION)
                    TABLE 52 MARKET FOR ELECTRONIC SHELF LABELS, BY END-USE INDUSTRY, 2019–2022 (USD MILLION)
                    TABLE 53 MARKET FOR ELECTRONIC SHELF LABELS, BY END-USE INDUSTRY, 2023–2028 (USD MILLION)
    8.6 OTHERS 
           TABLE 54 MARKET FOR OTHERS, BY TECHNOLOGY,  2019–2022 (USD MILLION)
           TABLE 55 MARKET FOR OTHERS, BY TECHNOLOGY,  2023–2028 (USD MILLION)
           TABLE 56 MARKET FOR OTHERS, BY END-USE INDUSTRY,  2019–2022 (USD MILLION)
           TABLE 57  MARKET FOR OTHERS, BY END-USE INDUSTRY,  2023–2028 (USD MILLION)
 
9 INDUSTRIAL IOT DISPLAY MARKET, BY END-USE INDUSTRY (Page No. - 120)
    9.1 INTRODUCTION 
           FIGURE 44 MARKET, BY END-USE INDUSTRY
           FIGURE 45 HEALTHCARE SEGMENT TO RECORD HIGHEST CAGR IN INDUSTRIAL IOT DISPLAY MARKET FROM 2023 TO 2028
           TABLE 58 MARKET, BY END-USE INDUSTRY, 2019–2022 (USD MILLION)
           TABLE 59 MARKET, BY END-USE INDUSTRY, 2023–2028 (USD MILLION)
    9.2 MANUFACTURING 
           9.2.1 GROWTH OF SMART MANUFACTURING TO INCREASE DEMAND FOR INDUSTRIAL IOT DISPLAYS
                    TABLE 60 MANUFACTURING: MARKET, BY APPLICATION,  2019–2022 (USD MILLION)
                    TABLE 61 MANUFACTURING: MARKET, BY APPLICATION,  2023–2028 (USD MILLION)
                    TABLE 62 MANUFACTURING: MARKET, BY REGION,  2019–2022 (USD MILLION)
                    TABLE 63 MANUFACTURING: MARKET, BY REGION,  2023–2028 (USD MILLION)
                    TABLE 64 NORTH AMERICA: MARKET FOR MANUFACTURING,  BY COUNTRY, 2019–2022 (USD MILLION)
                    TABLE 65 NORTH AMERICA: MARKET FOR MANUFACTURING,  BY COUNTRY, 2023–2028 (USD MILLION)
                    TABLE 66 EUROPE: MARKET FOR MANUFACTURING, BY COUNTRY,  2019–2022 (USD MILLION)
                    TABLE 67 EUROPE: MARKET FOR MANUFACTURING, BY COUNTRY,  2023–2028 (USD MILLION)
                    TABLE 68 ASIA PACIFIC: MARKET FOR MANUFACTURING, BY COUNTRY, 2019–2022 (USD MILLION)
                    TABLE 69 ASIA PACIFIC: MARKET FOR MANUFACTURING, BY COUNTRY, 2023–2028 (USD MILLION)
                    TABLE 70 ROW: MARKET FOR MANUFACTURING, BY COUNTRY,  2019–2022 (USD MILLION)
                    TABLE 71 ROW: MARKET FOR MANUFACTURING, BY COUNTRY,  2023–2028 (USD MILLION)
    9.3 HEALTHCARE 
           9.3.1 HEALTHCARE SEGMENT TO RECORD HIGHEST CAGR
                    TABLE 72 HEALTHCARE: INDUSTRIAL IOT DISPLAY MARKET, BY APPLICATION,  2019–2022 (USD MILLION)
                    TABLE 73 HEALTHCARE: MARKET, BY APPLICATION,  2023–2028 (USD MILLION)
                    TABLE 74 HEALTHCARE: MARKET, BY REGION, 2019–2022 (USD MILLION)
                    TABLE 75 HEALTHCARE:  MARKET, BY REGION, 2023–2028 (USD MILLION)
                    TABLE 76 NORTH AMERICA: MARKET FOR HEALTHCARE, BY COUNTRY, 2019–2022 (USD MILLION)
                    TABLE 77 NORTH AMERICA: MARKET FOR HEALTHCARE, BY COUNTRY, 2023–2028 (USD MILLION)
                    TABLE 78 EUROPE: MARKET FOR HEALTHCARE, BY COUNTRY,  2019–2022 (USD MILLION)
                    TABLE 79 EUROPE: MARKET FOR HEALTHCARE, BY COUNTRY,  2023–2028 (USD MILLION)
                    TABLE 80 ASIA PACIFIC:MARKET FOR HEALTHCARE, BY COUNTRY,  2019–2022 (USD MILLION)
                    TABLE 81 ASIA PACIFIC: MARKET FOR HEALTHCARE, BY COUNTRY,  2023–2028 (USD MILLION)
                    TABLE 82 ROW: MARKET FOR HEALTHCARE, BY COUNTRY,  2019–2022 (USD MILLION)
                    TABLE 83 ROW: MARKET FOR HEALTHCARE, BY COUNTRY,  2023–2028 (USD MILLION)
    9.4 ENERGY AND POWER 
           9.4.1 RAPID INDUSTRIALIZATION, INFRASTRUCTURAL DEVELOPMENT, AND INTEGRATION OF ADVANCED TECHNOLOGIES TO BOOST DEMAND
                    TABLE 84 ENERGY & POWER: MARKET, BY APPLICATION,  2019–2022 (USD MILLION)
                    TABLE 85 ENERGY & POWER: MARKET, BY APPLICATION,  2023–2028 (USD MILLION)
                    TABLE 86 ENERGY & POWER: MARKET, BY REGION,  2019–2022 (USD MILLION)
                    TABLE 87 ENERGY & POWER: MARKET, BY REGION,  2023–2028 (USD MILLION)
                    TABLE 88 NORTH AMERICA: MARKET FOR ENERGY & POWER,  BY COUNTRY, 2019–2022 (USD MILLION)
                    TABLE 89 NORTH AMERICA:  MARKET FOR ENERGY & POWER,  BY COUNTRY, 2023–2028 (USD MILLION)
                    TABLE 90 EUROPE: MARKET FOR ENERGY & POWER, BY COUNTRY,  2019–2022 (USD MILLION)
                    TABLE 91 EUROPE: MARKET FOR ENERGY & POWER, BY COUNTRY,  2023–2028 (USD MILLION)
                    TABLE 92 ASIA PACIFIC: MARKET FOR ENERGY & POWER, BY COUNTRY, 2019–2022 (USD MILLION)
                    TABLE 93 ASIA PACIFIC:  MARKET FOR ENERGY & POWER, BY COUNTRY, 2023–2028 (USD MILLION)
                    TABLE 94 ROW: MARKET FOR ENERGY & POWER, BY COUNTRY,  2019–2022 (USD MILLION)
                    TABLE 95 ROW: MARKET FOR ENERGY & POWER, BY COUNTRY,  2023–2028 (USD MILLION)
    9.5 TRANSPORTATION 
           9.5.1 TRANSPORTATION SEGMENT TO CREATE SIGNIFICANT DEMAND FOR INDUSTRIAL IOT DISPLAYS
                    TABLE 96 TRANSPORTATION: MARKET, BY APPLICATION,  2019–2022 (USD MILLION)
                    TABLE 97 TRANSPORTATION: MARKET, BY APPLICATION,  2023–2028 (USD MILLION)
                    TABLE 98 TRANSPORTATION: MARKET, BY REGION,  2019–2022 (USD MILLION)
                    TABLE 99 TRANSPORTATION: MARKET, BY REGION,  2023–2028 (USD MILLION)
                    TABLE 100 NORTH AMERICA: MARKET FOR TRANSPORTATION,  BY COUNTRY, 2019–2022 (USD MILLION)
                    TABLE 101 NORTH AMERICA: MARKET FOR TRANSPORTATION,  BY COUNTRY, 2023–2028 (USD MILLION)
                    TABLE 102 EUROPE: MARKET FOR TRANSPORTATION, BY COUNTRY,  2019–2022 (USD MILLION)
                    TABLE 103 EUROPE: MARKET FOR TRANSPORTATION, BY COUNTRY,  2023–2028 (USD MILLION)
                    TABLE 104 ASIA PACIFIC: MARKET FOR TRANSPORTATION, BY COUNTRY, 2019–2022 (USD MILLION)
                    TABLE 105 ASIA PACIFIC: MARKET FOR TRANSPORTATION, BY COUNTRY, 2023–2028 (USD MILLION)
                    TABLE 106 ROW:  MARKET FOR TRANSPORTATION, BY REGION,  2019–2022 (USD MILLION)
                    TABLE 107 ROW: INDUSTRIAL IOT DISPLAY MARKET FOR TRANSPORTATION, BY REGION,  2023–2028 (USD MILLION)
    9.6 OTHERS (OIL & GAS AND MINING) 
           TABLE 108 OTHERS: MARKET, BY APPLICATION,  2019–2022 (USD MILLION)
           TABLE 109 OTHERS: MARKET, BY APPLICATION,  2023–2028 (USD MILLION)
           TABLE 110 OTHERS: MARKET, BY REGION, 2019–2022 (USD MILLION)
           TABLE 111 OTHERS: IMARKET, BY REGION, 2023–2028 (USD MILLION)
           TABLE 112 NORTH AMERICA:  MARKET FOR OTHERS, BY COUNTRY,  2019–2022 (USD MILLION)
           TABLE 113 NORTH AMERICA: MARKET FOR OTHERS, BY COUNTRY,  2023–2028 (USD MILLION)
           TABLE 114 EUROPE: MARKET FOR OTHERS, BY COUNTRY,  2019–2022 (USD MILLION)
           TABLE 115 EUROPE: MARKET FOR OTHERS, BY COUNTRY,  2023–2028 (USD MILLION)
           TABLE 116 ASIA PACIFIC: MARKET FOR OTHERS, BY COUNTRY,  2019–2022 (USD MILLION)
           TABLE 117 ASIA PACIFIC: MARKET FOR OTHERS, BY COUNTRY,  2023–2028 (USD MILLION)
           TABLE 118 ROW: MARKET FOR OTHERS, BY COUNTRY,  2019–2022 (USD MILLION)
           TABLE 119 ROW: MARKET FOR OTHERS, BY COUNTRY,  2023–2028 (USD MILLION)
 
10 INDUSTRIAL IOT DISPLAY MARKET, BY REGION (Page No. - 143)
     10.1 INTRODUCTION 
               FIGURE 46 MARKET, BY REGION
               FIGURE 47 ASIA PACIFIC TO RECORD HIGHEST CAGR IN MARKET FROM 2023 TO 2028
               TABLE 120 MARKET, BY REGION, 2019–2022 (USD MILLION)
               TABLE 121 MARKET, BY REGION, 2023–2028 (USD MILLION)
     10.2 NORTH AMERICA 
               FIGURE 48 NORTH AMERICA: SNAPSHOT OF MARKET
               TABLE 122 NORTH AMERICA: MARKET, BY COUNTRY,  2019–2022 (USD MILLION)
               TABLE 123 NORTH AMERICA: MARKET, BY COUNTRY,  2023–2028 (USD MILLION)
               TABLE 124 NORTH AMERICA: MARKET, BY END-USE INDUSTRY,  2019–2022 (USD MILLION)
               TABLE 125 NORTH AMERICA: MARKET, BY END-USE INDUSTRY,  2023–2028 (USD MILLION)
             10.2.1 US
                       10.2.1.1 High demand for smart manufacturing to bolster market growth
             10.2.2 CANADA
                       10.2.2.1 Tremendous growth in various sectors to boost market growth
             10.2.3 MEXICO
                       10.2.3.1 Increasing awareness of smart manufacturing to boost demand for industrial IoT displays
     10.3 EUROPE 
               FIGURE 49 EUROPE: SNAPSHOT OF  MARKET
               TABLE 126 EUROPE: MARKET, BY COUNTRY, 2019–2022 (USD MILLION)
               TABLE 127 EUROPE: MARKET, BY COUNTRY, 2023–2028 (USD MILLION)
               TABLE 128 EUROPE: MARKET, BY END-USE INDUSTRY,  2019–2022 (USD MILLION)
               TABLE 129 EUROPE: MARKET, BY END-USE INDUSTRY,  2023–2028 (USD MILLION)
             10.3.1 UK
                       10.3.1.1 Growing industrial automation to support market growth
             10.3.2 GERMANY
                       10.3.2.1 Automotive and manufacturing industries to lead industrial IoT adoption
             10.3.3 FRANCE
                       10.3.3.1 Smart manufacturing to help adoption of industrial IoT
             10.3.4 REST OF EUROPE
     10.4 ASIA PACIFIC 
               FIGURE 50 ASIA PACIFIC: SNAPSHOT OF INDUSTRIAL IOT DISPLAY MARKET
               TABLE 130 ASIA PACIFIC:  MARKET, BY COUNTRY,  2019–2022 (USD MILLION)
               TABLE 131 ASIA PACIFIC: MARKET, BY COUNTRY,  2023–2028 (USD MILLION)
               TABLE 132 ASIA PACIFIC: MARKET, BY END-USE INDUSTRY,  2019–2022 (USD MILLION)
               TABLE 133 ASIA PACIFIC: MARKET, BY END-USE INDUSTRY,  2023–2028 (USD MILLION)
             10.4.1 CHINA
                       10.4.1.1 5G to boost adoption of industrial IoT displays
             10.4.2 JAPAN
                       10.4.2.1 Growing manufacturing sector to propel market
             10.4.3 SOUTH KOREA
                       10.4.3.1 Tremendous adoption of industrial IoT displays in transportation to drive market
             10.4.4 REST OF ASIA PACIFIC
     10.5 REST OF THE WORLD (ROW) 
               TABLE 134 ROW: INDUSTRIAL IOT DISPLAY MARKET, BY COUNTRY, 2019–2022 (USD MILLION)
               TABLE 135 ROW: MARKET, BY COUNTRY, 2023–2028 (USD MILLION)
               TABLE 136 ROW: MARKET, BY END-USE INDUSTRY,  2019–2022 (USD MILLION)
               TABLE 137 ROW: MARKET, BY END-USE INDUSTRY,  2023–2028 (USD MILLION)
             10.5.1 MIDDLE EAST & AFRICA
                       10.5.1.1 Growing adoption of industrial IoT displays in oil & gas industry to drive market
             10.5.2 SOUTH AMERICA
                       10.5.2.1 Growing adoption of IoT technologies in different industries to drive market
 
11 COMPETITIVE LANDSCAPE (Page No. - 161)
     11.1 INDUSTRIAL IOT DISPLAY MARKET OVERVIEW 
     11.2 MARKET EVALUATION FRAMEWORK 
               TABLE 138 OVERVIEW OF STRATEGIES ADOPTED BY KEY INDUSTRIAL IOT DISPLAY COMPANIES
             11.2.1 PRODUCT PORTFOLIOS
             11.2.2 REGIONAL FOCUS
             11.2.3 MANUFACTURING FOOTPRINT
             11.2.4 ORGANIC/INORGANIC STRATEGIES
     11.3 MARKET SHARE ANALYSIS, 2021 
               TABLE 139 MARKET SHARE ANALYSIS (2021)
     11.4 FIVE-YEAR COMPANY REVENUE ANALYSIS 
               FIGURE 51 FIVE-YEAR REVENUE ANALYSIS OF TOP FIVE PLAYERS IN INDUSTRIAL IOT DISPLAY MARKET, 2017 TO 2021
     11.5 COMPANY EVALUATION QUADRANT 
             11.5.1 STARS
             11.5.2 EMERGING LEADERS
             11.5.3 PERVASIVE PLAYERS
             11.5.4 PARTICIPANTS
                       FIGURE 52 COMPANY EVALUATION QUADRANT, 2022
     11.6 COMPANY FOOTPRINT 
               TABLE 140 COMPANY FOOTPRINT
               TABLE 141 COMPANY-WISE TECHNOLOGY FOOTPRINT
               TABLE 142 COMPANY-WISE APPLICATION FOOTPRINT
               TABLE 143 COMPANY-WISE REGIONAL FOOTPRINT
     11.7 COMPETITIVE SCENARIOS 
             11.7.1 PRODUCT LAUNCHES
                       TABLE 144 PRODUCT LAUNCHES FROM DECEMBER 2020 TO JANUARY 2023
             11.7.2 DEALS
                       TABLE 145 DEALS FROM DECEMBER 2020 TO JANUARY 2023
 
12 COMPANY PROFILES (Page No. - 174)
(Business overview, Products/Solutions/Services offered, Recent Developments, MNM view)*
     12.1 KEY COMPANIES 
             12.1.1 E INK HOLDINGS INC.
                       TABLE 146 E INK HOLDINGS INC.: COMPANY OVERVIEW
                       FIGURE 53 E INK HOLDINGS INC.: COMPANY SNAPSHOT
                       TABLE 147 E INK HOLDINGS INC.: PRODUCTS/SOLUTIONS/SERVICES OFFERED
                       TABLE 148 E INK HOLDINGS INC.: PRODUCT LAUNCHES
                       TABLE 149 E INK HOLDINGS INC.: DEALS
                       TABLE 150 E INK HOLDINGS INC.: OTHER DEVELOPMENTS
             12.1.2 BOE TECHNOLOGY GROUP CO., LTD.
                       TABLE 151 BOE TECHNOLOGY GROUP CO., LTD.: COMPANY OVERVIEW
                       FIGURE 54 BOE TECHNOLOGY GROUP CO., LTD.: COMPANY SNAPSHOT
                       TABLE 152 BOE TECHNOLOGY GROUP CO., LTD.: PRODUCTS/SOLUTIONS/SERVICES OFFERED
             12.1.3 ADVANTECH CO., LTD.
                       TABLE 153 ADVANTECH CO., LTD.: COMPANY OVERVIEW
                       FIGURE 55 ADVANTECH CO., LTD.: COMPANY SNAPSHOT
                       TABLE 154 ADVANTECH CO., LTD.: PRODUCTS/SOLUTIONS/SERVICES OFFERED
                       TABLE 155 ADVANTECH CO., LTD.: PRODUCT LAUNCHES
             12.1.4 PEPPERL+FUCHS SE
                       TABLE 156 PEPPERL+FUCHS SE: COMPANY OVERVIEW
                       TABLE 157 PEPPERL+FUCHS SE: PRODUCTS/SOLUTIONS/SERVICES OFFERED
             12.1.5 SHARP CORPORATION
                       TABLE 158 SHARP CORPORATION: COMPANY OVERVIEW
                       FIGURE 56 SHARP CORPORATION: COMPANY SNAPSHOT
                       TABLE 159 SHARP CORPORATION: PRODUCTS/SOLUTIONS/SERVICES OFFERED
                       TABLE 160 SHARP CORPORATION: DEALS
             12.1.6 PDI DIGITAL
                       TABLE 161 PDI DIGITAL: COMPANY OVERVIEW
                       TABLE 162 PDI DIGITAL: PRODUCTS/SOLUTIONS/SERVICES OFFERED
             12.1.7 PLANAR SYSTEMS, INC.
                       TABLE 163 PLANAR SYSTEMS, INC.: COMPANY OVERVIEW
                       TABLE 164 PLANAR SYSTEMS, INC.: PRODUCTS/SOLUTIONS/SERVICES OFFERED
                       TABLE 165 PLANAR SYSTEMS, INC.: PRODUCT LAUNCHES
             12.1.8 WINMATE INC.
                       TABLE 166 WINMATE INC.: COMPANY OVERVIEW
                       FIGURE 57 WINMATE INC.: COMPANY SNAPSHOT
                       TABLE 167 WINMATE INC.: PRODUCTS/SOLUTIONS/SERVICES OFFERED
                       TABLE 168 WINMATE INC.: OTHER DEVELOPMENTS
             12.1.9 MAPLE SYSTEMS INC.
                       TABLE 169 MAPLE SYSTEMS INC.: COMPANY OVERVIEW
                       TABLE 170 MAPLE SYSTEMS INC.: PRODUCTS/SOLUTIONS/SERVICES OFFERED
             12.1.10 AMERICAN INDUSTRIAL SYSTEMS INC. (AIS)
                       TABLE 171 AMERICAN INDUSTRIAL SYSTEMS INC. (AIS): COMPANY OVERVIEW
                       TABLE 172 AMERICAN INDUSTRIAL SYSTEMS INC. (AIS): PRODUCTS/SOLUTIONS/SERVICES OFFERED
*Details on Business overview, Products/Solutions/Services offered, Recent Developments, MNM view might not be captured in case of unlisted companies.
     12.2 OTHER PLAYERS 
             12.2.1 PANASONIC CORPORATION
             12.2.2 INNOLUX CORPORATION
             12.2.3 DISPLAY TECHNOLOGY LTD.
             12.2.4 LG ELECTRONICS
             12.2.5 SAMSUNG ELECTRONICS CO., LTD.
             12.2.6 RIVERDI SP. Z O.O.
             12.2.7 MELROSE SYSTEMS
             12.2.8 DKE CO., LTD.
             12.2.9 GLIDE TECHNOLOGY PVT. LTD.
             12.2.10 SCHNEIDER ELECTRIC
             12.2.11 KINGTECH GROUP CO., LTD.
             12.2.12 CRYSTAL DISPLAY SYSTEMS
             12.2.13 PERVASIVE DISPLAYS, INC.
             12.2.14 EMSOL AUTOMATION PVT LTD
             12.2.15 SENECA S.R.L.
 
13 APPENDIX (Page No. - 209)
     13.1 DISCUSSION GUIDE 
     13.2 KNOWLEDGESTORE: MARKETSANDMARKETS’  SUBSCRIPTION PORTAL 
     13.3 CUSTOMIZATION OPTIONS 
     13.4 RELATED REPORTS 
     13.5 AUTHOR DETAILS 

The study involved four major activities in estimating the size of the Industrial IoT Display market size . Exhaustive secondary research has been carried out to collect information on the market, the peer markets, and the parent market. Both top-down and bottom-up approaches have been employed to estimate the total market size. Market breakdown and data triangulation methods have also been used to estimate the market for segments and subsegments.

Secondary Research

Revenues of companies offering Industrial IoT Display have been obtained from the secondary data available through paid and unpaid sources. The revenues have also been derived by analyzing the product portfolio of key companies, and these companies have been rated according to the performance and quality of their products.

In the secondary research process, various sources have been referred to for identifying and collecting information for this study on the Industrial IoT Display Industry . Secondary sources considered for this research study include government sources; corporate filings (such as annual reports, investor presentations, and financial statements); and trade, business, and professional associations. Secondary data has been collected and analyzed to arrive at the overall market size, which has been further validated through primary research.

Secondary research has been mainly used to obtain key information about the supply chain of Industrial IoT Displays to identify key players based on their products and prevailing industry trends in the Industrial IoT Display market share by panel size, technology, application, end-use industry, and region. Secondary research also helped obtain market information- and technology-oriented key developments undertaken by market players to expand their presence and increase their market share.

Primary Research

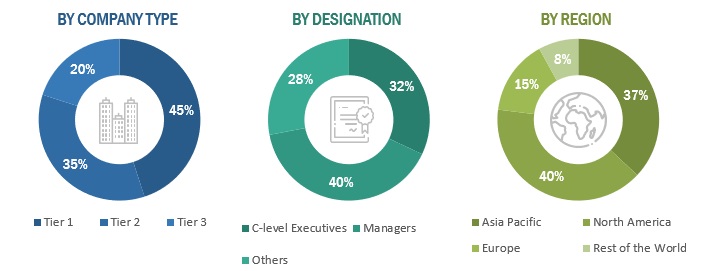
Extensive primary research has been conducted after understanding and analyzing the current scenario of the Industrial IoT Display Industry through secondary research. Several primary interviews have been conducted with the key opinion leaders from demand and supply sides across four main regions—North America, Europe, Asia Pacific, Rest of the World. Approximately 25% of the primary interviews have been conducted with the demand-side respondents, while approximately 75% have been conducted with the supply-side respondents. The primary data has been collected through questionnaires, emails, and telephonic interviews

After interacting with industry experts, brief sessions were conducted with highly experienced independent consultants to reinforce the findings from our primaries. This, along with the in-house subject matter experts’ opinions, has led us to the findings as described in the remainder of this report. The breakdown of primary respondents is as follows:
Industrial loT Display Market Size, and Share

To know about the assumptions considered for the study, download the pdf brochure

Market Size Estimation

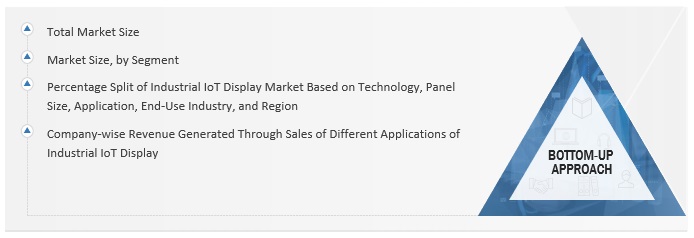
The bottom-up approach has been employed to arrive at the overall size of the Industrial IoT Display Industry trends from the revenue of key players and their market shares

  • Identifying the number of Industrial IoT Display shipped at the global level
  • Identifying average selling prices of Industrial IoT Display shipped globally
  • Conducting multiple discussion sessions with key opinion leaders to understand different Industrial IoT Display wafers and their deployment in applications; analyzing the break-up of the work carried out by each key company
  • Verifying and crosschecking estimates at every level with key opinion leaders, including chief executive officers (CEO), directors, and operation managers, and then finally with the domain experts of MarketsandMarkets
  • Studying various paid and unpaid sources of information, such as annual reports, press releases, white papers, and databases, of the company- and region-specific developments undertaken in the Industrial IoT Display Industry 
Industrial loT Display Market Size, and Share

To know about the assumptions considered for the study, Request for Free Sample Report

The top-down approach has been used to estimate and validate the total size of the Industrial IoT Display market share.

In the top-down approach, the overall size of the industrial IoT display market share has been used to estimate the size of the individual markets (mentioned in the market segmentation) through percentage splits obtained from secondary and primary research.

To analyze the size of specific market segments, the size of the most appropriate immediate parent market has been used to implement the top-down approach. The bottom-up approach has been implemented for the data extracted from the secondary research to validate the market size obtained.

Each company's market share has been estimated to verify the revenues used in the bottom-up approach earlier. The overall size of the parent and individual markets have been determined and confirmed in this study through the data triangulation method and data validation through primaries. The data triangulation method utilized in this study has been explained in the next section.

Industrial loT Display Market Size, and Share

Data Triangulation

After arriving at the overall market size through the process explained above, the overall market has been split into several segments. To complete the overall market engineering process and arrive at the exact statistics for all the segments, the market breakdown and data triangulation procedures have been employed, wherever applicable. The data has been triangulated by studying various factors and trends from both demand and supply sides. The market has also been validated using both top-down and bottom-up approaches.

Report Objectives

  • To describe and forecast the size of the industrial Internet of Things (IoT) display market based on technology, panel size, application, and end-use industry in terms of value
  • To describe and forecast the size of the market based on application in terms of value and volume
  • To describe and forecast the size of various segments of the market for four main regions: North America, Asia Pacific, Europe, and the Rest of the World (RoW), in terms of value
  • To provide detailed information regarding the drivers, restraints, opportunities, and challenges influencing market growth
  • To study the complete value chain and related industry segments and perform a value chain analysis of the market landscape
  • To strategically analyze micromarkets1 with respect to individual growth trends, prospects, and their contributions to the overall market
  • To analyze opportunities for the stakeholders by identifying high-growth segments in the market
  • To strategically profile the key players and provide a detailed competitive landscape of the market
  • To analyze strategic approaches adopted by the leading players in the market, including product launches/developments and acquisitions

Available customizations:

With the given market data, MarketsandMarkets offers customizations according to the specific requirements of companies. The following customization options are available for the report:

  • Detailed analysis and profiling of additional market players based on various blocks of the supply chain
Custom Market Research Services

We will customize the research for you, in case the report listed above does not meet with your exact requirements. Our custom research will comprehensively cover the business information you require to help you arrive at strategic and profitable business decisions.

Request Customization

Instant Answers with GPT - Ask Now!

Ask real questions. Get complete answers !
Report Code
SE 8582
Published ON
Feb, 2023
Choose License Type
BUY NOW
  • SHARE
X
Request Customization
Speak to Analyst
Speak to Analyst
OR FACE-TO-FACE MEETING
PERSONALIZE THIS RESEARCH
  • Triangulate with your Own Data
  • Get Data as per your Format and Definition
  • Gain a Deeper Dive on a Specific Application, Geography, Customer or Competitor
  • Any level of Personalization
REQUEST A FREE CUSTOMIZATION
LET US HELP YOU!
  • What are the Known and Unknown Adjacencies Impacting the Industrial IoT Display Market
  • What will your New Revenue Sources be?
  • Who will be your Top Customer; what will make them switch?
  • Defend your Market Share or Win Competitors
  • Get a Scorecard for Target Partners
CUSTOMIZED WORKSHOP REQUEST
knowledgestore logo

Want to explore hidden markets that can drive new revenue in Industrial IoT Display Market?

Find Hidden Markets
  • Call Us
  • +1-888-600-6441 (Corporate office hours)
  • +1-888-600-6441 (US/Can toll free)
  • +44-800-368-9399 (UK office hours)
CONNECT WITH US
ABOUT TRUST ONLINE
©2024 MarketsandMarkets Research Private Ltd. All rights reserved
DMCA.com Protection Status
Website Feedback