Rugged Display Market by Product (Smartphone & Handheld Computer, Tablet, Laptop, Mission-Critical Display, Avionic Display, Vehicle-Mounted), Size, Ruggedness, OS, Vertical (Govt., Defense, Aerospace, Industrial, Transportation) - Global Forecast to 2023


The rugged display market was valued at USD 7.03 billion in 2016 and is expected to reach USD 10.29 billion by 2023, growing at a CAGR of 5.92% between 2017 and 2023. The growth of the market is propelled by the increasing technological shift in the display technology and development of rugged display devices with high specifications, reduced total cost of ownership (TCO) offered by ruggedized products compared to consumer-grade devices in harsh environments, and rising demand for HMI and IoT in various industries. The base year considered is 2016, and the forecast period for the rugged display market has been considered between 2017 and 2023.
Market Dynamics
See how this study impacted revenues for other players in Rugged Display Market
Client’s Problem Statement
Our client, a top rugged pc provider globally, was keen to understand the business of rugged devices in utility sector for Europe. The client wanted to understand the top 10 companies operating in European countries across verticals such as telecom, water, and energy. Client was also keen on understanding the market landscape, major trends & challenges of European utility sector rugged devices.
MnM Approach
MnM assisted the client with an outside-in perspective on the market potential of various semi & fully rugged devices market across verticals in Europe. Further, MnM identified the utility market for various rugged devices such as smartphone, handheld, tablet and laptop with the help of interconnected market ecosystem & technology innovations such as 4G enabled handheld devices, cloud computing, real time operating system (RTOS), and satellite communications.
The same exercise was executed for different verticals such as telecom, water, energy ((oil & gas, electricity, renewables (wind, solar &hydro)) across European countries such as UK, Germany, France, Italy, Spain, Czech Republic, Poland and Hungary to help the client with better market intelligence and make strategic decisions.
Revenue Impact (RI)
Our work resulted in the client tapping into a $1Bn-$2Bn market, with a projected market potential of $500 Mn in 5 years from this strategy.
Reduced total cost of ownership (TCO) over a long period of time
The primary role of rugged devices is to offer reliability while reducing the redundancy that field workers encounter when collecting or entering workflow data in the computer. Many organizations use non-rugged or consumer-grade handheld devices in industrial environments. However, the implementation costs, replacement costs, ongoing support costs, device uptime, and service availability increase the TCO of non-rugged computing devices. The TCO of mobile computers can be calculated for a variety of applications. For instance, in an industrial environment, approximately 30% of the non-rugged devices are replaced within the first few years after implementation, and approximately 80% of these devices are replaced within five years of operation. Rugged devices have a roughly 60% lower failure rate than the non-ruggedized devices.
Companies deploy ruggedized display devices for operations in extremely harsh environments. Rugged devices are built to endure shock, vibration, extreme temperatures, and harsh weather conditions in which consumer-grade devices usually fail. Organizations utilizing rugged devices usually achieve greater ROI than those using consumer-grade devices in hazardous environments. The higher requirement of maintenance and replacement in case of non-rugged devices leads to increased downtime, loss of productivity, and need for training, which increases the overall total cost of ownership. Mobile computers can be broadly categorized into non-rugged, semi-rugged, and fully rugged based on the levels of ruggedness.
Objective of the study
- To define and describe the rugged display market and forecast the market size, in terms of value, on the basis of display size, operating system, level of ruggedness, product, and vertical
- To define, describe, and forecast the rugged display market size on the basis of product, in terms of volume
- To provide the market size estimation for the four main regions (along with countries), namely, North America, Europe, Asia Pacific, and Rest of the World
- To identify and analyze the major factors influencing the growth of the market (drivers, restraints, opportunities, and challenges)
- To analyze key trends related to the rugged display size, operating system, level of ruggedness, product, and vertical, which shape and influence the market
- To strategically analyze micromarkets with respect to individual growth trends, prospects, and contribution to the total market
- To analyze market opportunities for stakeholders and detail the competitive landscape for key players
- To analyze strategic developments such as joint ventures, mergers and acquisitions, expansions, product developments, and research and development in the rugged display market
- To strategically profile the key players and comprehensively analyze their market position in terms of their market ranking and core competencies, along with detailing the competitive leadership mapping for top 25 market players
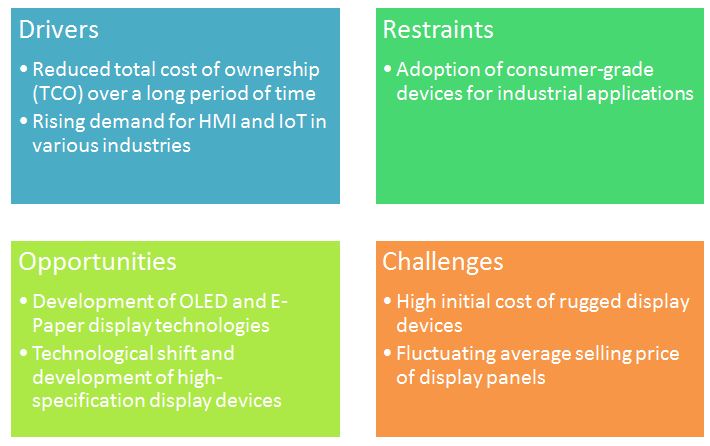
The rugged display market was valued at USD 7.03 billion in 2016 and is expected to reach USD 10.29 billion by 2023, at a CAGR of 5.92% between 2017 and 2023. The key drivers for the rugged display market include reduced total cost of ownership (TCO) offered by ruggedized products compared to consumer-grade devices in harsh environments and rising demand for HMI and IoT in various industries. Currently, the use of consumer-grade display devices in industrial applications is the main restraining factor for the growth of the market.
Rugged smartphones and handheld computers held the largest share of the rugged display market. Most government, defense, transportation, and industrial applications require display devices that are rugged and portable in nature. Smartphones and handheld computers are efficient alternatives to custom rugged display devices in such applications. Windows OS-based rugged devices are expected to dominate the rugged display market during the forecast period. Windows CE, Windows Embedded Handheld, and Windows 10 are widely used in rugged display devices. Because of their wide acceptance, these platforms have been launched with different versions and development tools. Windows CE offers a wide variety of configuration and application options supported by a large number of rugged device manufacturers and provides end users with a wider choice of service and solution support.
The rugged display market for the automotive & transportation vertical is expected to grow the highest between 2017 and 2023. Rugged displays enable paperless manufacturing plants to achieve faster and real-time data delivery, schedule parts delivery, and track quality. In transportation, tracking of goods is a complex job for the manager whether the good are on planes, trains, forklifts, tractor-trailers, or the warehouses. Rugged display devices such as mobile computers, tablets, and laptops can support the entire transportation fleet in real time while at the warehouse or in transit.
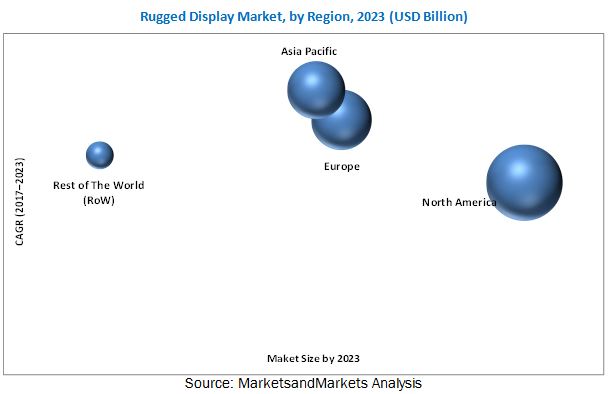
North America held the largest share in the rugged display market. The industrial manufacturers in North America emphasize on adopting advanced technologies to enhance their production processes and optimize output. In addition, government, defense, aerospace, automotive, and transportation industries are considered to be the fast growing end-user industries for rugged displays in the region. For instance, in December 2015, the U.S. Department of Transportation’s Federal Motor Carrier Safety Administration (FMCSA) regulated the use of electronic logging devices (ELDs) to improve roadway safety by employing advanced technology to strengthen commercial truck and bus drivers’ compliance with hours-of-service regulations to prevent fatigue.
The rugged display rugged display market is expected to witness the highest growth in APAC during the forecast period owing to the increased adoption of rugged devices in manufacturing and transportation industries in the region. The increasing defense budgets further drive the growth of the market in aerospace and defense industry in APAC, where rugged display manufacturers are expected to find various growth opportunities in near future.
The major players in the market are Getac Technology Corp. (Taiwan), Zebra Technologies Corp. (US), Sparton Corp. (US), Xplore Technologies Corp. (US), Trimble, Inc. (US), Panasonic Corp. (Japan), and Advantech Co., Ltd. (Taiwan),Honeywell International, Inc. (US), Esterline Technologies Corp. (US), General Dynamics Corp. (US), L3 Technologies, Inc. (US), Curtiss-Wright Corp. (US), Elbit Systems, Ltd. (Israel), Dell Technologies Inc. (US), Beijer Electronics AB (Sweden), and Kyocera Corp. (Japan),
To speak to our analyst for a discussion on the above findings, click Speak to Analyst
 Exclusive indicates content/data unique to MarketsandMarkets and not available with any competitors.
Table of Contents
1 Introduction (Page No. - 16)
1.1 Objectives of the Study
1.2 Market Definition
1.3 Study Scope
1.3.1 Markets Covered
1.3.2 Scope Definition
1.3.3 Years Considered for the Study
1.4 Currency
1.5 Package Size
1.6 Limitations
1.7 Stakeholders
2 Research Methodology (Page No. - 21)
2.1 Research Data
2.1.1 Secondary Data
2.1.1.1 List of Major Secondary Sources
2.1.1.2 Key Data From Secondary Sources
2.1.2 Primary Data
2.1.2.1 Breakdown of Primaries
2.1.2.2 Key Industry Insights
2.2 Market Size Estimation
2.2.1 Bottom-Up Approach
2.2.1.1 Approach for Capturing Market Share By Bottom-Up Analysis (Demand Side)
2.2.2 Top-Down Approach
2.2.2.1 Approach for Capturing the Market Share By Top-Down Analysis (Supply Side)
2.3 Market Breakdown and Data Triangulation
2.4 Research Assumptions
3 Executive Summary (Page No. - 30)
4 Premium Insights (Page No. - 35)
4.1 Attractive Opportunities in the Rugged Display Market (2017–2023)
4.2 Rugged Display Market, By Product, 2014–2023
4.3 Market, By Display Size, 2014–2023
4.4 Market, By Level of Ruggedness, 2014–2023
4.5 Market, By Operating System, 2017 vs 2023
4.6 Market, By Vertical, 2017 vs 2023
4.7 Market, By Region and Vertical, 2016
5 Market Overview (Page No. - 39)
5.1 Introduction
5.2 Market Dynamics
5.2.1 Drivers
5.2.1.1 Reduced Total Cost of Ownership (TCO) Over A Long Period of Time
5.2.1.2 Rising Demand for HMI and IoT in Various Industries
5.2.2 Restraints
5.2.2.1 Adoption of Consumer-Grade Devices for Industrial Applications
5.2.3 Opportunities
5.2.3.1 Development of OLED and E-Paper Display Technologies
5.2.3.2 Technological Shift and Development of High-Specification Display Devices
5.2.4 Challenges
5.2.4.1 High Initial Cost of Rugged Display Devices
5.2.4.2 Fluctuating Average Selling Price of Display Panels
6 Industry Trends (Page No. - 47)
6.1 Value Chain Analysis
6.1.1 Introduction
6.1.2 Research and Development
6.1.3 Display Panel Manufacturing & Input Suppliers
6.1.4 Device Assembly and Testing
6.1.5 Distribution, Marketing, and Post-Sales Services
6.2 Standards for Ruggedized Devices
6.2.1 Ingress Protection (IP) Rating
6.2.2 Military Standard (MIL-STD) Or Military SPEC (MIL-SPEC)
7 Market Display Market, By Product (Page No. - 51)
7.1 Introduction
7.2 Smartphone and Handheld Computer
7.3 Tablet PC
7.4 Laptop and Notebook
7.5 Avionics Display
7.6 Vehicle-Mounted Computer
7.7 Panel PC & Mission-Critical Display
8 Rugged Display Market, By Level of Ruggedness (Page No. - 72)
8.1 Introduction
8.2 Semi-Rugged
8.3 Fully Rugged
8.4 Ultra-Rugged
9 Rugged Display Market, By Display Size (Page No. - 79)
9.1 Introduction
9.2 Less Than 10 Inches
9.3 10 to 15 Inches
9.4 More Than 15 Inches
10 Rugged Display Market, By Operating System (Page No. - 84)
10.1 Introduction
10.2 Android
10.3 Windows
10.4 Others
11 Rugged Display Market, By Vertical (Page No. - 91)
11.1 Introduction
11.2 Government, Defense, and Aerospace
11.3 Industrial
11.4 Automotive and Transportation
11.5 Healthcare
11.6 Others
12 Geographical Analysis (Page No. - 102)
12.1 Introduction
12.2 North America
12.2.1 US
12.2.2 Canada
12.2.3 Mexico
12.3 Europe
12.3.1 UK
12.3.2 Germany
12.3.3 France
12.3.4 Rest of Europe
12.4 Asia Pacific
12.4.1 China
12.4.2 Japan
12.4.3 South Korea
12.4.4 Rest of APAC
12.5 Rest of the World (RoW)
12.5.1 South America
12.5.2 Middle East
12.5.3 Africa
13 Competitive Landscape (Page No. - 123)
13.1 Overview
13.2 Market Ranking Analysis: Rugged Display Market, 2016
13.3 Competitive Leadership Mapping
13.3.1 Visionary Leaders
13.3.2 Dynamic Differentiators
13.3.3 Innovators
13.3.4 Emerging Companies
13.4 Business Strategy Excellence (25 Companies)
13.5 Strength of Product Portfolio (25 Companies)
*Top 25 companies analyzed for this study are - Getac Technology Corp. (Taiwan), Sparton Corp. (US), Xplore Technologies Corp. (US), Zebra Technologies Corp. (US), Trimble, Inc. (US), Honeywell International, Inc. (US), Esterline Technologies Corp. (US), General Dynamics Corp. (US), Beijer Electronics AB (Sweden), VarTech Systems Inc. (US), Panasonic Corp. (Japan), L3 Technologies, Inc. (US), Kyocera Corp. (Japan), Curtiss-Wright Corp. (US), Bluebird, Inc. (South Korea), MilDef Group AB (Sweden), Handheld Group AB (Sweden), Elbit Systems, Ltd. (Israel), WinMate Inc. (Taiwan), JLT Mobile Computers AB (Sweden), Epsilon Systems Solutions, Inc. (US), Dell Technologies Inc. (US), Advantech Co., Ltd. (Taiwan), AAEON Technology, Inc. (Taiwan), Juniper Systems, Inc. (US)
14 Company Profiles (Page No. - 129)
(Business Overview, Products Offered, Product Offering Scorecard, Business Strategy Scorecard, Recent Developments, Key Relationships)*
14.1 Introduction
14.2 Getac Technology Corp.
14.3 Zebra Technologies Corp.
14.4 Panasonic Corporation
14.5 Sparton Corp.
14.6 Xplore Technologies Corp.
14.7 Beijer Electronics AB
14.8 Kyocera Corp.
14.9 Esterline Technologies Corp.
14.10 L3 Technologies, Inc.
14.11 General Dynamics Corp.
14.12 Curtiss-Wright Corp.
14.13 Key Innovators
14.13.1 Roda Computer GmbH
14.13.2 Bluebird Inc.
14.13.3 Mildef AB
14.13.4 Handheld Group AB
14.13.5 Trimble Inc.
*Details on Business Overview, Products Offered, Product Offering Scorecard, Business Strategy Scorecard, Recent Developments, Key Relationships Might Not Be Captured in Case of Unlisted Companies.
15 Appendix (Page No. - 173)
15.1 Discussion Guide
15.2 Knowledge Store: Marketsandmarkets’ Subscription Portal
15.3 Introducing RT: Real-Time Market Intelligence
15.4 Available Customizations
15.5 Related Reports
15.6 Author Details
List of Tables (63 Tables)
Table 1 IP Rating First Digits: Solid
Table 2 IP Rating Second Digits: Liquids
Table 3 Rugged Display Market, 2014–2023
Table 4 Rugged Display Market Size, By Product, 2014–2023 (Thousand Units)
Table 5 Rugged Display Market, By Product, 2014–2023 (USD Million)
Table 6 Rugged Display Market for Rugged Smartphone & Handheld Computer, By Level of Ruggedness, 2014–2023 (USD Million)
Table 7 Rugged Display Market for Rugged Smartphone & Handheld Computer, By Operating System, 2014–2023 (USD Million)
Table 8 Rugged Display Market for Rugged Smartphone & Handheld Computer, By Vertical, 2014–2023 (USD Million)
Table 9 Market for Rugged Smartphone & Handheld Computer, By Region, 2014–2023 (USD Million)
Table 10 Market for Rugged Tablet PC, By Level of Ruggedness, 2014–2023 (USD Million)
Table 11 Market for Rugged Tablet PC, By Operating System, 2014–2023 (USD Million)
Table 12 Rugged Display Market for Rugged Tablet PC, By Display Size, 2014–2023 (USD Million)
Table 13 Rugged Display Market for Rugged Tablet PC, By Vertical, 2014–2023 (USD Million)
Table 14 Rugged Display Market for Rugged Tablet PC, By Region, 2014–2023 (USD Million)
Table 15 Rugged Display Market for Rugged Laptop and Notebook, By Level of Ruggedness, 2014–2023 (USD Million)
Table 16 Rugged Display Market for Rugged Laptop and Notebook, By Operating System, 2014–2023 (USD Million)
Table 17 Rugged Display Market for Rugged Laptop and Notebook, By Display Size, 2014–2023 (USD Million)
Table 18 Rugged Display Market for Rugged Laptop and Notebook, By Vertical, 2014–2023 (USD Million)
Table 19 Rugged Display Market for Rugged Laptop and Notebook, By Region, 2014–2023 (USD Million)
Table 20 Rugged Display Market for Rugged Avionics Display, By Level of Ruggedness, 2014–2023 (USD Million)
Table 21 Rugged Display Market for Rugged Avionics Display, By Display Size 2014–2023 (USD Million)
Table 22 Rugged Display Market for Rugged Avionics Display, By Region, 2014–2023 (USD Million)
Table 23 Rugged Display Market for Rugged Vehicle-Mounted Computer, By Level of Ruggedness, 2014–2023 (USD Million)
Table 24 Rugged Display Market for Rugged Vehicle-Mounted Computer, By Operating System, 2014–2023 (USD Million)
Table 25 Rugged Display Market for Rugged Vehicle-Mounted Computer, By Display Size, 2014–2023 (USD Million)
Table 26 Market for Rugged Vehicle-Mounted Computer, By Vertical, 2014–2023 (USD Million)
Table 27 Market for Rugged Vehicle-Mounted Computer, By Region, 2014–2023 (USD Million)
Table 28 Market for Panel PC & Mission-Critical Display, By Level of Ruggedness, 2014–2023 (USD Million)
Table 29 Market for Rugged Panel PC & Mission-Critical Display, By Operating System, 2014–2023 (USD Million)
Table 30 Market for Rugged Panel PC & Mission-Critical Display, By Display Size, 2014–2023 (USD Million)
Table 31 Market for Rugged Panel PC & Mission-Critical Display, By Vertical, 2014–2023 (USD Million)
Table 32 Market for Rugged Panel PC & Mission-Critical Display, By Region, 2014–2023 (USD Million)
Table 33 Market, By Level of Ruggedness, 2014–2023 (USD Billion)
Table 34 Market for Semi-Rugged Displays, By Product, 2014–2023 (USD Million)
Table 35 Market for Fully Rugged Display, By Product, 2014–2023 (USD Million)
Table 36 Rugged Display Market for Ultra-Rugged Display, By Product, 2014–2023 (USD Million)
Table 37 Market, By Display Size 2014–2023 (USD Million)
Table 38 Rugged Display Market for Display Size Less Than 10 Inches, By Product, 2014–2023 (USD Million)
Table 39 Rugged Display Market for Display Size Between 10 and 15 Inches, By Product, 2014–2023 (USD Million)
Table 40 Rugged Display Market for Display Size More Than 15 Inches, By Product, 2014–2023 (USD Million)
Table 41 Rugged Display Market, By Operating System, 2014–2023 (USD Billion)
Table 42 Android OS-Based Market, By Product, 2014–2023 (USD Million)
Table 43 Windows OS-Based Market, By Product, 2014–2023 (USD Million)
Table 44 Other OS-Based Market, By Product, 2014–2023 (USD Million)
Table 45 Market, By Vertical, 2014–2023 (USD Million)
Table 46 Market for Government, Defense, and Aerospace Vertical, By Product, 2014–2023 (USD Million)
Table 47 Market for Government, Defense, and Aerospace Vertical, By Region, 2014–2023 (USD Million)
Table 48 Market for Industrial Vertical, By Product, 2014–2023 (USD Million)
Table 49 Market for Industrial Vertical, By Region, 2014–2023 (USD Million)
Table 50 Market for Automotive & Transportation Vertical, By Product, 2014–2023 (USD Million)
Table 51 Market for Automotive & Transportation Vertical, By Region, 2014–2023 (USD Million)
Table 52 Market for Healthcare Vertical, By Product, 2014–2023 (USD Million)
Table 53 Market for Other Verticals, By Product, 2014–2023 (USD Million)
Table 54 Market, By Region, 2014–2023 (USD Million)
Table 55 Market in North America, By Product, 2014–2023 (USD Million)
Table 56 Market in North America, By Country, 2014–2023 (USD Million)
Table 57 Market in Europe, By Product, 2014–2023 (USD Million)
Table 58 Market in Europe, By Country, 2014–2023 (USD Million)
Table 59 Market in APAC, By Product, 2014–2023 (USD Million)
Table 60 Market in APAC, By Country, 2014–2023 (USD Million)
Table 61 Market in RoW, By Product, 2014–2023 (USD Million)
Table 62 Market in RoW, By Region, 2014–2023 (USD Million)
Table 63 Key Player Market Ranking, 2016
List of Figures (56 Figures)
Figure 1 Market Segmentation
Figure 2 Geographic Segmentation
Figure 3 Market: Process Flow of Market Size Estimation
Figure 4 Market: Research Design
Figure 5 Data Triangulation
Figure 6 Assumptions of the Research Study
Figure 7 Fully Rugged Display Devices Expected to Dominate the Market During the Forecast Period
Figure 8 Rugged Display Devices With Panel Size Less Than 10 Inches Expected to Dominate the Market During the Forecast Period
Figure 9 Android OS-Based Rugged Devices Expected to Witness the Highest CAGR During the Forecast Period
Figure 10 Smartphones & Handheld Computers to Hold A Larger Share of the Market During the Forecast Period
Figure 11 Government, Defense, and Aerospace Vertical to Dominate the Market During the Forecast Period
Figure 12 Market, By Region, 2016
Figure 13 Market Expected to Grow at A Significant Rate During the Forecast Period
Figure 14 Smartphone and Handheld Computers to Dominate the Market During the Forecast Period
Figure 15 Less Than 10 Inches Segment Held the Larger Market Size of Rugged Displays in 2016
Figure 16 Fully Rugged Display Devices Expected to Hold the Largest Market Share By 2023
Figure 17 Android OS-Based Market to Grow at the Highest CAGR During the Forecast Period
Figure 18 Rugged Displays in Automotive and Transportation Vertical Expected to Witness the Highest CAGR During the Forecast Period
Figure 19 North America Expected to Dominate the Market During the Forecast Period
Figure 20 Market Dynamics: Overview
Figure 21 Ruggedized Mobile Display Device: Total Cost of Ownership (TCO) (Five Years)
Figure 22 Human–Machine Interface (HMI) Market, 2014–2022 (USD Billion)
Figure 23 Rugged Display System Market: Value Chain Analysis
Figure 24 Market, By Product
Figure 25 Rugged Smartphones & Handheld Computers to Dominate the Market During the Forecast Period
Figure 26 Market, By Level of Ruggedness
Figure 27 Fully Rugged Displays Expected to Hold A Large Share of the Market Between 2017 and 2023
Figure 28 Market, By Display Size
Figure 29 Market, By Display Size, 2017 vs 2023 (USD Million)
Figure 30 Market, By Operating System
Figure 31 Rugged Display Devices Operating on Android OS to Grow at the Highest CAGR Between 2017 and 2023
Figure 32 Market, By Vertical
Figure 33 Government, Defense, & Aerospace Vertical Expected to Hold A Large Share of the Market Between 2017 and 2023
Figure 34 Market: By Region
Figure 35 APAC Expected to Be the Fastest-Growing Region in the Market (2017–2023)
Figure 36 Market Geographic Snapshot: Rapidly Growing Markets Emerging as New Hotspots
Figure 37 North America: Market Snapshot
Figure 38 Market for Rugged Vehicle-Mounted Computer to Grow at the Highest CAGR in North America (2017–2023)
Figure 39 Europe: Market Snapshot
Figure 40 Rugged Avionics Display Market in Europe to Grow at the Highest CAGR During the Forecast Period
Figure 41 Asia Pacific: Market Snapshot
Figure 42 Rugged Tablet PC Market in APAC to Grow at the Highest CAGR During the Forecast Period
Figure 43 Market for Rugged Tablet PC in RoW to Grow at the Highest CAGR During the Forecast Period
Figure 44 Companies Adopted Product Launch as the Key Growth Strategy Between 2015 and 2017
Figure 45 Market(Global): Competitive Leadership Mapping, 2017
Figure 46 Getac Technology Corp.: Company Snapshot
Figure 47 Zebra Technologies Corp. : Company Snapshot
Figure 48 Panasonic Corporation : Company Snapshot
Figure 49 Sparton Corp. : Company Snapshot
Figure 50 Xplore Technologies Corp.: Company Snapshot
Figure 51 Beijer Electronics AB: Company Snapshot
Figure 52 Kyocera Corp. : Company Snapshot
Figure 53 Esterline Technologies Corp. : Company Snapshot
Figure 54 L3 Technologies, Inc. : Company Snapshot
Figure 55 General Dynamics Corp.: Company Snapshot
Figure 56 Curtiss-Wright Corp. : Company Snapshot
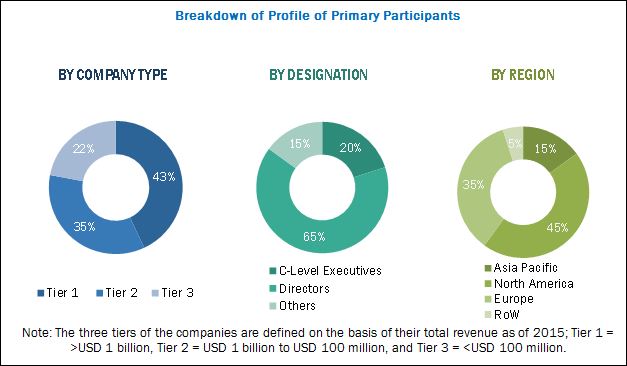
This research study incorporates the usage of secondary sources, directories, and databases such as Hoovers, Bloomberg BusinessWeek, Factiva, and OneSource to identify and collect information useful for the extensive technical, market-oriented, and commercial study of the digital signage rugged display market. Primary sources mainly comprise several experts from core and related industries, along with preferred suppliers, manufacturers, distributors, service providers, technology developers, alliances, standards, and certification organizations related to various parts of this industry’s value chain. In-depth interviews of various primary respondents, including key industry participants, subject matter experts (SMEs), C-level executives of key companies, and consultants, have been conducted to obtain and verify critical qualitative and quantitative information as well as assess future prospects. The breakdown of the profiles of primaries has been depicted in the figure below:
To know about the assumptions considered for the study, download the pdf brochure
This report provides valuable insights regarding the value chain of the market, such as research & development, display panel manufacturing, device assembly and testing, distribution, and marketing & post sales services, and end use industries. The key players of the rugged display market are Getac Technology Corp. (Taiwan), Sparton Corp. (US), Xplore Technologies Corp. (US), Panasonic Corp. (Japan), and Zebra Technologies Corp. (US)
Scope of the Report:
|
Report Metric |
Details |
|
Report Name |
Rugged Display Market |
|
Base year |
2016 |
|
Forecast period |
2017–2023 |
|
Forecast units |
Value in terms of USD million and billion |
|
Segments covered |
Product, System Type, Software & Services, Function, Industry, and Region |
|
Geographic regions covered |
North America, APAC, Europe, and RoW |
|
Companies covered |
Getac Technology Corp. (Taiwan), Sparton Corp. (US), Xplore Technologies Corp. (US), Panasonic Corp. (Japan), and Zebra Technologies Corp. (US) |
Target Audience
- Raw material providers
- Display panel manufacturers
- Display manufacturing equipment suppliers
- Brand customers/OEMs/ODMs
- Display-related service providers
- Display-related associations, organizations, forums, and alliances
- Government bodies such as regulating authorities and policy makers
- Venture capitalists and start-ups
- Semiconductor component suppliers
- Display panel and device distributors and sales firms
- Display device end users and industries
- Research institutes, organizations, and consulting companies
RESEARCH SCOPE
The market covered in this report has been segmented as follows:
Rugged Display Market, by Product:
- Smartphone & Handheld Computer
- Tablet PC
- Panel PC & Mission-Critical Display
- Laptop & Notebook
- Avionics Display
- Vehicle-Mounted Computer
Rugged Display Market, by Display Size:
- Less than 10 Inches
- 10 to 15 Inches
- More than 15 Inches
Rugged Display Market, by Level of Ruggedness:
- Ultra-Rugged
- Fully Rugged
- Semi-Rugged
Rugged Display Market, by Operating System:
- Android
- Windows
- Others
Rugged Display Market, by Vertical:
- Automotive & Transportation
- Government, Defense, & Aerospace
- Healthcare
- Industrial
- Others
Rugged Display Market, by Region:
- North America
- Europe
- Asia Pacific
- Rest of the World (RoW)
KEY QUESTIONS
- Which are the top use cases/applications/verticals of rugged display market to invest in and what are the untapped opportunities in retail, agriculture, construction, waste management, telecommunication, and food & beverages?
- How much growth is expected in rugged display market from automotive & transportation; government, defense, and aerospace; healthcare; and industrial applications?
- How the demand for rugged display products will shape in the next 5 years for newer and emerging applications?
- What are the trends and penetration rate of different operating systems (OS) and products into various applications or industries?
- Who are the major current and potential competitors in the market and what are their top priorities, strategies, and developments?
AVAILABLE CUSTOMIZATIONS
With the given market data, MarketsandMarkets offers the following customization options available for the report
Competitive Landscape
- Detailed analysis and profiling of additional market players
- Detailed analysis and profiling of key input suppliers (component suppliers, display panel suppliers, rugged solution suppliers) in rugged display supply chain
- Product-display size-OS-industry mapping of specific players in the market
Industry-Specific Data
- Detailed analysis of specific industries and respective use cases or applications in rugged display market
- Opportunities for payers in market w.r.t. growing trends of IoT, HMI, and digitization in manufacturing environment in different countries


Growth opportunities and latent adjacency in Rugged Display Market