High-Temperature Composite Materials Market by Temperature Range (High and Ultra-High), Matrix System (PMC, CMC and MMC Materials), Application (Aerospace & Defense, Transportation, Energy & Power, E&E and Others) and by Region - Global Forecasts to 2021


[137 Pages Report] In terms of value, the high-temperature composite materials market size was USD 3.36 Billion in 2015 and is projected to reach USD 5.01 Billion by 2021, registering a CAGR of 8.41% between 2016 and 2021. High-temperature composite materials are crucial in the aerospace & defense and transportation applications due to the demand for temperature resistance, high tensile strength, lightweight, and superior performance.
In this study, years considered for estimating market size of high-temperature composite materials are -
- Historical year � 2014
- Base year � 2015
- Estimated year � 2016
- Projected year � 2021
- Forecast period � 2016 to 2021
2015 has been considered the base year for company profiles. Whenever information was unavailable for the base year, the prior year has been considered.
Objectives of the Study
- To analyze the global market for high-temperature composites material in terms of volume and value
- To define, describe, and forecast the global high-temperature composite materials market based on temperature range, matrix system, and application
- To analyze and forecast the market size based on regions, namely, North America, Europe, Asia-Pacific, Latin America, and the Middle East & Africa
- To provide detailed information regarding the key factors influencing the market growth (drivers, restraints, opportunities, and challenges)
- To strategically analyze the market with respect to individual growth trends, prospects, and contribution of submarkets to the overall market
- To analyze the market opportunities and competitive landscape for stakeholders and market leaders
- To track and analyze competitive developments, such as alliances, joint ventures, mergers & acquisitions, and new product developments
- To strategically profile key players and analyze their core competencies
Various secondary sources such as company websites, encyclopedias, directories, and databases have been used to understand and gain insights for the high-temperature composite materials market. Experts from key high-temperature composite materials companies have been interviewed to verify and collect critical information and to assess the trend during the forecast period. The top-down, bottom-up, and data triangulation approaches have been implemented to calculate the exact values of the overall parent and individual market sizes.
To know about the assumptions considered for the study, download the pdf brochure
The market of high-temperature composite materials has a diversified ecosystem including the downstream stakeholders such as manufacturers, vendors, end users, and government organizations. Some of the major raw material suppliers are Royal Tencate N.V. (Netherlands), Renegade Materials Corporation (U.S.), Lonza Group (U.S.), and Kyocera Chemical Corporation (Japan), among others.
This study focuses on the key investment pockets that would help the stakeholders to understand and analyze the emerging trends of the high-temperature composite materials market. These stakeholders include the high-temperature composite materials manufacturers such as:
- 3M Company (U.S.).
- CeramTec GmbH (Germany)
- COI Ceramics Inc. (U.S.)
- Lancer Systems LP (U.S.)
- Ultramet Inc. (U.S.)
Scope of the Report:
This research report categorizes the market of high-temperature composite materials based on temperature range, matrix system, application, and region. It forecasts revenue growth and analysis of trends in each of the submarkets till 2021.
On the basis of Temperature Range:
- High temperature
- Ultra-high temperature
On the basis of Matrix System:
- Polymer matrix composite materials
- Ceramic matrix composite materials
- Metal matrix composite materials
On the basis of Application:
- Aerospace & defense
- Transportation
- Energy & power
- Electronics & electrical
- Others (building & construction and marine)
On the basis of Region:
- North America
- Europe
- Asia-Pacific
- Latin America
- Middle East & Africa
Available Customizations
With the given market data, MarketsandMarkets offers customizations according to the specific needs of the companies. The following customization options are available for the report:
Product Analysis
- Product matrix, which gives a detailed comparison of the product portfolio of each company
Regional Analysis
- Further breakdown of the North American high-temperature composite materials market
- Further breakdown of the European high-temperature composite materials market
- Further breakdown of the Asia-Pacific high-temperature composite materials market
- Further breakdown of the South American high-temperature composite materials market
- Further breakdown of the Middle East & Africa high-temperature composite materials market
Company Information
- Detailed analysis and profiling of additional market players
The market size of high-temperature composite materials is projected to reach USD 5.01 Billion by 2021, at a CAGR of 8.41% during the forecast period. The introduction of safety norms in public transport as well as increasing demand for lightweight and high-performance composite materials in the aerospace & defense, transportation, and energy & power applications are key factors responsible for the growth of the high-temperature composite materials market.
The global high-temperature composite materials market is segmented into matrix type, temperature range, and applications. The high-temperature composite materials market, by matrix type, is further segment into polymer matrix composite (PMC), ceramic matrix composite (CMC), and metal matrix composite (MMC) materials. CMC-based high-temperature composite materials had the largest market size owing to growing demand from applications such as gas turbine engines, engine components, gas turbines, fixed & moving turbine components, suction box covers, hot gas flow liners, heat exchangers, and brake disks of aircraft, automotive, and marine.
The high-temperature composite materials market, by temperature range is segmented into high temperature and ultra-high temperature. The ultra-high-temperature composite materials segment is growing due to high demand from hypersonic aircrafts. The high-temperature range composite materials registered the largest market share owing to increasing demand for high-temperature composite materials from the aerospace & defense application.
The major applications included in the high-temperature composite materials market are aerospace & defense, transportation, energy & power, electronics & electrical, and others. Aerospace & defense constituted a major portion of the high-temperature composite materials market. High growth of the aerospace & defense application is attributed to extensive use in aero-engine and interior components, as they are lightweight, durable, and do not corrode, resulting in reduced maintenance and replacement costs.
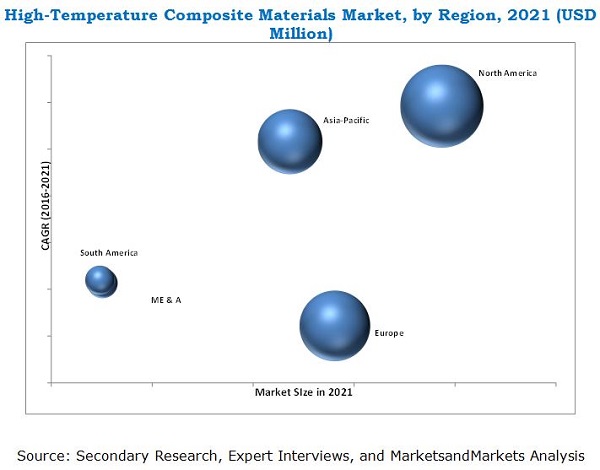
North America is expected to be the fastest-growing high-temperature composite materials market in the next five years. The development in infrastructure facilities, investment made by high-temperature composite materials manufacturers, and capacity expansions by various leading players are few factors leading to the growth of the market in this region.U.S. dominated the market of high-temperature composite materials in North America in 2015. Its consumption of high-temperature composites has grown remarkably due to growth in the aerospace & defense and transportation industries.
The high-temperature composite materials market size is rapidly growing, in terms of value. However, relatively poor strength and lack of awareness among end users in developing regions are major restraints to the growth of the high-temperature composite materials market.
Companies such as Royal Ten Cate N.V. (Netherlands), Kyocera Corporation (Japan), and Solvay Group (Belgium) are the dominant market players of the high-temperature composite materials market. They have been adopting various organic and inorganic growth strategies such as joint ventures & agreements and expansion to enhance their share in the high-temperature composite materials market.
To speak to our analyst for a discussion on the above findings, click Speak to Analyst
 Exclusive indicates content/data unique to MarketsandMarkets and not available with any competitors.
Table of Contents
1 Introduction (Page No. - 14)
1.1 Objectives of the Study
1.2 Market Definition
1.3 Market Scope
1.3.1 Years Considered for the Study
1.4 Currency
1.5 Package Size
1.6 Limitations
1.7 Stakeholders
2 Research Methodology (Page No. - 17)
2.1 Research Data
2.1.1 Secondary Data
2.1.1.1 Key Data From Secondary Sources
2.1.2 Primary Data
2.1.2.1 Key Data From Primary Sources
2.1.2.2 Key Industry Insights
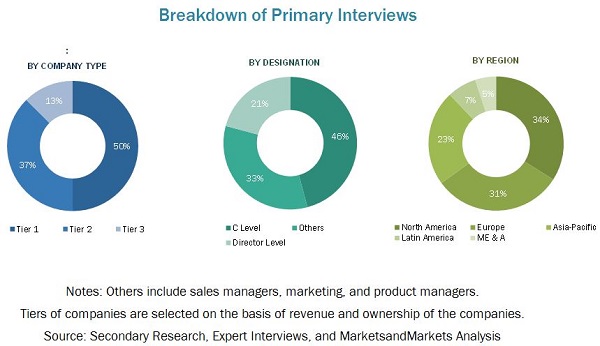
2.1.2.3 Breakdown of Primaries
2.2 Market Size Estimation
2.2.1 Bottom-Up Approach
2.2.2 Top-Down Approach
2.3 Market Breakdown and Data Triangulation
2.4 Research Assumptions
3 Executive Summary (Page No. - 26)
4 Premium Insights (Page No. - 32)
4.1 High-Temperature Composite Materials Market, 2016�2021
4.2 High-Temperature Composite Materials Market, By Matrix System
4.3 High-Temperature Composite Materials Market Share, By Application and By Region, 2015
4.4 High-Temperature Composite Materials Market Growth, By Country
4.5 High-Temperature Composite Materials Market in Transportation Application, By Region
5 Market Overview (Page No. - 36)
5.1 Introduction
5.2 Evolution
5.3 Market Segmentation
5.3.1 By Temperature Range
5.3.2 By Matrix System
5.3.3 By Application
5.3.4 By Region
5.4 Market Dynamics
5.4.1 Drivers
5.4.1.1 Introduction of Safety Norms in Public Transport
5.4.1.2 Increasing Demand for Lightweight and High-Performance Materials From Transportation, Aerospace & Defense, and Energy & Power Industries
5.4.2 Restraints
5.4.2.1 Issues Pertaining to Recyclability
5.4.2.2 High Processing and Manufacturing Costs
5.4.2.3 High Customization Requirement for End-Use Applications
5.4.3 Opportunities
5.4.3.1 Incorporation of Low-Cost Production Technologies
5.4.3.2 Standardization in Manufacturing Processes of High-Temperature Composite Materials
5.4.3.3 Increasing R&D Activities and Mass Production of High-Temperature Fibers
5.4.4 Challenges
5.4.4.1 Concerns About Reparability and Recyclability
5.4.4.2 Lower Adoption in Newer Applications
5.5 Porter�s Five Forces Analysis
5.5.1 Bargaining Power of Suppliers
5.5.2 Bargaining Power of Buyers
5.5.3 Threat of Substitutes
5.5.4 Threat of New Entrants
5.5.5 Intensity of Competitive Rivalry
6 Macroeconomic Overview and Key Trends (Page No. - 47)
6.1 Introduction
6.2 Trends and Forecast of GDP
6.3 Per Capita GDP vs Per Capita Composite Materials Demand
6.4 Trends of Aerospace Industry
6.5 Trends of Automotive Industry
7 High-Temperature Composites Market, By Temperature Range (Page No. - 53)
7.1 Introduction
7.2 High-Temperature Composite Materials
7.3 Ultra-High Temperature Composite Materials
8 High-Temperature Composite Materials Market, By Matrix System (Page No. - 59)
8.1 Introduction
8.2 Polymer Matrix Composite Materials
8.3 Ceramic Matrix Composite Materials
8.4 Metal Matrix Composite Materials
9 High-Temperature Composite Materials Market, By Application (Page No. - 69)
9.1 Introduction
9.2 Aerospace & Defense
9.3 Transportation
9.4 Energy & Power
9.5 Electrical & Electronics
9.6 Others
10 High-Temperature Composirte Materials Market, By Region (Page No. - 79)
10.1 Introduction
10.2 North America
10.2.1 U.S.
10.2.2 Canada
10.3 Europe
10.3.1 Germany
10.3.2 France
10.3.3 U.K.
10.3.4 Italy
10.3.5 Spain
10.3.6 Russia
10.3.7 Turkey
10.4 Asia-Pacific
10.4.1 China
10.4.2 India
10.4.3 Japan
10.4.4 South Korea
10.4.5 Australia & New Zealand
10.4.6 Malaysia
10.5 Latin America
10.5.1 Brazil
10.5.2 Mexico
10.6 ME&A
10.6.1 Uae
10.6.2 South Africa
11 Competitive Landscape (Page No. - 104)
11.1 Overview
11.2 Joint Ventures & Agreements: the Most Popular Growth Strategy
11.3 Maximum Developments in 2014 and 2016
11.4 Competitive Benchmarking and Landscape
11.4.1 Joint Ventures & Agreements
11.4.2 Expansions
12 Company Profiles (Page No. - 108)
(Overview, Financial*, Products & Services, Strategy, and Developments)
12.1 Renegade Materials Corporation
12.2 BASF SE
12.3 Henkel AG & Co. KGAA
12.4 Kyocera Chemical Corporation
12.5 UBE Industries Ltd.
12.6 Hexion Inc.
12.7 Cytec Industries, Inc.
12.8 SGL Group
12.9 Royal Tencate N.V.
12.10 Schweiter Technologies
12.11 Nippon Carbon Company Ltd.
*Details Might Not Be Captured in Case of Unlisted Companies.
13 Appendix (Page No. - 130)
13.1 Insights From Industry Experts
13.2 Discussion Guide
13.3 Introducing RT: Real-Time Market Intelligence
13.4 Knowledge Store: Marketsandmarkets� Subscription Portal
13.5 Available Customizations
13.6 Related Reports
List of Tables (70 Tables)
Table 1 High-Temperature Composite Materials Market Size (Volume and Value), 2016-2021
Table 2 Trends and Forecast of GDP, USD Billion (2015�2021)
Table 3 Per Capita GDP vs Per Capita Composite Materials Demand, 2015
Table 4 Market of New Airplanes, 2014
Table 5 Global Automotive Production, Million Unit (2011�2015)
Table 6 High-Temperature Composite Materials Market Size, By Temperature Range, 2014�2021 (USD Million)
Table 7 High-Temperature Composite Materials Market Size, By Temperature Range, 2014�2021 (Kiloton)
Table 8 High-Temperature Composite Materials Market, By Region, 2014�2021 (USD Million)
Table 9 High-Temperature Composite Materials Market, By Region, 2014�2021 (Kiloton)
Table 10 Ultra-High Temperature Composite Materials Market, By Region, 2014�2021 (USD Million)
Table 11 Ultra-High Temperature Composite Materials Market, By Region, 2014�2021 (Kiloton)
Table 12 High-Temperature Composite Materials Market, By Matrix System, 2014�2021 (USD Million)
Table 13 High-Temperature Composite Materials Market, By Matrix System, 2014�2021 (Kiloton)
Table 14 High-Temperature PMC Materials Market, By Type, 2014�2021 (USD Million)
Table 15 High-Temperature PMC Materials Market, By Type, 2014�2021 (Kiloton)
Table 16 High-Temperature PMC Materials Market, By Region, 2014�2021, (USD Million)
Table 17 High-Temperature PMC Materials Market, By Region, 2014�2021 (Kiloton)
Table 18 High-Temperature Composite Materials Market Size, By CMC Type, 2014�2021 (USD Million)
Table 19 High-Temperature Composite Materials Market Size, By CMC Type, 2014�2021 (Kiloton)
Table 20 High-Temperature CMC Materials Market, By Region, 2014�2021 (USD Million)
Table 21 High-Temperature CMC Materials Market, By Region, 2014�2021 (Kiloton)
Table 22 High-Temperature MMC Materials Market Size, 2014�2021
Table 23 High-Temperature MMC Materials Market, By Region, 2014�2021 (Kiloton)
Table 24 High-Temperature MMC Materials Market, By Region, 2014�2021 (Kiloton)
Table 25 High-Temperature Composite Materials Market Size, By Application, 2014�2021 (USD Million)
Table 26 High-Temperature Composite Materials Market Size, By Application, 2014�2021 (Kiloton)
Table 27 High-Temperature Composite Materials Market in Aerospace & Defense Application, By Region, 2014�2021 (USD Million)
Table 28 High-Temperature Composite Materials Market in Aerospace & Defense Application, By Region, 2014�2021 (Kiloton)
Table 29 High-Temperature Composite Materials Market in Transportation Application, By Region, 2014�2021 (USD Million)
Table 30 High-Temperature Composite Materials Market in Transportation Application, By Region, 2014�2021 (Kiloton)
Table 31 High-Temperature Composite Materials Market in Energy & Power Application, By Region, 2014�2021 (USD Million)
Table 32 High-Temperature Composite Materials Market in Energy & Power Application, By Region, 2014�2021 (Kiloton)
Table 33 High-Temperature Composite Materials Market in Electrical & Electronics Application, By Region, 2014�2021 (USD Million)
Table 34 High-Temperature Composite Materials Market in Electrical & Electronics Application, By Region, 2014�2021 (Kiloton)
Table 35 High-Temperature Composite Materials Market in Others Application, By Region, 2014�2021 (USD Million)
Table 36 High-Temperature Composite Materials Market in Others Application, By Region, 2014�2021 (Kiloton)
Table 37 High-Temperature Composite Materials Market Size, By Region, 2014�2021 (USD Million)
Table 38 High-Temperature Composite Materials Market Size, By Region, 2014�2021 (Kiloton)
Table 39 North America: High-Temperature Compopsite Materials Market Size, By Country, 2014�2021 (USD Million)
Table 40 North America: High-Temperature Compopsite Materials Market Size, By Country, 2014�2021 (Kiloton)
Table 41 North America: High-Temperature Compopsite Materials Market Size, By Application, 2014�2021 (USD Million)
Table 42 North America: High-Temperature Compopsite Materials Market Size, By Application, 2014�2021 (Kiloton)
Table 43 North America: High-Temperature Compopsite Materials Market Size, By Matrix System, 2014�2021 (USD Million)
Table 44 North America: High-Temperature Compopsite Materials Market Size, By Matrix System, 2014�2021 (Kiloton)
Table 45 Europe: High-Temperature Compopsite Materials Market Size, By Country, 2014�2021 (USD Million)
Table 46 Europe: High-Temperature Compopsite Materials Market Size, By Country, 2014�2021 (Kiloton)
Table 47 Europe: High-Temperature Compopsite Materials Market Size, By Application, 2014-2021 (USD Million)
Table 48 Europe: High-Temperature Compopsite Materials Market Size, By Application, 2014-2021 (Kiloton)
Table 49 Europe: High-Temperature Compopsite Materials Market Size, By Matrix System, 2014�2021 (USD Million)
Table 50 Europe: High-Temperature Compopsite Materials Market Size, By Matrix System, 2014�2021 (Kiloton)
Table 51 Asia-Pacific: High-Temperature Compopsite Materials Market Size, By Country, 2014�2021 (USD Million)
Table 52 Asia-Pacific: High-Temperature Compopsite Materials Market Size, By Country, 2014�2021 (Kiloton)
Table 53 Asia-Pacific: High-Temperature Compopsite Materials Market Size, By Application, 2014�2021 (USD Million)
Table 54 Asia-Pacific: High-Temperature Compopsite Materials Market Size, By Application, 2014�2021 (Kiloton)
Table 55 Asia-Pacific: High-Temperature Compopsite Materials Market Size, By Matrix System, 2014�2021 (USD Million)
Table 56 Asia-Pacific: High-Temperature Compopsite Materials Market Size, By Matrix System, 2014�2021 (Kiloton)
Table 57 Latin America: High-Temperature Composite Materials Market Size, By Country, 2014�2021 (USD Million)
Table 58 Latin America: High-Temperature Composite Materials Market Size, By Country, 2014�2021 (Kiloton)
Table 59 Latin America: High-Temperature Compopsite Materials Market Size, By Application, 2014�2021 (USD Million)
Table 60 Latin America: High-Temperature Composite Materials Market Size, By Application, 2014�2021 (Kiloton)
Table 61 Latin America: High-Temperature Composite Materials Market Size, By Matrix System, 2014�2021 (USD Million)
Table 62 Latin America: High-Temperature Composite Materials Market Size, By Matrix System, 2014�2021 (Kiloton)
Table 63 ME&A: High-Temperature Composite Materials Market Size, By Country, 2014�2021 (USD Million)
Table 64 ME&A: High-Temperature Composite Materials Market Size, By Country, 2014�2021 (Kiloton)
Table 65 ME&A: High-Temperature Composite Materials Market Size, By Application, 2014�2021 (USD Million)
Table 66 ME&A: High-Temperature Composite Materials Market Size, By Application, 2014�2021 (Kiloton)
Table 67 ME&A: High-Temperature Composite Materials Market Size, By Matrix System, 2014�2021 (USD Million)
Table 68 ME&A: High-Temperature Composite Materials Market Size, By Matrix System, 2014�2021 (Kiloton)
Table 69 Joint Venture & Agreement, 2011�2016
Table 70 Expansion, 2011�2016
List of Figures (50 Figures)
Figure 1 High-Temperature Composite Materials Market Segmentation
Figure 2 High-Temperature Composite Materials Market: Research Methodology
Figure 3 Market Size Estimation Methodology: Bottom-Up Approach
Figure 4 Market Size Estimation Methodology: Top-Down Approach
Figure 5 Data Triangulation Methodology
Figure 6 Aerospace & Defense Industry to Drive the High-Temperature Composite Materials Market
Figure 7 North America Dominated the High-Temperature Composite Materials Market in 2015
Figure 8 CMC Materials Dominate the High-Temperature Composite Materials Market
Figure 9 High-Temperature Composite Materials to Outpace Ultra-High Temperature Composite Materials (2016�2021)
Figure 10 Attractive Opportunities in High-Temperature Composite Materials Market
Figure 11 CMC is Highly Preferred By High-Temperature Composite Materials Manufacturers
Figure 12 North America is the Largest Market for High-Temperature Composite Materials, in Terms of Value
Figure 13 India and U.S. to Be the Fastest-Growing Country, 2016�2021
Figure 14 Europe to Dominate the High-Temperature Composite Materials Market in Transportation (2016-2021)
Figure 15 Drivers, Restraints, Opportunities, and Challenges in High-Temperature Composite Market
Figure 16 Porter�s Five Forces: Intensity of Rivalry is High Due to Presence of Few Players
Figure 17 Trends and Forecast of GDP, USD Billion (2016�2021)
Figure 18 Per Capita GDP vs Per Capita Composite Materials Demand
Figure 19 New Airplane Deliveries, By Region, 2015-2034
Figure 20 Automotive Production in Key Coutries, Million Unit (2011 vs 2015)
Figure 21 High-Temperature Composite Materials to Register the Highest CAGR By Volume
Figure 22 North America to Dominate the Ultra-High High-Temperature Composite Materials Market
Figure 23 CMC Materials to Lead the High-Temperature Composite Materials Market (USD Million)
Figure 24 Europe to Lead the High-Temperature PMC Materials Market, (2016 - 2021)
Figure 25 SiC/SiC CMC Materials to Account for the Largest Market Size in 2016
Figure 26 North America to Dominate the CMC Materials Market
Figure 27 Aerospace & Defense is Projected to Be the Leading Application in High Temperature Composite Materials Market 2016 vs 2021,
Figure 28 Asia-Pacific to Register the Highest Growth in Aerospace & Defense Application Between 2016 and 2021
Figure 29 India and U.S.To Drive the High-Temperature Composite Materials High-Temperature Composite Materials Market (2016�2021)
Figure 30 High-Temperature Compopsite Materials Market Snapshot: U.S. is the Most Lucrative Market in North America (2016�2021)
Figure 31 High-Temperature Compopsite Materials Market Snapshot: Germany is the Fastest-Growing Market in Europe (2016�2021)
Figure 32 High-Temperature Compopsite Materials Market Snapshot: China is the Key High-Temperature Compopsite Materials Market in Asia-Pacific (2016�2021)
Figure 33 Aerospace & Defense to Be the Fastest-Growing Application in Latin America, 2016-2021
Figure 34 Aerospace & Defense to Be the Fastest-Growing Application for High-Temperature Composite Materials in ME&A, (2016�2021)
Figure 35 Companies Adopted Agreements and Expansions as the Key Growth Strategies During 2011�2016
Figure 36 Major Growth Strategies in High-Temperature Composites Market, 2011�2016
Figure 37 Developments in High-Temperature Composite Materials Market, 2011�2016
Figure 38 BASF SE: Company Snapshot
Figure 39 Henkel AG & Co. KGAA: Company Snapshot
Figure 40 Kyocera Chemical Corporation: Company Snapshot
Figure 41 Kyocera Chemical Corporation: SWOT Analysis
Figure 42 UBE Industries Ltd.: Company Snapshot
Figure 43 Hexion Inc.: Company Snapshot
Figure 44 Cytec Industries, Inc.: Company Snapshot
Figure 45 Cytec Industries, Inc.: SWOT Analysis
Figure 46 SGL Group: Company Snapshot
Figure 47 Royal Tencate N.V.: Company Snapshot
Figure 48 Royal Tencate N.V.: SWOT Analysis
Figure 49 Schweiter Technologies: Company Snapshot
Figure 50 Nippon Carbon Company Ltd.: Company Snapshot


Growth opportunities and latent adjacency in High-Temperature Composite Materials Market