Hearable Devices Market by Product ((Headset (Traditional Headset, Earbuds), Headphone, and Hearing Aids (Smart, Regular)), Technology (Bluetooth, Wi-Fi), Application (Consumer, Healthcare), and Geography - Global Forecast to 2023


[152 Pages Report]The global hearable devices market is expected to reach USD 23.24 Billion by 2023, at a CAGR of 9.98% between 2017 and 2023.
The years considered for the study are as follows:
- Base Year: 2016
- Estimated Year: 2017
- Projected Year: 2023
- Forecast Period: 2017 –2023
The major objectives of the study are as follows:
- To define and describe the global hearable devices market based on product, technology, application, and geography
- To estimate and forecast the global market by volume and value
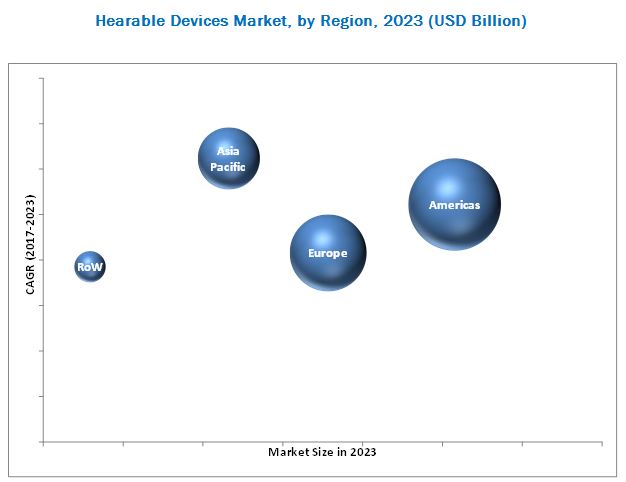
- To estimate and forecast the market size for various segments with regard to 4 main regions: the Americas, Europe, Asia Pacific (APAC), and Rest of the World (RoW)
- To provide detailed information regarding major factors influencing the growth of the market (drivers, restraints, opportunities, and challenges)
- To analyze the micromarkets with regard to industry trends, prospects, and contribution to the total market
- To analyze opportunities in the market for stakeholders by identifying the high-growth segments of the market and provide details of the competitive landscape for market leaders
- To benchmark players within the market using proprietary “Competitive Leadership Mapping Framework,” which analyzes market players on various parameters within the broad categories of business and product strategy.
- To profile key players and comprehensively analyze their market position in terms of ranking and core competencies
The global hearable devices market is expected to increase to USD 23.24 Billion by 2023, at a CAGR of 9.98% between 2017 and 2023. Some key factors driving this market are the growing demand for smartphones as a source of entertainment; consumer preference for wearable and portable devices; increasing demand for health monitoring applications and hearing aids; and high investment in R&D for hearables by OEMs.
The market for hearing aids accounted for the largest market in 2016. The huge market of hearing aids is accounted because of the increasing number of the hearing-impaired population across the globe. According to World Health Organization (Switzerland), more than 5 % of world’s population suffers from hearing loss. Companies in the market have a strong distribution network to ensure the customized hearing aid devices. They started offering new capabilities in hearables to the elderly and other patients. These hearable devices also help manage particular health conditions and disease states.
The market for digital hearing aids is expected to grow at the highest rate during the forecast period. Digitally programmable hearing aids possess all the features of analog aids, but they use digitized sound processing. They are usually self-adjusting and offer greater precision for speech recognition and noise reduction. Digital hearing aids allow the use of the latest wireless connecting technologies such as Bluetooth and others.
Among all the major applications of the hearable devices market, the market for healthcare application accounted the largest share in 2016. The evolution of technology allows people to measure heart rates and other parameters such as body temperature, blood pressure, pulse oximetry, electrocardiogram (ECG), electroencephalogram signals, and others using various smart hearable devices available in the market. Companies in this market also started offering new capabilities in hearables to the elderly and other patients. These hearable devices also help manage particular health conditions and disease states.
In terms of regions, the Americas acquired the largest market for hearable devices in 2016. The market in the Americas is likely to be fueled by the increase in sale and distribution of hearing aids. The growing population of music listeners, increasing digital music sales, and the popularity of audio and video entertainment segment are expected to influence the regional market positively over the next decade. Technological improvements are mainly driving the hearable devices market in the Americas.
Delivering high-quality audio in real time is the restraining factor for the growth of hearable devices market as the bandwidth constraint, delay in coding, and bit errors affect the wireless audio transfer. Also, latency is still an issue in wireless devices when it comes to real-time streaming.
Apple Inc. (US) is one of the leading companies in the hearable devices market, followed by Samsung Electronics Co., Ltd. (South Korea) providing the wireless stereo headset, which provides very sophisticated U-shaped design, delivering clear voice quality with the help of noise- and echo-reducing NR and EC technologies. Companies are strengthening their product portfolio with new launches by increasing R&D investments.
To speak to our analyst for a discussion on the above findings, click Speak to Analyst
 Exclusive indicates content/data unique to MarketsandMarkets and not available with any competitors.
Table of Contents
1 Introduction (Page No. - 12)
1.1 Objectives of the Study
1.2 Market Definition
1.3 Study Scope
1.3.1 Markets Covered
1.3.2 Years Considered for the Study
1.4 Currency
1.5 Limitations
1.6 Stakeholders
2 Research Methodology (Page No. - 15)
2.1 Introduction
2.2 Research Data
2.2.1 Secondary Data
2.2.1.1 Key Data From Secondary Sources
2.2.2 Primary Data
2.2.2.1 Key Data From Primary Sources
2.2.2.2 Key Industry Insights
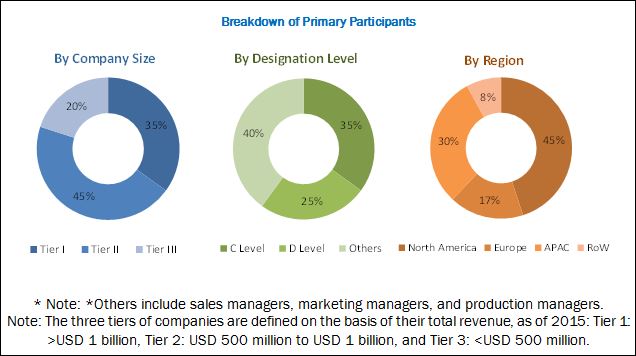
2.2.2.3 Breakdown of Primary Interviews
2.2.3 Secondary and Primary Research
2.3 Market Size Estimation
2.3.1 Bottom-Up Approach
2.3.1.1 Approach for Capturing the Market Size By Bottom-Up Analysis (Demand Side)
2.3.2 Top-Down Approach
2.3.2.1 Approach for Capturing the Market Share By Top-Down Analysis (Supply Side)
2.4 Market Breakdown & Data Triangulation
2.5 Research Assumptions
3 Executive Summary (Page No. - 27)
4 Premium Insights (Page No. - 34)
4.1 Attractive Market Opportunities in the Market
4.2 Bluetooth Hearable Devices Market, By Product, 2015–2023 (USD Billion)
4.3 Wireless Hearing Aids Market, By Processing Capability, 2015–2023 (USD Billion)
4.4 Geographic Snapshot of the Market
4.5 APAC: Market, By Country, 2017–2023 (USD Billion)
5 Market Overview (Page No. - 37)
5.1 Introduction
5.2 Market Dynamics
5.2.1 Drivers
5.2.1.1 Growing Demand for Smartphones as A Source of Entertainment
5.2.1.2 Consumer Preference for Wearable and Portable Devices
5.2.1.3 Increasing Demand for Health Monitoring Applications and Hearing Aids
5.2.1.4 High Investment in R&D for Hearable Devices By OEMS
5.2.2 Restraints
5.2.2.1 Delivering High-Quality Audio
5.2.3 Opportunities
5.2.3.1 Advancements in Voice User Interface (UI)
5.2.3.2 Emerging Hearable Computing
5.2.4 Challenges
5.2.4.1 Negative Health Effects on Children and Other User Groups
5.2.4.2 Optimizing Battery Life
5.3 Value Chain Analysis
6 Market, By Product (Page No. - 45)
6.1 Introduction
6.2 Headset
6.2.1 Headset Market, By Type
6.2.1.1 Traditional Headset
6.2.1.2 Earbuds
6.2.2 Headset Market, By Processing Capability
6.2.2.1 Smart Headset
6.2.2.2 Regular Headset
6.3 Headphone
6.4 Hearing Aids
6.4.1 Regular Hearing Aids
6.4.2 Smart Hearing Aids
7 Market, By Technology (Page No. - 69)
7.1 Introduction
7.2 Bluetooth
7.3 Wi-Fi
7.4 Others
8 Market, By Application (Page No. - 76)
8.1 Introduction
8.2 Consumer
8.3 Healthcare
8.4 Others
9 Geographical Analysis (Page No. - 81)
9.1 Introduction
9.2 Americas
9.2.1 US
9.2.2 Canada
9.2.3 Mexico
9.2.4 Others
9.3 Europe
9.3.1 Germany
9.3.2 France
9.3.3 Uk
9.3.4 Others
9.4 APAC
9.4.1 China
9.4.2 Japan
9.4.3 South Korea
9.4.4 India
9.4.5 Others
9.5 Rest of the World (RoW)
9.5.1 Middle East
9.5.2 Africa
10 Competitive Landscape (Page No. - 100)
10.1 Overview
10.2 Market Ranking Analysis of the Hearable Devices Market, 2016
10.3 Market (Global) “Competitive Leadership Mapping,” 2017
10.3.1 Introduction
10.3.2 Visionary Leaders
10.3.3 Dynamic Differentiators
10.3.4 Innovators
10.3.5 Emerging Companies
10.4 Competitive Benchmarking
10.4.1 Business Strategies Adopted By Major Players in the Hearable Devices Market (25 Players)
10.4.2 Analysis of Product Portfolio of Major Players in the Market (25 Players)
Top Companies Analyzed for This Study are —Apple Inc.; Audio-Technica, Corp.; Bang & Olufsen A/S; Bose Corp.; Bragi GmbH; Creative Technology Limited; Doppler Labs Inc.; Eargo Inc.; Earin Ab; Gn Store Nord A/S; Harman International Industries Inc.; Jvckenwood USA Corporation; Kanoa; Miracle-Ear, Inc.; Nuheara Ltd.; Samsung Electronics Co., Ltd; Sennheiser Electronics GmbH & Co. Kg; Sivantos Pte Ltd; SkuLLCandy Inc.; Sony Corp.; Starkey Hearing Technology Inc.; Valancell Inc.; Voxx International Corp.; Widex Holding A/S; William Demant Holding A/S
11 Company Profiles (Page No. - 106)
11.1 Introduction
(Business Overview, Products Offered & Services Strategies, Key Insights, Recent Developments, MnM View)*
11.2 Apple, Inc. (US)
11.3 Samsung Electronics Co., Ltd. (South Korea)
11.4 Sony Corporation (Japan)
11.5 Gn Store Nord A/S
11.6 Sennheiser Electronic GmbH & Co. Kg
11.7 Harman International Industries, Incorporated
11.8 Voxx International Corporation
11.9 William Demant Holdings A/S
11.10 Bose Corporation
11.11 Widex Holding A/S
11.12 Key Innovators
11.12.1 Introduction
11.12.2 Bragi GmbH (Germany)
11.12.3 Starkey Hearing Technologies, Inc. (US)
11.12.4 Doppler Labs Inc. (US)
*Details on Business Overview, Products Offered & Services Strategies, Key Insights, Recent Developments, MnM View Might Not Be Captured in Case of Unlisted Companies.
12 Appendix (Page No. - 144)
12.1 Insights of Industry Experts
12.2 Questionnaire
12.3 Knowledge Store: Marketsandmarkets’ Subscription Portal
12.4 Introducing RT: Real-Time Market Intelligence
12.5 Available Customizations
12.6 Related Report
12.7 Author Details
List of Tables (73 Tables)
Table 1 Hearable Devices Market, By Type, 2015–2023 (USD Billion)
Table 2 Market, By Type, 2015–2023 (Million Units)
Table 3 Headset Market, By Type, 2015–2023 (USD Billion)
Table 4 Headset Market, By Type, 2015–2023 (Million Units)
Table 5 Headset Market, By Processing Capability, 2015–2023 (USD Million)
Table 6 Headset Market, By Processing Capability, 2015–2023 (Million Units)
Table 7 Headset Market, By Technology, 2015–2023 (USD Million)
Table 8 Headset Market, By Technology, 2015–2023 (Million Units)
Table 9 Headset Market, By Region, 2015–2023 (USD Billion)
Table 10 Headset Market, By Region, 2015–2023 (Million Units)
Table 11 Market in Americas, By Country, 2015–2023 (USD Million)
Table 12 Headset Market in the Americas, By Country, 2015–2023 (Million Units)
Table 13 Headset Market in Europe, By Country, 2015–2023 (USD Million)
Table 14 Headset Market in Europe, By Country, 2015–2023 (Million Units)
Table 15 Headset Market in APAC, By Country, 2015–2023 (USD Million)
Table 16 Headset Market in APAC, By Country, 2015–2023 (Million Units)
Table 17 Headset Market in RoW, By Country, 2015–2023 (USD Million)
Table 18 Headset Market in RoW, By Country, 2015–2023 (Million Units)
Table 19 Headphone Market, By Technology, 2015–2023 (USD Million)
Table 20 Headphone Market, By Technology, 2015–2023 (Million Units)
Table 21 Headphone Market, By Region, 2015–2023 (USD Billion)
Table 22 Headphone Market, By Region, 2015–2023 (Million Units)
Table 23 Headphone Market in the Americas, By Country, 2015–2023 (USD Million)
Table 24 Headphone Market in the Americas, By Country, 2015–2023 (Million Units)
Table 25 Headphone Market in Europe, By Country, 2015–2023 (USD Million)
Table 26 Headphone Market in Europe, By Country, 2015–2023 (Million Units)
Table 27 Headphone Market in APAC, By Country, 2015–2023 (USD Million)
Table 28 Headphone Market in APAC, By Country, 2015–2023 (Million Units)
Table 29 Headphone Market in RoW, By Country, 2015–2023 (USD Million)
Table 30 Headphone Market in RoW, By Country, 2015–2023 (Million Units)
Table 31 Hearing Aids Market, By Processing Capability, 2015–2023 (USD Billion)
Table 32 Hearing Aids Market, By Processing Capability, 2015–2023 (Million Units)
Table 33 Hearing Aids Market, By Technology, 2015–2023 (USD Million)
Table 34 Hearing Aids Market, By Technology, 2015–2023 (Million Units)
Table 35 Hearing Aids Market, By Region, 2015–2023 (USD Billion)
Table 36 Hearing Aids Market, By Region, 2015–2023 (Million Units)
Table 37 Hearing Aids Market in the Americas, By Country, 2015–2023 (USD Million)
Table 38 Hearing Aids Market in Americas, By Country, 2015–2023 (Million Units)
Table 39 Hearing Aids Market in Europe, By Country, 2015–2023 (USD Million)
Table 40 Hearing Aids Market in Europe, By Country, 2015–2023 (Million Units)
Table 41 Hearing Aids Market in APAC, By Country, 2015–2023, (USD Million)
Table 42 Hearing Aids Market in APAC, By Country, 2015–2023 (Million Units)
Table 43 Hearing Aids Market in RoW, By Country, 2015–2023 (USD Million)
Table 44 Hearing Aids Market in RoW, By Country, 2015–2023 (Million Units)
Table 45 Market, By Technology, 2015–2023 (USD Million)
Table 46 Market, By Technology, 2015–2023 (Million Units)
Table 47 Bluetooth Hearable Devices Market, By Product, 2015–2023 (USD Million)
Table 48 Bluetooth Hearable Devices Market, By Product, 2015–2023 (Million Units)
Table 49 Wi-Fi Hearable Devices Market, By Product, 2015–2023 (USD Million)
Table 50 Wi-Fi Hearable Devices Market, By Product, 2015 –2023, (Million Units)
Table 51 Others Technology Hearable Devices Market, By Product, 2015–2023 (USD Million)
Table 52 Others Technology Hearable Devices Market, By Product, 2015 –2023, (Million Units)
Table 53 Market, By Application, 2015–2023 (USD Million)
Table 54 Market, By Application, 2015–2023 (Million Units)
Table 55 Market, By Region, 2015–2023 (USD Billion)
Table 56 Market, By Region, 2015–2023 (Million Units)
Table 57 Americas Hearable Devices Market, By Product, 2015–2023 (USD Million)
Table 58 Americas Market, By Product, 2015–2023, (Million Units)
Table 59 Americas Market, By Country, 2015–2023 (USD Million)
Table 60 Market in the Americas, By Country, 2015–2023 (Million Units)
Table 61 Europe Hearable Devices Market, By Product, 2015–2023 (USD Million)
Table 62 Europe Market, By Product, 2015–2023 (Million Units)
Table 63 European Market, By Country, 2015–2023 (USD Million)
Table 64 European Market, By Country, 2015–2023 (Million Units)
Table 65 APAC Hearable Devices Market, By Product, 2015–2023 (USD Million)
Table 66 APAC Market, By Product, 2015–2023 (Million Units)
Table 67 APAC Market, By Country, 2015–2023 (USD Million)
Table 68 APAC Market, By Country, 2015–2023 (Million Units)
Table 69 RoW Hearable Devices Market, By Product, 2015–2023 (USD Million)
Table 70 RoW Market, By Product, 2015–2023 (Million Units)
Table 71 RoW Market, By Geography, 2015–2023 (USD Million)
Table 72 RoW Market, By Geography, 2015–2023 (Million Units)
Table 73 Ranking Analysis of the Players in the Market in 2016
List of Figures (48 Figures)
Figure 1 Hearable Devices Market Segmentation
Figure 2 Research Flow
Figure 3 Market: Research Design
Figure 4 Market Size Estimation: Bottom-Up Approach
Figure 5 Market Size Estimation: Top-Down Approach
Figure 6 Data Triangulation
Figure 7 Market for Headset is Expected to Grow at the Highest Rate Between 2017 and 2023
Figure 8 Market for Earbuds to Grow at A Higher Rate Between 2017–2023
Figure 9 Market for Bluetooth Headset is Expected to Grow at the Highest CAGR During the Forecast Period
Figure 10 Market for Bluetooth Headphone is Expected to Grow at the Highest CAGR During the Forecast Period
Figure 11 Market for Digital Hearing Aids is Expected to Grow at the Highest CAGR During the Forecast Period
Figure 12 Market in Consumer Application is Expected to Grow at the Highest CAGR During the Forecast Period
Figure 13 Americas Accounted for the Largest Market Share in 2016
Figure 14 Headsets to Grow at the Fastest Rate During the Forecast Period
Figure 15 Market for Bluetooth in Headset to Grow at A Higher Rate Between 2017–2023
Figure 16 Smart Hearing Aids is Expected to Grow at the Highest CAGR During the Forecast Period
Figure 17 Hearable Devices Market in APAC is Expected to Grow at the Highest CAGR During the Forecast Period
Figure 18 in APAC, Indian Market is Expected to Grow at the Highest CAGR During the Forecast Period
Figure 19 Market: Drivers, Restraints, Opportunities, Challenges
Figure 20 Global Smartphone Shipment, 2013–2016 (Million Units)
Figure 21 Global Wearable Devices Market, 2015–2022 (USD Billion)
Figure 22 Major Value is Added During Manufacturing and Distribution Stages
Figure 23 Market, By Product
Figure 24 Market for Headset is Expected to Grow at the Highest Rate During the Forecast Period
Figure 25 Market for Earbuds to Grow at A Higher Rate Between 2017–2023
Figure 26 Headset Market for Bluetooth Technology to Grow at A Higher Rate Between 2017–2023
Figure 27 Headphone Market in APAC to Grow at the Highest Rate Between 2017–2023
Figure 28 Hearing Aids Market for Digital Technology to Grow at A Higher Rate Between 2017–2023
Figure 29 Hearable Devices Market, By Technology
Figure 30 Market for Bluetooth in Headset to Grow at A Higher Rate Between 2017–2023
Figure 31 Market, By Application
Figure 32 Market for Consumer Application to Grow at the Highest Rate During the Forecast Period
Figure 33 Geographic Snapshot: Rapidly Growing Countries Such as India and China Emerging as High-Potential Markets (2017–2023)
Figure 34 Market in APAC Estimated to Grow at the Highest Rate Between 2017 and 2023
Figure 35 Americas: Market Snapshot (2017–2023)
Figure 36 Europe: Market Snapshot (2017–2023)
Figure 37 APAC: Market Snapshot (2017–2023)
Figure 38 RoW: Market Snapshot (2017–2023)
Figure 39 Companies Adopted New Product Launches as the Key Growth Strategy Over the Last Four Years (2013–2017)
Figure 40 Market (Global) “Competitive Leadership Mapping,” 2017
Figure 41 Apple, Inc.: Company Snapshot (2016)
Figure 42 Samsung Electronics Co., Ltd.: Company Snapshot (2016)
Figure 43 Sony Corporation: Company Snapshot (2016)
Figure 44 GN Store Nord A/S: Company Snapshot
Figure 45 Sennheiser Electronic GmbH & Co. Kg: Company Snapshot
Figure 46 Harman International Industries, Inc.: Company Snapshot
Figure 47 Voxx International Corporation: Company Snapshot
Figure 48 William Demant Holdings A/S: Company Snapshot
During this research , major players of the hearable devices ecosystem in various regions have been identified, and their offerings, regional presence, and distribution channels have been understood through in-depth discussions. To find the overall market size, top-down and bottom-up approaches have been used to estimate the sizes of other individual markets by using percentage splits from secondary sources such as Hoovers, Bloomberg Business, Factiva, and OneSource and primary research. The entire procedure includes the study of the annual and financial reports of the top market players and extensive interview of industry leaders such as CEOs, VPs, directors, and marketing executives for key insights (both qualitative and quantitative) pertaining to the market. The figure below shows the breakdown of the primaries on the basis of the company type, designation, and region conducted during the research .
To know about the assumptions considered for the study, download the pdf brochure
The ecosystem of the hearable devices market comprises a network of R&D institutions, manufacturers, technology integrators, and distributors among others. The key companies in the market are Apple Inc. (US), Samsung Electronics Co., Ltd. (South Korea), Sennheiser Electronics GmBH, co. kg (Germany), Sony Corporation (Japan), and GN Store Nord A/S (Denmark). Prominent companies in the market include the well-established, financially stable and technically expertise players that have been operating in the industry for several years and have diversified product portfolios, proprietary technologies, and strong distribution networks through collaborations and acquisitions.
Target Audience:
- Companies in the hearing aids market
- Smartphone and audio devices companies
- Government and financial institutions as well as investment community
- Analysts and strategic business planners
- End users that want to know more about hearables and the latest technological developments in this industry
- Research and consulting firms
Report Scope:
By Product:
- Headphone
-
Headset
-
By Type
- Traditional Headset
- Earbuds
-
By Processing Capabilities
- Smart
- Regular
-
By Type
-
Headphone
-
By Processing Capabilities
- Smart
- Regular
-
By Processing Capabilities
By Technology:
- Bluetooth
- Wi-Fi
- Others
By Application:
- Consumer
- Healthcare
- Others
Geography:
- America
- Europe
- APAC
- Rest of the World (RoW)
Available Customizations:
With the given market data, MarketsandMarkets offers customizations according to the client’s specific needs. The following customization options are available for the report:
Geographic Analysis
- Further analysis of the hearable devices market for additional countries
Company Information
- Detailed analysis and profiling of additional market players (up to 5)


Growth opportunities and latent adjacency in Hearable Devices Market