Hardware Encryption Market Size, Share, Trends

Hardware Encryption Market Size, Share, Trends & Industry Growth Analysis Report by Product Type (External HDD, Internal HDD, SSD, Inline Network Encryptor, USB Flash Drive), Application (Consumer Electronics, Aerospace & Defense, Transportation, Healthcare) and Region – Forecast to 2027

Report Code: SE 1876 Dec, 2022, by marketsandmarkets.com

Updated on : Oct 23, 2024

Hardware Encryption Market Size & Growth

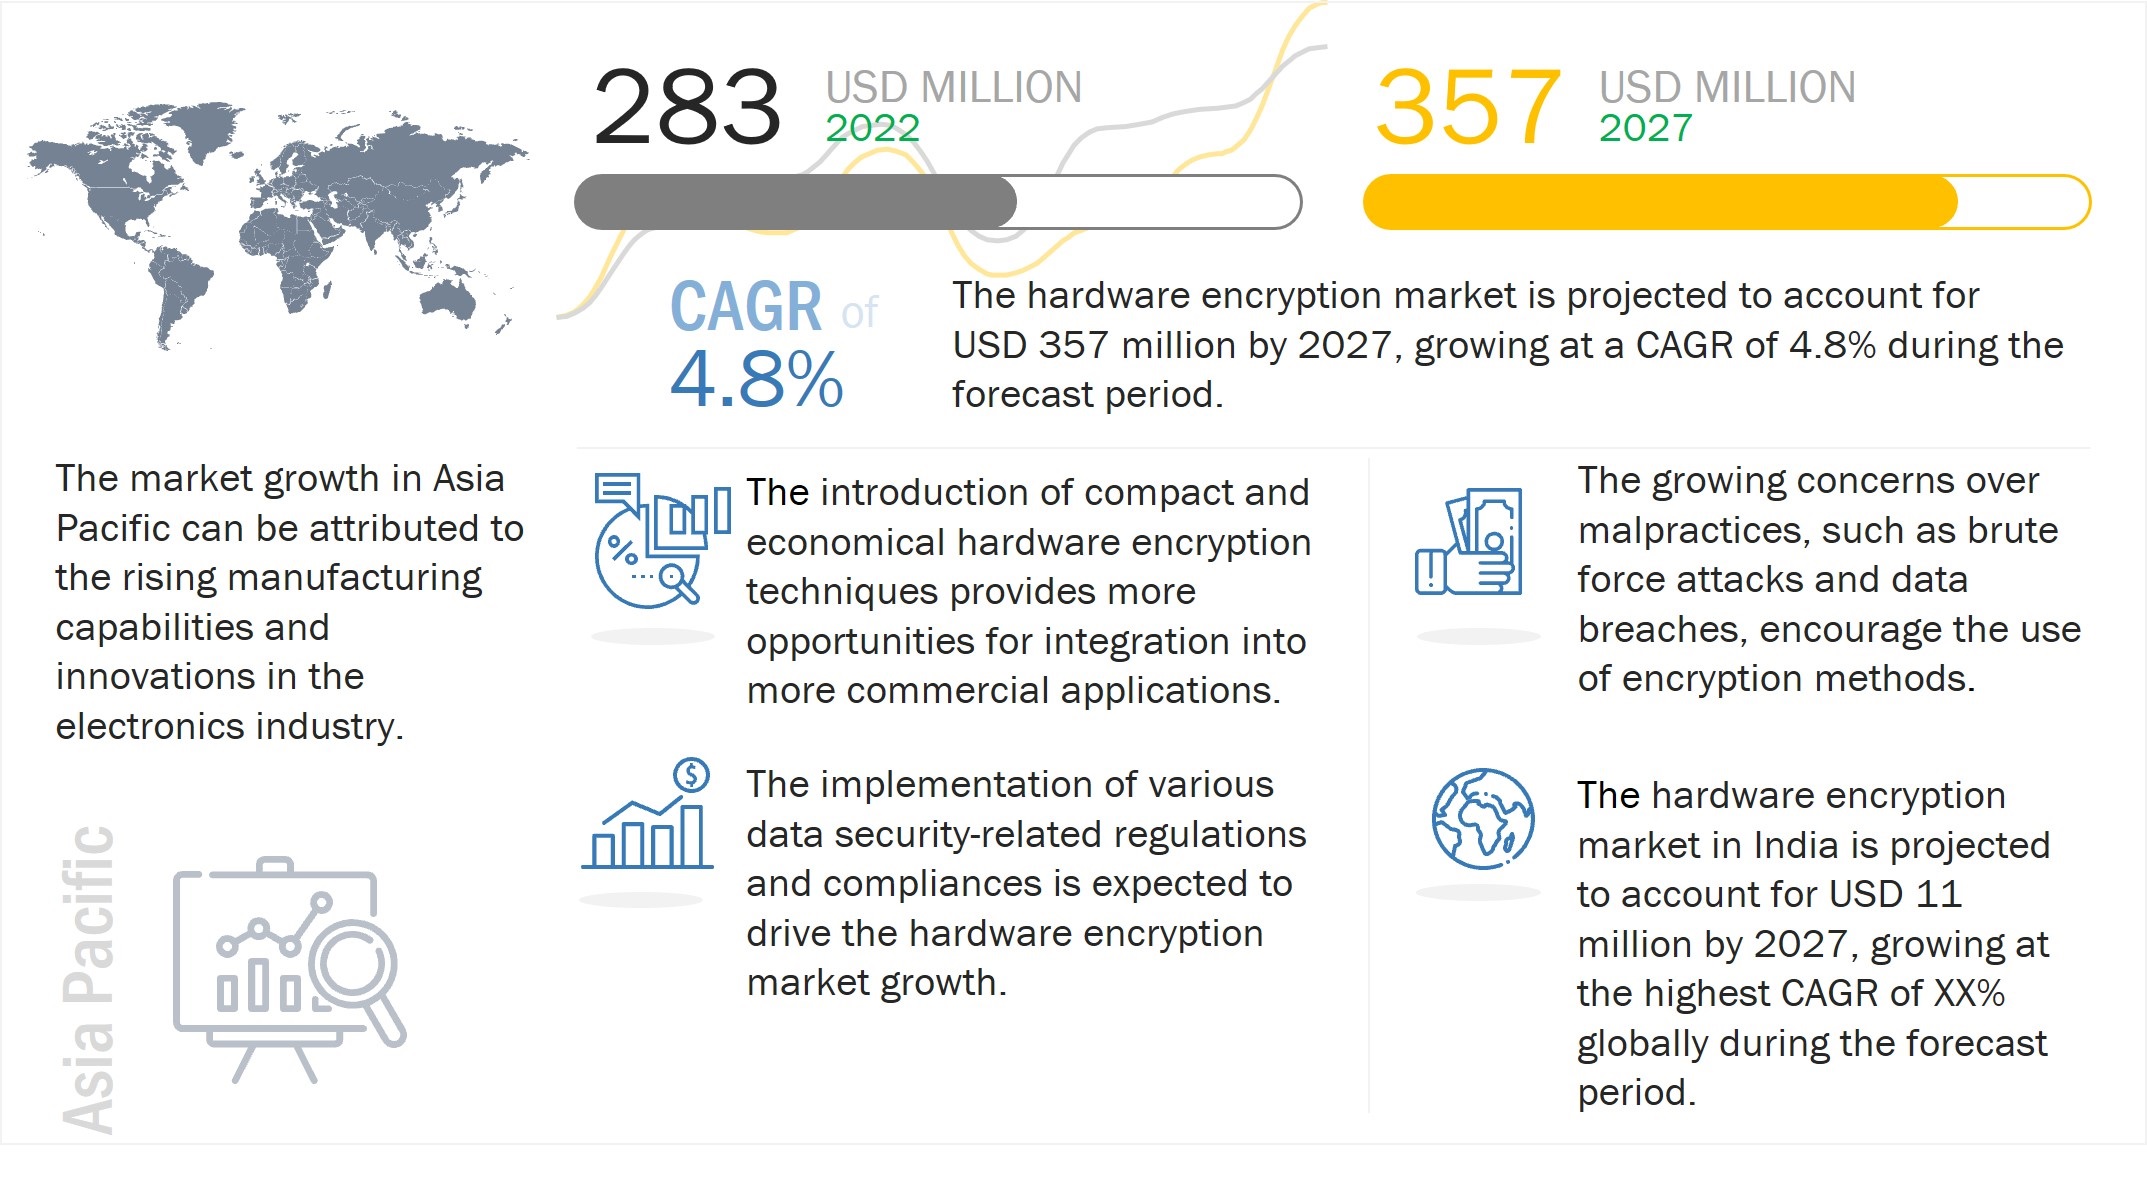
The global hardware encryption market size is expected to reach USD 357 million by 2027, growing at a CAGR of 4.8% during the forecast period. The growth of this market is driven by factors such as compliance with data privacy security regulations and standards, increasing apprehension over data security and confidentiality, and development of digital content.
Hardware Encryption Market

Hardware Encryption Market Forecast to 2027

To know about the assumptions considered for the study, Request for Free Sample Report

Hardware Encryption Market Dynamics

Drivers: Development of digital content

With the emergence of the smart city concept worldwide, the use of information and communications has become more digitalized, leading to the enhancement of digital content. The concept of smart cities includes smart transport, smart energy, smart water, and smart healthcare. These smart cities use various IoT technologies such as radio-frequency identification (RFID) sensors, cloud computing, and wireless networks to gather and analyze information about environmental factors, transportation, water supply, public safety, and hospitals to enhance the quality of life.

Thus, with the emergence of smart cities, there is a growing concern over data loss and the exchange of secure information or storage. Digital content is expanding globally, and the Internet era is evolving with the introduction and adoption of cloud computing, IoT, big data analytics, and others. Also, the increasing adoption of smartphones, e-cash, e-tailing, video surveillance, and digital marketing is further adding to the expansion of digital content. Continuous technological advancements and the introduction and application of IoT in the present lifestyle have significantly enhanced digital content. Data has become the currency of the new economy. With increasing flexibility becoming available in the usage and storage of data, the need for secured storage and hardware encryption to protect against cyberattacks, online spying, cyber espionage, and other security-related threats is growing. Thus, the expansion and management of digital content are driving the growth of the hardware encryption industry.

Restraints: Heavy capital investments by stakeholders

Substantial capital investments are required for the installation and maintenance of hardware-based encryption technology. This type of encryption involves the installation of encryption under HDDs to ensure a high level of protection. It comprises installing a dedicated network platform to protect various storage systems, desktops, laptops, and tablets.

It also involves the installation of firmware and cryptographic processors into the devices, along with the use of algorithms and standards and architectures. The total installation cost of installing hardware encryption technology includes licensing cost, annual maintenance cost, OPAL fees, pre-provisioning cost, staging cost, the technical cost for a password reset, user idle time cost for encryption, user excess operating cost, and technical cost for the assistance of expert administration of encrypted drives. However, hardware-based encryption is gaining traction with the growing concern over secure data storage. Players in the hardware encryption market are launching economic products, because of which the average cost of a single hardware-encrypted device has begun declining. Technological innovations have also helped reduce the average cost of installing hardware encryption. Also, with rapid technological advancements, the impact of high capital investments is reducing at a fast pace but needs to be reduced much more for it to no longer remain an impediment to the growth of the market.

Opportunities: Substantial development and growth of IoT in various industries

IoT has witnessed significant technological innovation and commercialization in all fields. IoT is used in day-to-day activities with its commercialized application in agriculture, consumer electronics, transportation, military and defense, telecommunications, medical, energy, finance, and aerospace. IoT also plays an integral part in various emerging concepts, such as smart cities, digital marketing, and others.

IoT demands large-scale management and protection of digital certificates and the underlying keys and supports multiple public-key algorithms, including Elliptic Curve Crypto (ECC), whose shorter key lengths and less intensive computational power are well suited for constrained IoT devices, all supported by a well-designed public key infrastructure (PKI). The accepted PKI best practice to secure the most sensitive keys and business processes is to use an HSM.

IoT involves the interaction between M2M and machine-to-humans, -objects, -environment, and -infrastructure. IoT devices are used to monitor machinery, employees, and environmental conditions in power stations, network gateways, avionics, wireless base stations, and others. The data acquired helps analyze, control, prevent risks, avoid economic losses, and assist in effective and efficient decision-making.

Since IoT finds applications across all sectors, it is exposed to various threats, such as unauthorized use and data manipulation. For instance, following the introduction of 4G LTE mobile networks, automobiles use IoT to provide real-time information on traffic conditions, navigation services, remote engine start facilities, and other related services. In this case, any manipulation or unauthorized use of data can cause accidents and traffic outrage. Thus, the increasing adoption of IoT devices in various fields is driving the need to protect data at all levels and provide end-to-end encryption to secure the exchange of information. Thus, the commercialization of IoT is providing a growth opportunity for the hardware encryption market.

Challenges: Adoption of SED and TPM in current processors

Strong user authentication is critical for better security. With a Software Encryption Drive (SED), access to the platform is based on secure authorization from the SED and not by the software that can be fooled into allowing unauthorized access to data. Mixing hardware-based encryption with Trusted Platform Modules (TPMs) can provide even stronger security benefits. By combining hardware-based technologies such as SEDs with TPMs, enterprises add another layer of security to their systems, ensuring that the possibility of any loss of data is drastically reduced. Clients prefer SEM and TPM over hardware encryption considering the security benefits and less hardware equipment, which helps in space optimization.

Hardware Encryption Industry Overview

The hardware encryption market is a rapidly growing sector focused on securing data through dedicated hardware solutions. This market encompasses a range of devices, including encrypted USB drives, SSDs, and security modules, which offer superior protection compared to software-based encryption. Growth is driven by rising cybersecurity threats, regulatory mandates, and increasing data sensitivity across industries like finance, healthcare, and government.

Hardware Encryption Market Analysis

The hardware encryption market is experiencing robust growth driven by increasing concerns over data security and stringent regulatory requirements. As cyber threats become more sophisticated, enterprises are investing in hardware-based encryption solutions for enhanced protection. Key sectors such as finance, healthcare, and government are leading the adoption, aiming to safeguard sensitive information. Technological advancements, including the integration of encryption with SSDs and the rise of IoT devices, are further propelling market expansion.
 

Hardware Encryption Market Trends

The hardware encryption market is marked by several key trends shaping its evolution. One prominent trend is the integration of encryption capabilities into SSDs and other storage devices, offering seamless security without compromising performance. The rise of Internet of Things (IoT) devices is also driving demand for hardware encryption to protect vast amounts of sensitive data. Additionally, there is a growing emphasis on regulatory compliance, pushing organizations to adopt robust encryption solutions.

Hardware Encryption Market Share

Consumer Electronics is expected to hold the largest share of hardware encryption market for during the forecast period

The market for consumer electronics application segment accounted for the largest share of ~41% of the market in 2021 and is expected to retain its position as the highest during the forecast period from 2022 to 2027. Hardware encryption is used in electronic devices such as desktops, smartphones, notebooks, laptops, and tablets, among others.

All electronic equipment with digital storage, either magnetic or solid-state, can have hardware encryption enabled. The products mostly used for hardware encryption in consumer electronic devices include SSDs and HDDs. This is attributed to the emergence of bring-your-own-devices (BYOD) across several organizations and other consumer electronic devices such as laptops, tablets, and smartphones, which is expected to generate the need for hardware-encrypted security.

Hardware Encryption Market - Regional Analysis

Asia Pacific to hold the largest share of hardware encryption market for in 2022

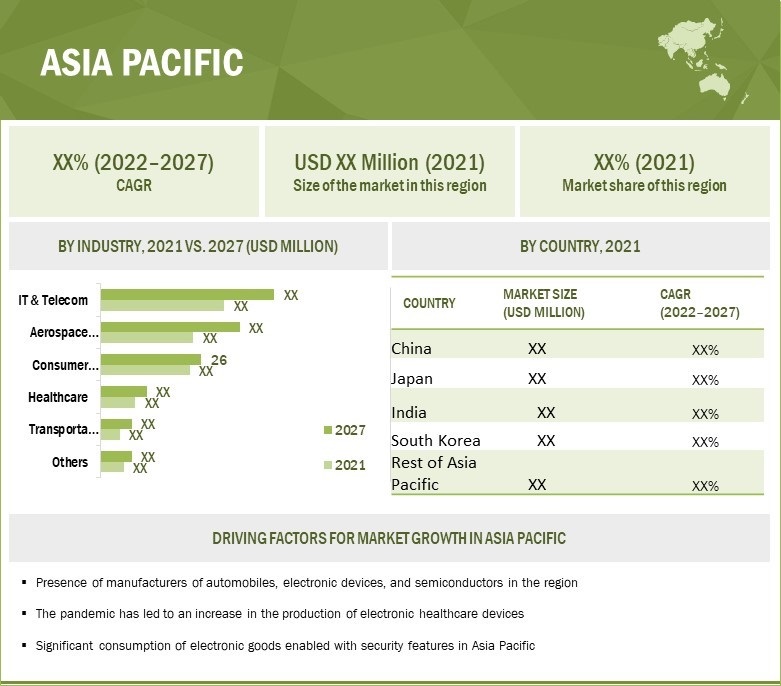
The market in Asia Pacific holds the largest market share and is expected to retain its position during the forecast period growing at the highest CAGR of 5.5% from 2022 to 2027. The growth of the market in this region can be attributed to the emergence of several manufacturers of electronic devices in the region, along with the expansion of IT and telecom networks in China, South Korea, India, and other emerging economies of the region.

Asia Pacific is a hub for several companies manufacturing consumer electronics, such as smartphones, as well as providers of advanced ICT technologies. Companies in Asia Pacific are adopting hardware encryption technology for data security and protection. Moreover, the significant number of ongoing smart city projects in the countries of the region is also expected to fuel the growth of the hardware encryption market in Asia Pacific during the forecast period.
Hardware Encryption Market by Region

Hardware Encryption Market by Region

To know about the assumptions considered for the study, download the pdf brochure

Top Hardware Encryption Companies - Key Market Players

Some of the key hardware encryption companies are include Western Digital Technologies, Inc. (US), Samsung Electronics Co., Ltd. (South Korea), Micron Technology, Inc. (US), Kingston Technology Corporation (US), Seagate Technology Holdings PLC (US), NetApp, Inc. (US), KIOXIA Holdings Corporation (Japan), Kanguru Solutions (US), Intel Corporation (US), WinMagic Inc. (Canada), Maxim Integrated Products, Inc. (US), Thales e-Security, Inc. (US), McAfee, LLC (US), and so on.

Hardware Encryption Market Report Scope

Report Metric

Details

Estimated Market Size
 
USD 271 million
Projected Market Size USD 357 million
Hardware Encryption Market Growth Rate CAGR of 4.8%

Years Considered

2022–2027

  Base Year

2021

  Forecast Period

2022–2027

  Forecast Units

Value (USD Million)

  Segments Covered

Architecture, Product, Application, and Geography

  Geographies Covered

North America, Europe, Asia Pacific, and RoW


Companies Covered

Western Digital Technologies, Inc. (US), Samsung Electronics Co., Ltd. (South Korea), Micron Technology, Inc. (US), Kingston Technology Corporation (US), Seagate Technology Holdings PLC (US), NetApp, Inc. (US), KIOXIA Holdings Corporation (Japan), Kanguru Solutions (US), Intel Corporation (US), WinMagic Inc. (Canada), Maxim Integrated Products, Inc. (US), Thales e-Security, Inc. (US), McAfee, LLC (US), Broadcom Inc. (US), International Business Machines Corporation (US), etc.

Total 25 Major Players

Hardware Encryption Market Highlights

In this research report, the market has been segmented based on Architecture, Product, Application, and Geography.

Aspect

Details

Hardware Encryption Market, by Architecture:

  • Field-Programmable Gate Arrays
  • Application-Specific Integrated Circuits

Market, by Product:

  • External Hard Disk Drive
  • Internal Hard Disk Drive
  • Solid-State Drive
  • Inline Network Encryptor
  • USD Flash Drive

Market, by Application:

  • Consumer Electronics
  • IT & Telecom
  • Transportation
  • Aerospace & Defense
  • Healthcare
  • Others (Other applications include retail, education, BFSI, manufacturing, and consulting)

Geographic Analysis:

  • North America
    • US
    • Canada
    • Mexico
  • Europe
    • Germany
    • Italy
    • Netherlands
    • France
    • UK
    • Rest of Europe
  • Asia Pacific
    • China
    • South Korea
    • Japan
    • India
    • Rest of APAC
  • RoW
    • Middle East & Africa
    • South Americ

Recent Developments in Hardware Encryption Industry

  • In May 2022, Western Digital Technologies, Inc. (US) and Kioxia Holdings Corporation (Japan) entered an agreement to jointly invest in the first phase of the Fab7 (Y7) factory at Kioxia’s Yokkaichi Plant campus in the Mie Prefecture of Japan. Y7 is the sixth flash memory factory at the Yokkaichi Plant campus, which is one of the world’s largest flash memory manufacturing sites. The first phase of the Y7 facility will produce 3D flash memory devices, including 112- and 162-layer nodes.
  • In May 2022, Micron Technology, Inc. announced the upcoming availability of two new consumer storage products, the Crucial P3 Plus Gen4 NVMe and Crucial P3 NVMe solid-state drives (SSDs), as an expansion of its Crucial NVMe SSD product portfolio. The new Crucial P3 Plus SSD product line will deliver sequential read/write speeds up to 5000/4200 MB/s1, while next-generation Crucial P3 SSDs will provide read/write speeds up to 3500/3000 MB/s1.
  • In March 2021, Samsung Electronics Co., Ltd. (South Korea) launched 980NVMe, a new addition to the SSD portfolio, the company’s first consumer drive without DRAM, with more speed and access to a wider range of users.

Frequently Asked Questions (FAQs):

To speak to our analyst for a discussion on the above findings, click Speak to Analyst


Exclusive indicates content/data unique to MarketsandMarkets and not available with any competitors.

TABLE OF CONTENTS
 
1 INTRODUCTION (Page No. - 26)
    1.1 STUDY OBJECTIVES 
    1.2 MARKET DEFINITION 
           1.2.1 INCLUSIONS AND EXCLUSIONS
    1.3 STUDY SCOPE 
           1.3.1 MARKETS COVERED
                    FIGURE 1 MARKET SEGMENTATION: HARDWARE ENCRYPTION MARKET
           1.3.2 GEOGRAPHIC SCOPE
           1.3.3 YEARS CONSIDERED
    1.4 CURRENCY CONSIDERED 
    1.5 STAKEHOLDERS 
    1.6 SUMMARY OF CHANGES 
 
2 RESEARCH METHODOLOGY (Page No. - 30)
    2.1 RESEARCH DATA 
           FIGURE 2 RESEARCH DESIGN
           2.1.1 SECONDARY AND PRIMARY RESEARCH
                    2.1.1.1 Key industry insights
           2.1.2 SECONDARY DATA
                    2.1.2.1 List of major secondary sources
                    2.1.2.2 Secondary sources
           2.1.3 PRIMARY DATA
                    2.1.3.1 Breakdown of primaries
                    2.1.3.2 Primary interviews with experts
                    2.1.3.3 Key data from primary sources
    2.2 MARKET SIZE ESTIMATION 
           2.2.1 BOTTOM-UP APPROACH
                    FIGURE 3 MARKET SIZE ESTIMATION METHODOLOGY: BOTTOM-UP APPROACH
                    2.2.1.1 Approach for capturing market share using bottom-up analysis (demand-side)
           2.2.2 TOP-DOWN APPROACH
                    FIGURE 4 APPROACH FOR CAPTURING MARKET SIZE FROM SUPPLY-SIDE
                    FIGURE 5 MARKET SIZE ESTIMATION METHODOLOGY: TOP-DOWN APPROACH
                    2.2.2.1 Approach for capturing market share using top-down analysis (supply-side)
    2.3 MARKET BREAKDOWN AND DATA TRIANGULATION 
           FIGURE 6 DATA TRIANGULATION: HARDWARE ENCRYPTION MARKET
    2.4 RESEARCH ASSUMPTIONS 
    2.5 LIMITATIONS 
    2.6 RISK ASSESSMENT 
 
3 EXECUTIVE SUMMARY (Page No. - 42)
    FIGURE 7 APPLICATION-SPECIFIC INTEGRATED CIRCUITS TO ACCOUNT FOR LARGER SIZE OF HARDWARE ENCRYPTION MARKET FROM 2022 TO 2027
    FIGURE 8 INLINE NETWORK ENCRYPTORS TO DOMINATE MARKET DURING FORECAST PERIOD
    FIGURE 9 TRANSPORTATION APPLICATION SEGMENT TO WITNESS HIGHEST CAGR DURING FORECAST PERIOD
    FIGURE 10 MARKET IN ASIA PACIFIC TO SHOW HIGHEST CAGR DURING FORECAST PERIOD
 
4 PREMIUM INSIGHTS (Page No. - 46)
    4.1 MAJOR OPPORTUNITIES FOR PLAYERS IN HARDWARE ENCRYPTION MARKET 
           FIGURE 11 GROWING DATA SECURITY CONCERNS TO CREATE DEMAND FOR MARKET DURING FORECAST PERIOD
    4.2 HARDWARE ENCRYPTION MARKET, BY PRODUCT 
           FIGURE 12 MARKET FOR SOLID-STATE DRIVES TO GROW AT HIGHEST CAGR DURING FORECAST PERIOD
    4.3 MARKET, BY APPLICATION 
           FIGURE 13 CONSUMER ELECTRONICS APPLICATION EXPECTED TO BE LARGEST MARKET SEGMENT IN 2022
    4.4 MARKET IN ASIA PACIFIC, BY INDUSTRY AND COUNTRY 
           FIGURE 14 IT & TELECOM AND CHINA ACCOUNTED FOR LARGEST SHARES OF MARKET IN 2021
    4.5 HARDWARE ENCRYPTION MARKET, BY COUNTRY 
           FIGURE 15 MARKET IN INDIA EXPECTED TO GROW AT HIGHEST CAGR DURING FORECAST PERIOD
 
5 MARKET OVERVIEW (Page No. - 49)
    5.1 INTRODUCTION 
    5.2 MARKET DYNAMICS 
           5.2.1 DRIVERS
                    5.2.1.1 Increasing apprehension over data security and confidentiality
                    5.2.1.2 Compliance with data privacy/security regulations and standards
                    5.2.1.3 Development of digital content
           5.2.2 RESTRAINTS
                    5.2.2.1 Heavy capital investments by stakeholders
           5.2.3 OPPORTUNITIES
                    5.2.3.1 Extensive acceptance of cloud computing
                    5.2.3.2 Substantial development and growth of IoT in various industries
           5.2.4 CHALLENGES
                    5.2.4.1 Lower buyer responsiveness and awareness of hardware encryption technology
                    5.2.4.2 Adoption of SED and TPM in current processors
    5.3 TRENDS/DISRUPTIONS IMPACTING CUSTOMER BUSINESS 
           5.3.1 REVENUE SHIFT AND NEW REVENUE POCKETS FOR HARDWARE ENCRYPTION PRODUCT PROVIDERS
    5.4 PRICING ANALYSIS 
           5.4.1 AVERAGE SELLING PRICE OF HARDWARE ENCRYPTION PRODUCTS
                    FIGURE 18 AVERAGE SELLING PRICE OF HARDWARE ENCRYPTION PRODUCTS OFFERED BY KEY PLAYERS
                    TABLE 1 AVERAGE SELLING PRICE OF HARDWARE ENCRYPTION PRODUCTS OFFERED BY KEY PLAYERS (USD)
           5.4.2 AVERAGE SELLING PRICE TREND
                    FIGURE 19 HARDWARE ENCRYPTION MARKET: AVERAGE PRICE OF HARDWARE ENCRYPTION ICS
    5.5 VALUE CHAIN ANALYSIS 
           FIGURE 20 VALUE CHAIN ANALYSIS: HARDWARE ENCRYPTION
    5.6 ECOSYSTEM/MARKET MAP 
           FIGURE 21 HARDWARE ENCRYPTION MARKET: ECOSYSTEM
    5.7 TECHNOLOGY ANALYSIS 
           5.7.1 HARDWARE ENCRYPTION
           5.7.2 SUBSTITUTE TECHNOLOGY
    5.8 CASE STUDY ANALYSIS 
           5.8.1 HOW SELF-ENCRYPTING DRIVES SUPPORT GOVERNMENT WORKERS
           5.8.2 KEEPING DATA SECURE ON FRONT LINE OR BEHIND SCENES
    5.9 PATENT ANALYSIS 
           FIGURE 22 TOP 10 COMPANIES WITH HIGHEST PERCENTAGES OF PATENT APPLICATIONS IN LAST 10 YEARS
           TABLE 2 TOP 10 PATENT OWNERS IN US IN LAST 10 YEARS
           FIGURE 23 NUMBER OF PATENTS GRANTED PER YEAR FROM 2011 TO 2021
           5.9.1 LIST OF MAJOR PATENTS
                    TABLE 3 LIST OF MAJOR PATENTS IN HARDWARE ENCRYPTION MARKET
    5.10 TRADE AND TARIFF ANALYSIS 
           5.10.1 TRADE ANALYSIS
                    5.10.1.1 Trade data for HS code 8542
                                FIGURE 24 IMPORT DATA, BY COUNTRY, 2017−2021 (USD MILLION)
                                FIGURE 25 EXPORT DATA, BY COUNTRY, 2017−2021 (USD MILLION)
                    5.10.1.2 Trade data for HS code 8523
                                FIGURE 26 IMPORT DATA, BY COUNTRY, 2017−2021 (USD MILLION)
                                FIGURE 27 EXPORT DATA, BY COUNTRY, 2017−2021 (USD MILLION)
           5.10.2 TARIFF ANALYSIS
                    TABLE 4 MFN TARIFF FOR ELECTRONIC INTEGRATED CIRCUITS, PARTS THEREOF, BY HONG KONG, 2021
                    TABLE 5 MFN TARIFF FOR ELECTRONIC INTEGRATED CIRCUITS, PARTS THEREOF, BY TAIPEI, 2021
                    TABLE 6 MFN TARIFF FOR ELECTRONIC INTEGRATED CIRCUITS, PARTS THEREOF, BY CHINA, 2021
                    TABLE 7 MFN TARIFF FOR DISCS, TAPES, SOLID-STATE NON-VOLATILE STORAGE DEVICES, SMART CARDS, AND OTHER MEDIA, BY REPUBLIC OF KOREA, 2021
                    TABLE 8 MFN TARIFF FOR DISCS, TAPES, SOLID-STATE NON-VOLATILE STORAGE DEVICES, SMART CARDS, AND OTHER MEDIA, BY TAIPEI, 2021
                    TABLE 9 MFN TARIFF FOR DISCS, TAPES, SOLID-STATE NON-VOLATILE STORAGE DEVICES, SMART CARDS, AND OTHER MEDIA, BY US, 2021
    5.11 KEY CONFERENCES AND EVENTS, 2023–2024 
           TABLE 10 HARDWARE ENCRYPTION MARKET: DETAILED LIST OF CONFERENCES AND EVENTS
    5.12 REGULATORY LANDSCAPE 
           5.12.1 ADVANCED ENCRYPTION STANDARDS
           5.12.2 GENERAL DATA PROTECTION REGULATION
           5.12.3 PAYMENT CARD INDUSTRY DATA SECURITY STANDARD
           5.12.4 HEALTH INSURANCE PORTABILITY AND ACCOUNTABILITY ACT
           5.12.5 FEDERAL INFORMATION SECURITY MANAGEMENT ACT
           5.12.6 FEDERAL INFORMATION PROCESSING STANDARDS
           5.12.7 SARBANES-OXLEY ACT
           5.12.8 GRAMM-LEACH-BLILEY ACT
    5.13 PORTER’S FIVE FORCES ANALYSIS 
           TABLE 11 IMPACT OF PORTER’S FIVE FORCES ON HARDWARE ENCRYPTION MARKET
           FIGURE 28 PORTER’S FIVE FORCES ANALYSIS: HARDWARE ENCRYPTION
           5.13.1 THREAT OF NEW ENTRANTS
           5.13.2 THREAT OF SUBSTITUTES
           5.13.3 BARGAINING POWER OF SUPPLIERS
           5.13.4 BARGAINING POWER OF BUYERS
           5.13.5 INTENSITY OF COMPETITIVE RIVALRY
    5.14 KEY STAKEHOLDERS AND BUYING CRITERIA 
           5.14.1 KEY STAKEHOLDERS IN BUYING PROCESS
                    FIGURE 29 INFLUENCE OF STAKEHOLDERS IN BUYING PROCESS FOR TOP 3 APPLICATIONS
                    TABLE 12 INFLUENCE OF STAKEHOLDERS IN BUYING PROCESS FOR TOP 3 INDUSTRIES (%)
           5.14.2 BUYING CRITERIA
                    FIGURE 30 KEY BUYING CRITERIA FOR TOP 3 APPLICATIONS
                    TABLE 13 KEY BUYING CRITERIA FOR TOP 3 APPLICATIONS
 
6 ALGORITHMS AND STANDARDS RELATED TO HARDWARE ENCRYPTION (Page No. - 80)
    6.1 INTRODUCTION 
    6.2 ADVANCED ENCRYPTION STANDARD 
    6.3 RIVEST, SHAMIR, AND ADLEMAN ALGORITHM 
    6.4 OTHERS 
           6.4.1 DATA ENCRYPTION STANDARD
           6.4.2 SECURE HASH ALGORITHMS
           6.4.3 ELLIPTIC CURVE CRYPTOGRAPHY
           6.4.4 DIGITAL SIGNATURE ALGORITHM
 
7 HARDWARE ENCRYPTION MARKET, BY ARCHITECTURE (Page No. - 84)
    7.1 INTRODUCTION 
           FIGURE 31 MARKET: BY ARCHITECTURE
           FIGURE 32 APPLICATION-SPECIFIC INTEGRATED CIRCUITS TO ACCOUNT FOR LARGER SIZE OF HARDWARE ENCRYPTION MARKET FROM 2022 TO 2027
    7.2 FIELD-PROGRAMMABLE GATE ARRAYS 
           7.2.1 FLEXIBILITY AND AGILITY OF FPGA MAKE IT IDEAL FOR HARDWARE ENCRYPTION APPLICATIONS
    7.3 APPLICATION-SPECIFIC INTEGRATED CIRCUITS 
           7.3.1 ASIC CIRCUITS ARE DOMINANTLY USED IN INDUSTRIAL AND COMMERCIAL APPLICATIONS
 
8 HARDWARE ENCRYPTION MARKET, BY PRODUCT (Page No. - 88)
    8.1 INTRODUCTION 
           FIGURE 33 MARKET: BY PRODUCT
           FIGURE 34 INLINE NETWORK ENCRYPTORS TO ACCOUNT FOR LARGEST SIZE OF HARDWARE ENCRYPTION MARKET FROM 2022 TO 2027
    8.2 EXTERNAL HARD DISK DRIVES 
           8.2.1 CONVENIENCE AND PORTABILITY OF EXTERNAL HDDS TO DRIVE DEMAND
    8.3 INTERNAL HARD DISK DRIVES 
           8.3.1 PERSONAL COMPUTERS AND LAPTOPS HAVE SHOWN SIGNIFICANT DEMAND FOR INTERNAL HARD DISK DRIVES
    8.4 SOLID-STATE DRIVES 
           8.4.1 ADVANCED SED FEATURE HELPS GROWTH OF SOLID-STATE DRIVE MARKET
    8.5 INLINE NETWORK ENCRYPTORS 
           8.5.1 INLINE NETWORK ENCRYPTORS ENCRYPT DATA IN TRANSIT MODE
    8.6 USB FLASH DRIVES 
           8.6.1 HIGHER PENETRATION OF HARDWARE ENCRYPTION MAKES USB FLASH DRIVES RELIABLE SOURCES FOR ENCRYPTING DATA
 
9 HARDWARE ENCRYPTION MARKET, BY APPLICATION (Page No. - 97)
    9.1 INTRODUCTION 
           FIGURE 36 CONSUMER ELECTRONICS APPLICATIONS TO RECORD LARGEST MARKET SHARE DURING FORECAST PERIOD
           TABLE 28 MARKET, BY APPLICATION, 2018–2021 (USD MILLION)
           TABLE 29 MARKET, BY APPLICATION, 2022–2027 (USD MILLION)
    9.2 CONSUMER ELECTRONICS 
           9.2.1 FULL DISK ENCRYPTION OFFERS BETTER PROTECTION AND PERFORMANCE THAN SOFTWARE ENCRYPTION
                    TABLE 30 CONSUMER ELECTRONICS: HARDWARE ENCRYPTION MARKET, BY REGION, 2018–2021 (USD MILLION)
                    TABLE 31 CONSUMER ELECTRONICS: MARKET, BY REGION, 2022–2027 (USD MILLION)
                    TABLE 32 CONSUMER ELECTRONICS: MARKET IN NORTH AMERICA, BY COUNTRY, 2018–2021 (USD MILLION)
                    TABLE 33 CONSUMER ELECTRONICS: MARKET IN NORTH AMERICA, BY COUNTRY, 2022–2027 (USD MILLION)
                    TABLE 34 CONSUMER ELECTRONICS: MARKET IN EUROPE, BY COUNTRY, 2018–2021 (USD THOUSAND)
                    TABLE 35 CONSUMER ELECTRONICS: MARKET IN EUROPE, BY COUNTRY, 2022–2027 (USD THOUSAND)
                    TABLE 36 CONSUMER ELECTRONICS: MARKET IN ASIA PACIFIC, BY COUNTRY, 2018–2021 (USD MILLION)
                    TABLE 37 CONSUMER ELECTRONICS: HARDWARE ENCRYPTION MARKET IN ASIA PACIFIC, BY COUNTRY, 2022–2027 (USD MILLION)
                    TABLE 38 CONSUMER ELECTRONICS: MARKET IN ROW, BY REGION, 2018–2021 (USD MILLION)
                    TABLE 39 CONSUMER ELECTRONICS: MARKET IN ROW, BY REGION, 2022–2027 (USD MILLION)
                    TABLE 40 CONSUMER ELECTRONICS: MARKET IN SOUTH AMERICA, BY COUNTRY, 2018–2021 (USD THOUSAND)
                    TABLE 41 CONSUMER ELECTRONICS: MARKET IN SOUTH AMERICA, BY COUNTRY, 2022–2027 (USD THOUSAND)
                    TABLE 42 CONSUMER ELECTRONICS: MARKET IN MIDDLE EAST & AFRICA, BY COUNTRY, 2018–2021 (USD THOUSAND)
                    TABLE 43 CONSUMER ELECTRONICS: MARKET IN MIDDLE EAST & AFRICA, BY COUNTRY, 2022–2027 (USD THOUSAND)
    9.3 IT & TELECOM 
           9.3.1 ADVANCEMENTS IN IT & TELECOM APPLICATIONS REQUIRE HARDWARE ENCRYPTION AS NECESSARY SAFETY MEASURE
                    TABLE 44 IT & TELECOM: HARDWARE ENCRYPTION MARKET, BY REGION, 2018–2021 (USD THOUSAND)
                    TABLE 45 IT & TELECOM: MARKET, BY REGION, 2022–2027 (USD THOUSAND)
                    TABLE 46 IT & TELECOM: MARKET IN NORTH AMERICA, BY COUNTRY, 2018–2021 (USD THOUSAND)
                    TABLE 47 IT & TELECOM: MARKET IN NORTH AMERICA, BY COUNTRY, 2022–2027 (USD THOUSAND)
                    TABLE 48 IT & TELECOM: MARKET IN EUROPE, BY COUNTRY, 2018–2021 (USD THOUSAND)
                    TABLE 49 IT & TELECOM: MARKET IN EUROPE, BY COUNTRY, 2022–2027 (USD THOUSAND)
                    TABLE 50 IT & TELECOM: HARDWARE ENCRYPTION MARKET IN ASIA PACIFIC, BY COUNTRY, 2018–2021 (USD THOUSAND)
                    TABLE 51 IT & TELECOM: MARKET IN ASIA PACIFIC, BY COUNTRY, 2022–2027 (USD THOUSAND)
                    TABLE 52 IT & TELECOM: MARKET IN ROW, BY REGION, 2018–2021 (USD THOUSAND)
                    TABLE 53 IT & TELECOM: MARKET IN ROW, BY REGION, 2022–2027 (USD THOUSAND)
                    TABLE 54 IT & TELECOM: MARKET IN SOUTH AMERICA, BY COUNTRY, 2018–2021 (USD THOUSAND)
                    TABLE 55 IT & TELECOM: MARKET IN SOUTH AMERICA, BY COUNTRY, 2022–2027 (USD THOUSAND)
                    TABLE 56 IT & TELECOM: MARKET IN MIDDLE EAST & AFRICA, BY COUNTRY, 2018–2021 (USD THOUSAND)
                    TABLE 57 IT & TELECOM: HARDWARE ENCRYPTION MARKET IN MIDDLE EAST & AFRICA, BY COUNTRY, 2022–2027 (USD THOUSAND)
    9.4 TRANSPORTATION 
           9.4.1 INTELLIGENT TRANSPORTATION SYSTEMS AND INTELLIGENT TRAFFIC MANAGEMENT SOLUTIONS TO BOOST MARKET
                    TABLE 58 TRANSPORTATION: HARDWARE ENCRYPTION MARKET, BY REGION, 2018–2021 (USD THOUSAND)
                    TABLE 59 TRANSPORTATION: MARKET, BY REGION, 2022–2027 (USD THOUSAND)
                    TABLE 60 TRANSPORTATION: MARKET IN NORTH AMERICA, BY COUNTRY, 2018–2021 (USD THOUSAND)
                    TABLE 61 TRANSPORTATION: MARKET IN NORTH AMERICA, BY COUNTRY, 2022–2027 (USD THOUSAND)
                    TABLE 62 TRANSPORTATION: MARKET IN EUROPE, BY COUNTRY, 2018–2021 (USD THOUSAND)
                    TABLE 63 TRANSPORTATION: MARKET IN EUROPE, BY COUNTRY, 2022–2027 (USD THOUSAND)
                    TABLE 64 TRANSPORTATION: HARDWARE ENCRYPTION MARKET IN ASIA PACIFIC, BY COUNTRY, 2018–2021 (USD THOUSAND)
                    TABLE 65 TRANSPORTATION: MARKET IN ASIA PACIFIC, BY COUNTRY, 2022–2027 (USD THOUSAND)
                    TABLE 66 TRANSPORTATION: MARKET IN ROW, BY REGION, 2018–2021 (USD THOUSAND)
                    TABLE 67 TRANSPORTATION: MARKET IN ROW, BY REGION, 2022–2027 (USD THOUSAND)
                    TABLE 68 TRANSPORTATION: MARKET IN SOUTH AMERICA, BY COUNTRY, 2018–2021 (USD THOUSAND)
                    TABLE 69 TRANSPORTATION: MARKET IN SOUTH AMERICA, BY COUNTRY, 2022–2027 (USD THOUSAND)
                    TABLE 70 TRANSPORTATION: MARKET IN MIDDLE EAST & AFRICA, BY COUNTRY, 2018–2021 (USD THOUSAND)
                    TABLE 71 TRANSPORTATION: HARDWARE ENCRYPTION MARKET IN MIDDLE EAST & AFRICA, BY COUNTRY, 2022–2027 (USD THOUSAND)
    9.5 AEROSPACE & DEFENSE 
           9.5.1 DATA PROTECTION AND SECURE COMMUNICATION IN AEROSPACE REQUIRE HARDWARE ENCRYPTION PRODUCTS
                    TABLE 72 AEROSPACE & DEFENSE: HARDWARE ENCRYPTION MARKET, BY REGION, 2018–2021 (USD MILLION)
                    TABLE 73 AEROSPACE & DEFENSE: MARKET, BY REGION, 2022–2027 (USD MILLION)
                    TABLE 74 AEROSPACE & DEFENSE: MARKET IN NORTH AMERICA, BY COUNTRY, 2018–2021 (USD THOUSAND)
                    TABLE 75 AEROSPACE & DEFENSE: MARKET IN NORTH AMERICA, BY COUNTRY, 2022–2027 (USD THOUSAND)
                    TABLE 76 AEROSPACE & DEFENSE: MARKET IN EUROPE, BY COUNTRY, 2018–2021 (USD THOUSAND)
                    TABLE 77 AEROSPACE & DEFENSE: MARKET IN EUROPE, BY COUNTRY, 2022–2027 (USD THOUSAND)
                    TABLE 78 AEROSPACE & DEFENSE:  MARKET IN ASIA PACIFIC BY COUNTRY, 2018–2021 (USD MILLION)
                    TABLE 79 AEROSPACE & DEFENSE: HARDWARE ENCRYPTION MARKET IN ASIA PACIFIC, BY COUNTRY, 2022–2027 (USD MILLION)
                    TABLE 80 AEROSPACE & DEFENSE: MARKET IN ROW, BY REGION, 2018–2021 (USD MILLION)
                    TABLE 81 AEROSPACE & DEFENSE: MARKET IN ROW, BY REGION, 2022–2027(USD MILLION)
                    TABLE 82 AEROSPACE & DEFENSE: MARKET IN SOUTH AMERICA, BY COUNTRY, 2018–2021 (USD MILLION)
                    TABLE 83 AEROSPACE & DEFENSE: MARKET IN SOUTH AMERICA, BY COUNTRY, 2022–2027 (USD THOUSAND)
                    TABLE 84 AEROSPACE & DEFENSE: MARKET IN MIDDLE EAST & AFRICA, BY COUNTRY, 2018–2021 (USD THOUSAND)
                    TABLE 85 AEROSPACE & DEFENSE: MARKET IN MIDDLE EAST & AFRICA, BY COUNTRY, 2022–2027 (USD THOUSAND)
    9.6 HEALTHCARE 
           9.6.1 HARDWARE ENCRYPTION SUPPORTS PROFICIENCY OF CLINICAL AND IT STAFF BY PROVIDING REAL-TIME ACCESS DURING EMERGENCIES
                    TABLE 86 HEALTHCARE: HARDWARE ENCRYPTION MARKET, BY REGION, 2018–2021 (USD THOUSAND)
                    TABLE 87 HEALTHCARE: MARKET, BY REGION, 2022–2027 (USD THOUSAND)
                    TABLE 88 HEALTHCARE: MARKET IN NORTH AMERICA, BY COUNTRY, 2018–2021 (USD THOUSAND)
                    TABLE 89 HEALTHCARE: MARKET IN NORTH AMERICA, BY COUNTRY, 2022–2027 (USD THOUSAND)
                    TABLE 90 HEALTHCARE: MARKET IN EUROPE, BY COUNTRY, 2018–2021 (USD THOUSAND)
                    TABLE 91 HEALTHCARE: HARDWARE ENCRYPTION MARKET IN EUROPE, BY COUNTRY, 2022–2027 (USD THOUSAND)
                    TABLE 92 HEALTHCARE: MARKET IN ASIA PACIFIC, BY COUNTRY, 2018–2021 (USD THOUSAND)
                    TABLE 93 HEALTHCARE: MARKET IN ASIA PACIFIC, BY COUNTRY, 2022–2027 (USD THOUSAND)
                    TABLE 94 HEALTHCARE: MARKET IN ROW, BY REGION, 2018–2021 (USD THOUSAND)
                    TABLE 95 HEALTHCARE: MARKET IN ROW, BY REGION, 2022–2027 (USD THOUSAND)
                    TABLE 96 HEALTHCARE: MARKET IN SOUTH AMERICA, BY COUNTRY, 2018–2021 (USD THOUSAND)
                    TABLE 97 HEALTHCARE: MARKET IN SOUTH AMERICA, BY COUNTRY, 2022–2027 (USD THOUSAND)
                    TABLE 98 HEALTHCARE: HARDWARE ENCRYPTION MARKET IN MIDDLE EAST & AFRICA, BY COUNTRY, 2018–2021 (USD THOUSAND)
                    TABLE 99 HEALTHCARE: MARKET IN MIDDLE EAST & AFRICA, BY COUNTRY, 2022–2027 (USD THOUSAND)
    9.7 OTHERS 
           9.7.1 HARDWARE ENCRYPTION ADOPTED BY RETAIL INDUSTRY DUE TO INCREASING POPULARITY OF E-TAILING, E-COMMERCE, AND ONLINE PAYMENTS
                    TABLE 100 OTHERS: HARDWARE ENCRYPTION MARKET, BY REGION, 2018–2021 (USD MILLION)
                    TABLE 101 OTHERS: MARKET, BY REGION, 2022–2027 (USD MILLION)
                    TABLE 102 OTHERS: MARKET IN NORTH AMERICA, BY COUNTRY, 2018–2021 (USD THOUSAND)
                    TABLE 103 OTHERS: MARKET IN NORTH AMERICA, BY COUNTRY, 2022–2027 (USD THOUSAND)
                    TABLE 104 OTHERS: MARKET IN EUROPE, BY COUNTRY, 2018–2021 (USD THOUSAND)
                    TABLE 105 OTHERS: HARDWARE ENCRYPTION MARKET IN EUROPE, BY COUNTRY, 2022–2027 (USD THOUSAND)
                    TABLE 106 OTHERS: MARKET IN ASIA PACIFIC, BY COUNTRY, 2018–2021 (USD THOUSAND)
                    TABLE 107 OTHERS: MARKET IN ASIA PACIFIC, BY COUNTRY, 2022–2027 (USD THOUSAND)
                    TABLE 108 OTHERS: MARKET IN ROW, BY REGION, 2018–2021 (USD THOUSAND)
                    TABLE 109 OTHERS: MARKET IN ROW, BY REGION, 2022–2027 (USD THOUSAND)
                    TABLE 110 OTHERS: HARDWARE ENCRYPTION MARKET IN SOUTH AMERICA, BY COUNTRY, 2018–2021 (USD THOUSAND)
                    TABLE 111 OTHERS: MARKET IN SOUTH AMERICA, BY COUNTRY, 2022–2027 (USD THOUSAND)
                    TABLE 112 OTHERS: MARKET IN MIDDLE EAST & AFRICA, BY COUNTRY, 2018–2021 (USD THOUSAND)
                    TABLE 113 OTHERS: MARKET IN MIDDLE EAST & AFRICA, BY COUNTRY, 2022–2027 (USD THOUSAND)
 
10 HARDWARE ENCRYPTION MARKET, BY REGION (Page No. - 129)
     10.1 INTRODUCTION 
             FIGURE 37 HARDWARE ENCRYPTION MARKET: BY GEOGRAPHY
             FIGURE 38 ASIA PACIFIC TO HOLD LARGEST SHARE OF MARKET DURING FORECAST PERIOD
     10.2 NORTH AMERICA 
             FIGURE 39 NORTH AMERICA: HARDWARE ENCRYPTION, BY COUNTRY
             FIGURE 40 NORTH AMERICA: HARDWARE ENCRYPTION SNAPSHOT
             10.2.1 US
                        10.2.1.1 Rising demand for hardware encryption-enabled products to ensure data security
             10.2.2 CANADA
                        10.2.2.1 Increased adoption of hardware encryption solutions by governmental institutions and organizations
             10.2.3 MEXICO
                        10.2.3.1 Increasing focus on manufacturing electronics to lead to market growth
     10.3 EUROPE 
             FIGURE 41 EUROPE: HARDWARE ENCRYPTION MARKET, BY COUNTRY
             FIGURE 42 EUROPE: MARKET SNAPSHOT
             10.3.1 UK
                        10.3.1.1 Rising installation of data storage systems to generate new revenue pockets for hardware encryption providers
             10.3.2 GERMANY
                        10.3.2.1 Surging demand for hardware encryption in components used for developing automobiles
             10.3.3 FRANCE
                        10.3.3.1 Flourishing telecommunication sector to emerge as new opportunity for hardware encryption providers
             10.3.4 ITALY
                        10.3.4.1 Growing manufacturing sector to accelerate demand for hardware encryption products
             10.3.5 NETHERLANDS
                        10.3.5.1 Surging adoption of electric vehicles to increase demand for hardware encryption products
             10.3.6 REST OF EUROPE
     10.4 ASIA PACIFIC 
             FIGURE 43 ASIA PACIFIC: HARDWARE ENCRYPTION MARKET, BY COUNTRY
             FIGURE 44 ASIA PACIFIC: MARKET SNAPSHOT
             10.4.1 CHINA
                        10.4.1.1 Growing demand for encryption products related to smartphones and tablets
             10.4.2 JAPAN
                        10.4.2.1 Rising adoption of technologically advanced commodities fuels demand for encryption products
             10.4.3 SOUTH KOREA
                        10.4.3.1 Flourishing consumer electronics and automobile industries contribute to market growth
             10.4.4 INDIA
                        10.4.4.1 Growing adoption of big data, IoT, and other digital and virtual platforms to fuel demand for encryption-enabled solutions
             10.4.5 REST OF ASIA PACIFIC
     10.5 ROW 
             FIGURE 45 ROW: HARDWARE ENCRYPTION MARKET, BY COUNTRY
             TABLE 124 SOUTH AMERICA: MARKET, BY REGION, 2018–2021 (USD THOUSAND)
             TABLE 125 SOUTH AMERICA: MARKET, BY REGION, 2022–2027 (USD THOUSAND)
             TABLE 126 MIDDLE EAST & AFRICA: HARDWARE ENCRYPTION MARKET, BY REGION, 2018–2021 (USD THOUSAND)
             TABLE 127 MIDDLE EAST & AFRICA: MARKET, BY REGION, 2022–2027 (USD THOUSAND)
             10.5.1 MIDDLE EAST & AFRICA
                        10.5.1.1 Increasing number of entrepreneurs, government initiatives, and substantial foreign investments to boost market growth
             10.5.2 SOUTH AMERICA
                        10.5.2.1 Digital transformation initiatives across industry verticals expected to propel market growth
 
11 COMPETITIVE LANDSCAPE (Page No. - 147)
     11.1 OVERVIEW 
             11.1.1 INTRODUCTION
     11.2 KEY PLAYER STRATEGIES/RIGHT TO WIN 
             TABLE 128 OVERVIEW OF STRATEGIES ADOPTED BY KEY PLAYERS IN MARKET
     11.3 REVENUE ANALYSIS OF TOP PLAYERS 
             FIGURE 46 3-YEAR REVENUE ANALYSIS OF TOP PLAYERS IN HARDWARE ENCRYPTION MARKET, 2019–2021
     11.4 MARKET SHARE ANALYSIS OF KEY PLAYERS IN MARKET IN 2021 
             FIGURE 47 MARKET SHARE ANALYSIS OF KEY PLAYERS IN MARKET IN 2021
             TABLE 129 MARKET: DEGREE OF COMPETITION
             TABLE 130 HARDWARE ENCRYPTION DEVICE MARKET RANKING ANALYSIS
     11.5 COMPANY EVALUATION QUADRANT, 2021 
             11.5.1 STARS
             11.5.2 EMERGING LEADERS
             11.5.3 PERVASIVE PLAYERS
             11.5.4 PARTICIPANTS
                        FIGURE 48 HARDWARE ENCRYPTION MARKET (GLOBAL): COMPANY EVALUATION QUADRANT, 2021
     11.6 COMPETITIVE BENCHMARKING 
             TABLE 131 COMPANY FOOTPRINT, BY ARCHITECTURE (21 COMPANIES)
             11.6.1 COMPANY FOOTPRINT, BY APPLICATION (21 COMPANIES)
                        TABLE 132 COMPANY FOOTPRINT, BY REGION (21 COMPANIES)
             11.6.2 COMPANY PRODUCT FOOTPRINT
     11.7 START-UP/SME EVALUATION QUADRANT, 2021 
             11.7.1 PROGRESSIVE COMPANIES
             11.7.2 RESPONSIVE COMPANIES
             11.7.3 DYNAMIC COMPANIES
             11.7.4 STARTING BLOCKS
                        FIGURE 49 HARDWARE ENCRYPTION MARKET (GLOBAL): START-UP/SME EVALUATION QUADRANT, 2021
                        TABLE 133 MARKET: LIST OF KEY START-UPS/SMES
                        TABLE 134 MARKET: COMPETITIVE BENCHMARKING OF KEY START-UPS/SMES
     11.8 COMPETITIVE SCENARIO AND TRENDS 
             11.8.1 PRODUCT LAUNCHES/DEVELOPMENTS
                        TABLE 135 HARDWARE ENCRYPTION MARKET: PRODUCT LAUNCHES/DEVELOPMENTS, 2020–2022
             11.8.2 DEALS
                        TABLE 136 MARKET: DEALS, 2020–2022
 
12 COMPANY PROFILES (Page No. - 166)
(Business Overview, Products Offered, Recent Developments, MnM View Right to win, Strategic choices made, Weaknesses and competitive threats) *  
     12.1 INTRODUCTION 
     12.2 KEY PLAYERS 
             12.2.1 WESTERN DIGITAL TECHNOLOGIES, INC.
                        TABLE 137 WESTERN DIGITAL TECHNOLOGIES, INC.: BUSINESS OVERVIEW
                        FIGURE 50 WESTERN DIGITAL TECHNOLOGIES, INC.: COMPANY SNAPSHOT
                        TABLE 138 WESTERN DIGITAL TECHNOLOGIES, INC.: PRODUCT LAUNCHES
                        TABLE 139 WESTERN DIGITAL TECHNOLOGIES, INC.: DEALS
             12.2.2 SAMSUNG ELECTRONICS CO., LTD.
                        TABLE 140 SAMSUNG ELECTRONICS CO., LTD.: BUSINESS OVERVIEW
                        FIGURE 51 SAMSUNG ELECTRONICS CO., LTD.: COMPANY SNAPSHOT
                        TABLE 141 SAMSUNG ELECTRONICS CO., LTD.: PRODUCT LAUNCHES
                        TABLE 142 SAMSUNG ELECTRONICS CO., LTD.: DEALS
             12.2.3 MICRON TECHNOLOGY, INC.
                        TABLE 143 MICRON TECHNOLOGY, INC.: BUSINESS OVERVIEW
                        FIGURE 52 MICRON TECHNOLOGY, INC.: COMPANY SNAPSHOT
                        TABLE 144 MICRON TECHNOLOGY, INC.: PRODUCT LAUNCHES
                        TABLE 145 MICRON TECHNOLOGY, INC.: DEALS
             12.2.4 KINGSTON TECHNOLOGY CORPORATION
                        TABLE 146 KINGSTON TECHNOLOGY CORPORATION: BUSINESS OVERVIEW
                        TABLE 147 KINGSTON TECHNOLOGY CORPORATION: PRODUCT LAUNCHES
                        TABLE 148 KINGSTON TECHNOLOGY CORPORATION: DEALS
             12.2.5 SEAGATE TECHNOLOGY HOLDINGS PLC
                        TABLE 149 SEAGATE TECHNOLOGY HOLDINGS PLC: BUSINESS OVERVIEW
                        FIGURE 53 SEAGATE TECHNOLOGY HOLDINGS PLC: COMPANY SNAPSHOT
                        TABLE 150 SEAGATE TECHNOLOGY HOLDINGS PLC: PRODUCT LAUNCHES
             12.2.6 NETAPP, INC.
                        TABLE 151 NETAPP, INC.: BUSINESS OVERVIEW
                        FIGURE 54 NETAPP, INC.: COMPANY SNAPSHOT
             12.2.7 KIOXIA HOLDINGS CORPORATION
                        TABLE 152 KIOXIA HOLDINGS CORPORATION: BUSINESS OVERVIEW
                        TABLE 153 KIOXIA HOLDINGS CORPORATION: PRODUCT LAUNCHES
                        TABLE 154 KIOXIA HOLDINGS CORPORATION: DEALS
             12.2.8 KANGURU SOLUTIONS
                        TABLE 155 KANGURU SOLUTIONS: BUSINESS OVERVIEW
                        TABLE 156 KANGURU SOLUTIONS: PRODUCT LAUNCHES
                        TABLE 157 KANGURU SOLUTIONS: DEALS
             12.2.9 INTEL CORPORATION
                        TABLE 158 INTEL CORPORATION: BUSINESS OVERVIEW
                        FIGURE 55 INTEL CORPORATION: COMPANY SNAPSHOT
                        TABLE 159 INTEL CORPORATION: DEALS
             12.2.10 WINMAGIC INC.
                        TABLE 160 WINMAGIC INC.: BUSINESS OVERVIEW
     12.3 OTHER PLAYERS 
             12.3.1 MAXIM INTEGRATED PRODUCTS, INC.
             12.3.2 THALES E-SECURITY, INC.
             12.3.3 MCAFEE, LLC
             12.3.4 BROADCOM INC.
             12.3.5 INTERNATIONAL BUSINESS MACHINES CORPORATION
             12.3.6 MICRO FOCUS
             12.3.7 GIESECKE+DEVRIENT GMBH
             12.3.8 IDEMIA
             12.3.9 NXP SEMICONDUCTORS N.V.
             12.3.10 INFINEON TECHNOLOGIES AG
             12.3.11 CHECK POINT SOFTWARE TECHNOLOGIES LTD.
             12.3.12 SOPHOS GROUP PLC
             12.3.13 ESET, SPOL. S R.O.
             12.3.14 TREND MICRO INCORPORATED
             12.3.15 CHIPSPIRIT
*Details on Business Overview, Products Offered, Recent Developments, MnM View, Right to win, Strategic choices made, Weaknesses and competitive threats might not be captured in case of unlisted companies.  
 
13 APPENDIX (Page No. - 211)
     13.1 DISCUSSION GUIDE 
     13.2 KNOWLEDGESTORE: MARKETSANDMARKETS’ SUBSCRIPTION PORTAL 
     13.3 CUSTOMIZATION OPTIONS 
     13.4 RELATED REPORTS 
     13.5 AUTHOR DETAILS 
 

The study involved 4 major activities in estimating the size of the hardware encryption market. Exhaustive secondary research was done to collect information on the market. The next step was to validate these findings, assumptions, and sizing with industry experts across the value chain through primary research. Both top-down and bottom-up approaches were employed to estimate the total market size. Further, market breakdown and data triangulation were used to determine the market sizes of segments and subsegments.

Secondary Research

The secondary sources referred to for this research study include organizations such as Semiconductor Industry Association, Global Association of Risk Professionals, Storage Networking Industry Association (SNIA), IEEE, Electronics Representatives Association, Institute of Information Engineering, CAS, and so on; corporate filings (such as annual reports, investor presentations, and financial statements); and trade, and business. Secondary data has been collected and analyzed to determine the overall market size, further validated by primary research.

Primary Research

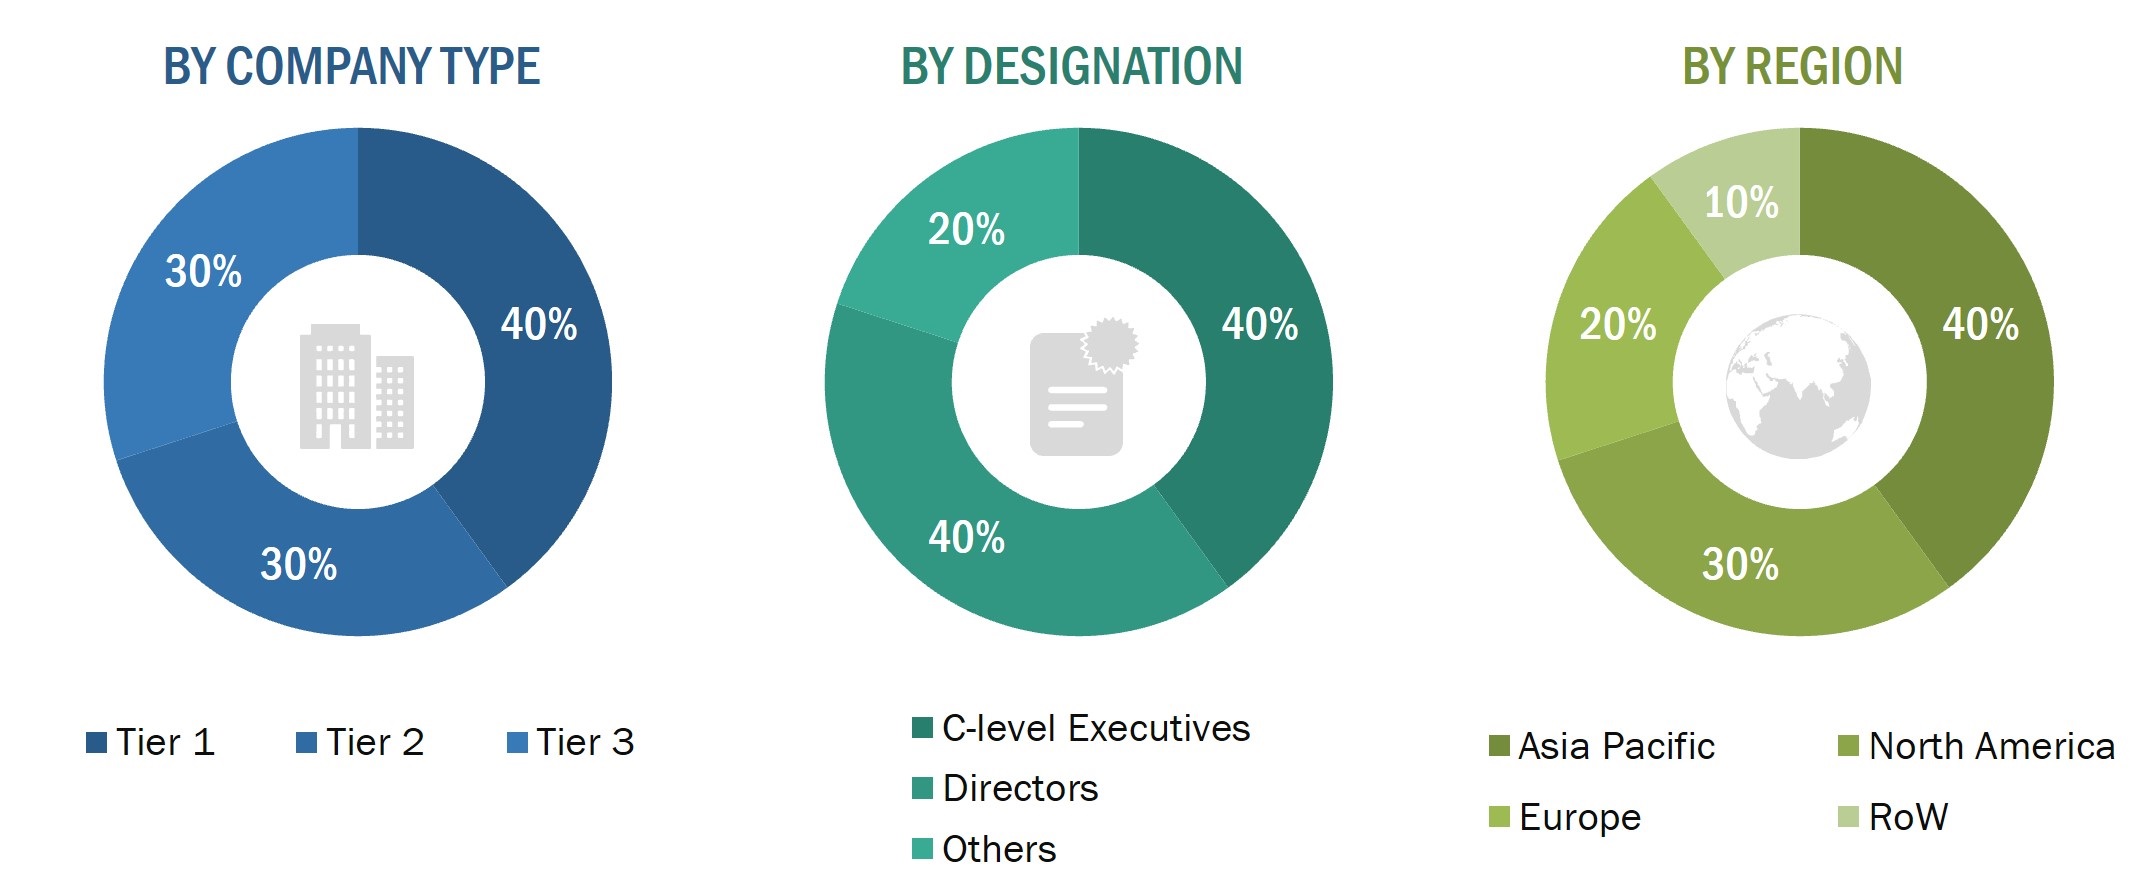
Extensive primary research has been conducted after acquiring an understanding of the hardware encryption market scenario through secondary research. Several primary interviews have been conducted with market experts from both the demand- (commercial application providers) and supply-side (equipment manufacturers and distributors) players across four major regions, namely, North America, Europe, Asia Pacific, and Rest of the World (South America, Middle East & Africa). Approximately 75% and 25% of primary interviews were conducted from the demand and supply sides, respectively. Primary data has been collected through questionnaires, emails, and telephonic interviews. In canvassing primaries, various departments within organizations, such as sales, operations, and administration, were covered to provide a holistic viewpoint in our report.

After interacting with industry experts, brief sessions were conducted with highly experienced independent consultants to reinforce the findings from the primaries. This, along with the in-house subject matter experts’ opinions, has led us to the findings described in the remainder of this report.
Hardware Encryption Market Size, and Share

To know about the assumptions considered for the study, download the pdf brochure

Market Size Estimation

Both top-down and bottom-up approaches were used to estimate and validate the total size of the hardware encryption market. These methods were also extensively used to estimate the sizes of various market subsegments. The research methodology used to estimate the market sizes includes the following:

  • The key players in the market were identified through extensive secondary research.
  • In terms of value, the supply chain and market size were determined through primary and secondary research.

All percentage shares, splits, and breakdowns were determined using secondary sources and verified through primary sources. Qualitative aspects such as market drivers, restraints, opportunities, and challenges have been considered while calculating and forecasting the market size.

Global Hardware Encryption Market Size: Bottom-Up Approach

Hardware Encryption Market Size, and Bottom-Up Approach

Data Triangulation

After arriving at the overall market size-using the market size estimation processes explained above-the market was split into several segments and sub-segments. Data triangulation and market breakdown procedures were employed, wherever applicable, to complete the overall market engineering process and arrive at the exact statistics of each market segment and subsegment. The data was triangulated by studying various factors and trends from both the demand and supply sides.

Report Objectives:

  • To describe and forecast the global hardware encryption market based on architecture, product, application, and region, in terms of value.
  • To describe and forecast the market for four main regions: North America, Europe, Asia Pacific, and Rest of the World (RoW), in terms of value.
  • To provide detailed information regarding drivers, restraints, opportunities, and challenges influencing the growth of the market
  • To provide a detailed overview of the value chain pertaining to the ecosystem of the market
  • To strategically analyze micromarkets1 with respect to individual growth trends, prospects, and contributions to the total market
  • To analyze opportunities in the market for various stakeholders by identifying high-growth segments
  • To benchmark players within the market using the proprietary competitive leadership mapping framework, which analyzes market players using various parameters within the broad categories of business and product strategy
  • To strategically profile key players and comprehensively analyze their market position in terms of ranking and core competencies2, along with detailing the competitive landscape for market leaders
  • To analyze competitive developments such as acquisitions, product launches and developments, and research and developments in the market

1. Micromarkets are defined as the further segments and subsegments of the hardware encryption market for the abovementioned applications.

2. Core competencies of companies are defined in terms of their key developments and key strategies adopted to sustain their position in the market.

Customization Options:

With the given market data, MarketsandMarkets offers customizations according to the company’s specific needs. The following customization options are available for the report:

Company Information

  • Detailed analysis and profiling of additional market players (up to 5)
Custom Market Research Services

We will customize the research for you, in case the report listed above does not meet with your exact requirements. Our custom research will comprehensively cover the business information you require to help you arrive at strategic and profitable business decisions.

Request Customization

Instant Answers with GPT - Ask Now!

Ask real questions. Get complete answers !
Report Code
SE 1876
Published ON
Dec, 2022
Choose License Type
BUY NOW
  • SHARE
X
Request Customization
Speak to Analyst
Speak to Analyst
OR FACE-TO-FACE MEETING
PERSONALIZE THIS RESEARCH
  • Triangulate with your Own Data
  • Get Data as per your Format and Definition
  • Gain a Deeper Dive on a Specific Application, Geography, Customer or Competitor
  • Any level of Personalization
REQUEST A FREE CUSTOMIZATION
LET US HELP YOU!
  • What are the Known and Unknown Adjacencies Impacting the Hardware Encryption Market
  • What will your New Revenue Sources be?
  • Who will be your Top Customer; what will make them switch?
  • Defend your Market Share or Win Competitors
  • Get a Scorecard for Target Partners
CUSTOMIZED WORKSHOP REQUEST
knowledgestore logo

Want to explore hidden markets that can drive new revenue in Hardware Encryption Market?

Find Hidden Markets
  • Call Us
  • +1-888-600-6441 (Corporate office hours)
  • +1-888-600-6441 (US/Can toll free)
  • +44-800-368-9399 (UK office hours)
CONNECT WITH US
ABOUT TRUST ONLINE
©2024 MarketsandMarkets Research Private Ltd. All rights reserved
DMCA.com Protection Status
Website Feedback