Fly Ash Market by Type (Type F, Type C), Application (Portland Cement & Concrete, Bricks & Blocks, Road Construction, Agriculture), and Region (Asia Pacific, Europe, North America, Middle East & Africa, South America) - Global Forecast to 2023


To get the latest information, inquire now!
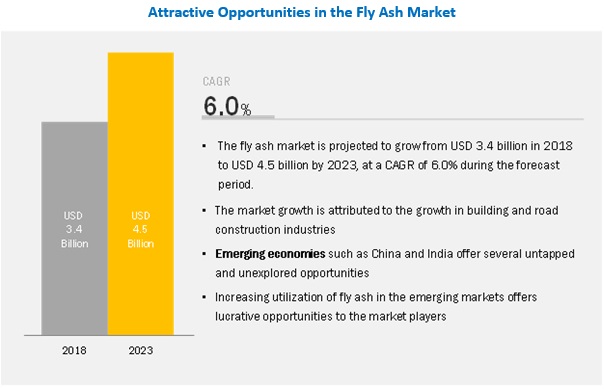
Global Fly Ash Market was valued at USD 3.4 billion in 2018 and is projected to reach USD 4.5 billion by 2023, growing at a cagr 6.0% from 2018 to 2023. The market has been growing owing to the growth in the construction industry, increasing focus on infrastructure and road paving, problems related to dumping fly ash, promotion of fly ash by governments of various countries, and increasing focus on the use of environment-friendly products.
The Asia Pacific market for fly ash majorly includes China, India, Japan, Australia, and Indonesia. Various measures have been undertaken by governments of these countries for the conservation of energy and prevention of dumping fly ash into landfills and ponds, resulting in the increasing utilization of fly ash and thus driving the market in this region. The North American fly ash market is driven by growth in the region’s construction sector in recent years and high utilization rate of fly ash. Europe is the world’s third-largest fly ash market.
Class F type segment expected to grow at the highest rate due to the increasing demand from the construction and infrastructure sectors
The main application of Class F type fly ash is in Portland cement, where it is used in mass concrete and high strength mixes. It is also suitable for concreting in summer as it moderates heat gain during concrete curing. The growth in the consumption of cement and cementitious materials from the construction sector across the globe has been driving the demand for Class F type fly ash. Increasing construction expenditure in China and India has also led to an increase in the consumption of Class F type fly ash.
Portland cement & concrete application segment is the largest segment due to the increasing demand from residential and non-residential construction sectors
Concrete made from fly ash is slightly lower in strength than normal cement concrete of up to 30 days, around equal in strength in 30-40 days, and higher in strength than normal cement in around a year’s time. Fly ash concrete has lesser permeability and efflorescence than normal concrete. Construction expenditure in the Asia Pacific region has been increasing due to the rising demand for residential and non-residential buildings. The governments of countries such as China, India, Malaysia, and Indonesia are investing in infrastructure development, including the construction of new highways and freeways, thus driving the growth of the Portland cement & concrete segment.
Fly Ash Market: Research Design
Asia Pacific is expected to account for the largest market size during the forecast period
The fly ash market in Asia Pacific is expected to grow at the highest CAGR during the forecast period. The growing population in this region is placing a strain on the existing infrastructure and leading to the need for additional developments in the rail networks, residential buildings, and roadways. There is a significant need to invest in additional infrastructure to reduce the gap in the existing and the required infrastructure in the region. Thus, the road infrastructure projects by the governments of the Asia Pacific region countries are expected to drive the global fly ash market.

Fly Ash Market Players
Key players in the market include Boral Limited (Australia), Charah Solutions (US), CEMEX S.A.B. de C.V. (Mexico), Lafarge North America Inc. (US), FlyAshDirect (US), Separation Technologies LLC (US), Aggregate Industries (UK), Salt River Materials Group (US), and Ashtech (India) Pvt. Ltd. (India). These players have expanded their geographical presence through acquisitions, expansions, and agreements. Boral Limited, the market leader in the fly ash market, acquired one of its biggest competitors, Headwaters to further increase its market share. Such acts of consolidation can be followed by other players to improve their position in the unorganized fly ash market.
Fly Ash Market Report Scope
|
Report Metric |
Details |
|
Market Size Value in 2018 |
USD 3.4 billion |
|
Revenue Forecast in 2023 |
USD 4.5 billion |
|
CAGR |
6.0% |
|
Market Size Available for Years |
2016-2023 |
|
2017 |
2017 |
|
Forecast Period |
2018-2023 |
|
Forecast Units |
Value (USD) and Volume (KT) |
|
Segments Covered |
Type, Application and Region |
|
Geographies Covered |
North America, Asia Pacific, Europe, the Middle East & Africa, and South America |
|
Companies Covered |
Boral Limited (US), Charah Solutions (US), CEMEX S.A.B. DE C.V. (Mexico), Lafarge North America Inc. (US), FlyAshDirect (US), Separation technologies LLC (US), Aggregate Industries (UK), Salt River Materials Group (US), and Ashtech (India) Pvt. Ltd. (India) |
This research report categorizes the fly ash market based on type, application, and region, forecasting volumes and revenues as well as analyzing trends in each of these submarkets.
Based on type, the fly ash market is segmented into:
- Class F
- Class C
Based on application, the fly ash market is segmented into:
- Portland Cement & Concrete
- Bricks & Blocks
- Road Construction
- Agriculture
- Others (Mining, Chemicals, Water Treatment, Flowable Fills, Structural Fills, Waste Management)
Based on region, the fly ash market is segmented into:
-
Asia Pacific
- China
- India
- Japan
- Australia
- Indonesia
- Rest of APAC
-
North America
- US
- Canada
- Mexico
-
Europe
- Germany
- Poland
- UK
- Spain
- France
- Italy
- Rest of Europe
-
Middle East & Africa
- South Africa
- Saudi Arabia
-
South America
- Brazil
- Argentina
- Rest of South America
The following customization options are available for the report:
- Along with the given market data, MarketsandMarkets offers customizations as per the company’s specific needs. The following customization options are available for the report:
- Further breakdown of Asia Pacific & Europe fly ash markets
- Company information
- Detailed analysis and profiling of additional market players (up to three)
Recent Developments
- In March 2018, Boral Limited acquired the Carbon Burn-out (CBO) technology developed by PMI Ash Technologies, LLC that helps in improving the quality of fly ash in coal-powered power plants. This helped the company in maintaining its leadership in the fly ash supply chain in North America.
- In May 2018, Charah Solutions acquired SCB International, Inc. (SCB) to develop and deploy innovative technologies for fly ash benefaction for sale to concrete producers, processing kiln dust to remove mercury, and to grind granulated blast furnace slag to be sold to concrete producers. This will help Charah Solutions in expanding its MultiSource fly ash network and meet customer demand.
Key Questions Addressed by the Report
- Where will all these developments take the industry in the mid to long term?
- What are the upcoming industry applications for fly ash?
- What is the impact of the change in energy policy in the US on the fly ash market?
- What are the trends for utilization of fly ash in China and India?
- What are the trends for beneficiation of landfilled and ponded fly ash in the US and Canada?
To speak to our analyst for a discussion on the above findings, click Speak to Analyst
 Exclusive indicates content/data unique to MarketsandMarkets and not available with any competitors.
Table of Contents
1 Introduction (Page No. - 16)
1.1 Objectives of the Study
1.2 Market Definition
1.3 Scope of the Study
1.3.1 Regional Scope
1.3.2 Markets Covered
1.3.3 Years Considered in the Report
1.4 Currency & Pricing
1.5 Stakeholders
2 Research Methodology (Page No. - 19)
2.1 Research Data
2.1.1 Key Data From Secondary Sources
2.1.2 Key Data From Primary Sources
2.1.2.1 Key Industry Insights
2.2 Market Size Estimation
2.3 Market Breakdown & Data Triangulation
2.4 Assumptions
2.5 Limitations
3 Executive Summary (Page No. - 26)
4 Premium Insights (Page No. - 29)
4.1 Attractive Opportunities in Fly Ash Market
4.2 Fly Ash Market, By Region
4.3 Asia Pacific Fly Ash Market, By Type & Country
4.4 Fly Ash Market, By Application & Region
4.5 Top Countries in Fly Ash Market
5 Market Overview (Page No. - 32)
5.1 Introduction
5.2 Evolution
5.3 Market Dynamics
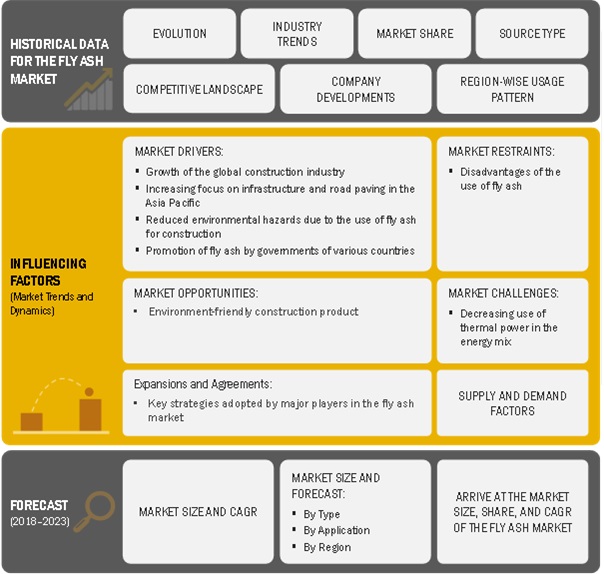
5.3.1 Drivers
5.3.1.1 Growth of the Global Construction Industry
5.3.1.2 Increasing Focus on Infrastructure and Road Paving in the Asia Pacific
5.3.1.3 Reduced Environmental Hazards Due to the Use of Fly Ash for Construction
5.3.1.4 Promotion of Fly Ash By Governments of Various Countries
5.3.2 Restraints
5.3.2.1 Disadvantages of the Use of Fly Ash
5.3.3 Opportunities
5.3.3.1 Environment-Friendly Construction Product
5.3.4 Challenges
5.3.4.1 Decreasing Use of Thermal Power in the Energy Mix
5.4 Macroeconomic Indicators
5.4.1 Annual GDP Growth of Major Economies
5.4.2 Road Construction
5.5 Porter’s Five Forces Analysis
5.5.1 Bargaining Power of Suppliers
5.5.2 Threat of New Entrants
5.5.3 Threat of Substitutes
5.5.4 Bargaining Power of Buyers
5.5.5 Intensity of Competitive Rivalry
6 Fly Ash Market, By Source Type (Page No. - 40)
6.1 Introduction
6.2 Power Plants
6.2.1 Loss of Ignition (LOI)
6.2.2 Fineness
6.2.3 Chemical Composition
6.2.4 Uniformity
6.3 Landfill/Pond
7 Fly Ash Market, By Type (Page No. - 43)
7.1 Introduction
7.2 Class F
7.2.1 Class F Fly Ash to Hold the Largest Market Share Through 2023
7.3 Class C
7.3.1 Road Construction Application to Drive the Class C Fly Ash Market
8 Fly Ash Market, By Application (Page No. - 47)
8.1 Introduction
8.2 Portland Cement & Concrete
8.2.1 Portland Cement & Concrete to Hold the Largest Market Share Through 2023
8.3 Road Construction
8.3.1 Road Construction to Grow Due to Growth in Infrastructure Industry in Asia Pacific and North America
8.4 Bricks & Blocks
8.4.1 Bricks & Blocks to Grow Due to Rise in Global Construction Activities
8.5 Agriculture
8.5.1 Demand for Fly Ash in Agriculture Application Driven By Rising Consumption From China and India
8.6 Others
9 Fly Ash Market, By Region (Page No. - 55)
9.1 Introduction
9.2 Asia Pacific
9.2.1 China
9.2.1.1 The Presence of Large Number of Coal Power Plants has Ensured Significant Supply of Fly Ash in China
9.2.2 India
9.2.2.1 India to Have the Second Largest Share in the Asia Pacific Fly Ash Market
9.2.3 Japan
9.2.3.1 Demand From the General, Residential, and Civil Construction Sectors has Driven the Market for Fly Ash in Japan
9.2.4 Australia
9.2.4.1 The Growth in the Australian Infrastructure Sector has Increased the Demand of Fly Ash
9.2.5 Indonesia
9.2.5.1 The Growing Urban Population of Indonesia and Rising Disposable Income of Its Middle-Class Population are Fueling the Growth of the Construction Sector in the Country
9.2.6 Rest of Asia Pacific
9.3 North America
9.3.1 US
9.3.1.1 Increased Construction Spending is Driving the Fly Ash Market in the Us
9.3.2 Canada
9.3.2.1 The Growth in Roadways and Construction Activities in Canadian States, Such as Ontario and New Brunswick is Driving the Fly Ash Market
9.3.3 Mexico
9.3.3.1 Development of Ports, Roads, Highways, Airports, Railways, and Power Utilities has Increased the Demand of Fly Ash in Mexico
9.4 Europe
9.4.1 Germany
9.4.1.1 Economic Reforms and Favorable Financial Policies Have Led to Growth in the German Construction Industry
9.4.2 UK
9.4.2.1 Growth in the Housing, Commercial, and Civil Engineering Construction has Driven the Fly Ash Market in the UK
9.4.3 Poland
9.4.3.1 Government Investments in Infrastructure, Energy, and Housing Projects Have Led to Growth in the Fly Ash Market in Poland
9.4.4 Spain
9.4.4.1 Growth in the Residential Construction Sector has Led to Growth in the Spain Fly Ash Market
9.4.5 France
9.4.5.1 Increasing Consumption of Portland Cement and Concrete is Expected to Drive the Fly Ash Market in France
9.4.6 Italy
9.4.6.1 Government Investments in Infrastructural Projects is Driving the Fly Ash Market in Italy
9.4.7 Rest of Europe
9.5 Middle East & Africa
9.5.1 South Africa
9.5.1.1 Government Investment in Low-Cost Housing Projects and Renewable Energy Projects is Expected to Drive the Fly Ash Market in South Africa
9.5.2 Saudi Arabia
9.5.2.1 Modernization of Transport Systems, and Maintenance of the Existing Road Networks is Driving the Fly Ash Market in Saudi Arabia
9.5.3 Rest of Middle East & Africa
9.6 South America
9.6.1 Brazil
9.6.1.1 Deteriorating Business Environment and Weak Investor Confidence has Led to Slow Growth in the Fly Ash Market in Brazil
9.6.2 Argentina
9.6.2.1 High Interest Rates and Currency Devaluation has Led to Moderate Growth in the Fly Ash Market in Argentina
9.6.3 Rest of South America
10 Competitive Landscape (Page No. - 106)
10.1 Overview
10.2 Market Ranking Analysis
10.3 Competitive Situations & Trends
10.3.1 Expansions
10.3.2 Acquisitions
10.3.3 Agreements
10.3.4 Joint Ventures
10.3.5 Partnerships
11 Company Profiles (Page No. - 110)
11.1 Boral Limited
11.1.1 Business Overview
11.1.2 Products & Services Offered
11.1.3 Recent Developments
11.1.4 SWOT Analysis
11.2 Charah Solutions
11.2.1 Business Overview
11.2.2 Products & Services Offered
11.2.3 SWOT Analysis
11.2.4 Recent Developments
11.3 Cemex
11.3.1 Business Overview
11.3.2 Products & Services Offered
11.3.3 Recent Developments
11.3.4 SWOT Analysis
11.4 Lafarge North America Inc.
11.4.1 Business Overview
11.4.2 Products Offered
11.4.3 SWOT Analysis
11.4.4 Recent Developments
11.5 Flyashdirect
11.5.1 Business Overview
11.5.2 Products & Services Offered
11.5.3 Recent Developments
11.6 SEFA
11.6.1 Business Overview
11.6.2 Products Offered
11.6.3 Recent Developments
11.7 Separation Technologies Llc
11.7.1 Business Overview
11.7.2 Products & Services Offered
11.7.3 Recent Developments
11.8 Aggregate Industries
11.8.1 Business Overview
11.8.2 Products & Services Offered
11.8.3 Recent Developments
11.9 Salt River Materials Group
11.9.1 Business Overview
11.9.2 Products & Services Offered
11.9.3 Recent Developments
11.1 Ashtech (India) Pvt. Ltd.
11.10.1 Business Overview
11.10.2 Products & Services Offered
11.10.3 Recent Developments
11.11 Other Companies
12 Annextures (Page No. - 126)
12.1 Composition of Class C Fly Ash, Class F Fly Ash, and Portland Cement
12.2 Standard Specifications for Fly Ash Quality Assurance in the US
12.3 Specifications for Fly Ash for Astm C 618
12.4 State-Wise Fly Ash Supply Scenario in the US
12.4.1 Region-Northeast
12.4.2 Region-Midwest
12.4.3 Region-South
12.4.4 Region-West
12.5 Regionwise-Wise Pricing Scenario in the US
13 Appendix (Page No. - 130)
13.1 Discussion Guide
13.2 Knowledge Store: Marketsandmarkets Subscription Portal
13.3 Available Customizations
13.4 Related Reports
13.5 Author Details
List of Tables (145 Tables)
Table 1 Annual GDP Growth of Major Economies, 2012 to 2016
Table 2 International Road Network Outlook (2018)
Table 3 Fly Ash Market, By Type, 2016–2023 (USD Million)
Table 4 Fly Ash Market, By Type, 2016–2023 (Million Tons)
Table 5 Class F Type Market, By Region, 2016–2023 (USD Million)
Table 6 Class F Type Market, By Region, 2016–2023 (Million Tons)
Table 7 Class C Type Market, By Region, 2016–2023 (USD Million)
Table 8 Class C Type Market, By Region, 2016–2023 (Million Tons)
Table 9 Fly Ash Market, By Application, 2016–2023 (USD Million)
Table 10 Fly Ash Market, By Application, 2016–2023 (Million Tons)
Table 11 Fly Ash Market in Portland Cement & Concrete Application, By Region, 2016–2023 (USD Million)
Table 12 Fly Ash Market in Portland Cement & Concrete Application, By Region, 2016–2023 (Million Tons)
Table 13 Fly Ash Market in Road Construction Application, By Region, 2016–2023 (USD Million)
Table 14 Fly Ash Market in Road Construction Application, By Region, 2016–2023 (Million Tons)
Table 15 Fly Ash Market in Bricks & Blocks Application, By Region, 2016–2023 (USD Million)
Table 16 Fly Ash Market in Bricks & Blocks Application, By Region, 2016–2023 (Million Tons)
Table 17 Fly Ash Market in Agriculture Application, By Region, 2016–2023 (USD Million)
Table 18 Fly Ash Market in Agriculture Application, By Region, 2016–2023 (Million Tons)
Table 19 Fly Ash Market in Other Applications, By Region, 2016–2023 (USD Million)
Table 20 Fly Ash Market in Other Applications, By Region, 2016–2023 (Million Tons)
Table 21 Fly Ash Market Size, By Region, 2016–2023 (USD Million)
Table 22 Fly Ash Market Size, By Region, 2016–2023 (Million Tons)
Table 23 Asia Pacific: By Market Size, By Country, 2016–2023 (USD Million)
Table 24 Asia Pacific: By Market Size, By Country, 2016–2023 (Million Tons)
Table 25 Asia Pacific: By Market Size, By Type, 2016–2023 (USD Million)
Table 26 Asia Pacific: By Market Size, By Type, 2016–2023 (Million Tons)
Table 27 Asia Pacific: By Market Size, By Application, 2016–2023 (USD Million)
Table 28 Asia Pacific: By Market Size, By Application, 2016–2023 (Million Tons)
Table 29 China: By Market Size, By Type, 2016–2023 (USD Million)
Table 30 China: By Market Size, By Type, 2016–2023 (Million Tons)
Table 31 China: By Market Size, By Application, 2016–2023 (USD Million)
Table 32 China: By Market Size, By Application, 2016–2023 (Million Tons)
Table 33 India: By Market Size, By Type, 2016–2023 (USD Million)
Table 34 India: By Market Size, By Type, 2016–2023 (Million Tons)
Table 35 India: By Market Size, By Application, 2016–2023 (USD Million)
Table 36 India: By Market Size, By Application, 2016–2023 (Million Tons)
Table 37 Japan: By Market Size, By Type, 2016–2023 (USD Million)
Table 38 Japan: By Market Size, By Type, 2016–2023 (Kilotons)
Table 39 Japan: By Market Size, By Application, 2016–2023 (USD Million)
Table 40 Japan: By Market Size, By Application, 2016–2023 (Kilotons)
Table 41 Australia: By Market Size, By Type, 2016–2023 (USD Million)
Table 42 Australia: By Market Size, By Type, 2016–2023 (Kilotons)
Table 43 Australia: By Market Size, By Application, 2016–2023 (USD Million)
Table 44 Australia: By Market Size, By Application, 2016–2023 (Kilotons)
Table 45 Indonesia: By Market Size, By Type, 2016–2023 (USD Million)
Table 46 Indonesia: By Market Size, By Type, 2016–2023 (Kilotons)
Table 47 Indonesia: By Market Size, By Application, 2016–2023 (USD Million)
Table 48 Indonesia: By Market Size, By Application, 2016–2023 (Kilotons)
Table 49 Rest of Asia Pacific: By Market Size, By Type, 2016–2023 (USD Million)
Table 50 Rest of Asia Pacific: By Market Size, By Type, 2016–2023 (Kilotons)
Table 51 Rest of Asia Pacific: By Market Size, By Application, 2016–2023 (USD Million)
Table 52 Rest of Asia Pacific: By Market Size, By Application, 2016–2023 (Kilotons)
Table 53 North America: By Market Size, By Country, 2016–2023 (USD Million)
Table 54 North America: By Market Size, By Country, 2016–2023 (Million Tons)
Table 55 North America: By Market Size, By Type, 2016–2023 (USD Million)
Table 56 North America: By Market Size, By Type, 2016–2023 (Million Tons)
Table 57 North America: By Market Size, By Application, 2016–2023 (USD Million)
Table 58 North America: By Ash Market Size, By Application, 2016–2023 (Million Tons)
Table 59 US: By Market Size, By Type, 2016–2023 (USD Million)
Table 60 US: By Market Size, By Type, 2016–2023 (Kilotons)
Table 61 US: By Market Size, By Application, 2016–2023 (USD Million)
Table 62 US: By Market Size, By Application, 2016–2023 (Kilotons)
Table 63 Canada: By Market Size, By Type, 2016–2023 (USD Million)
Table 64 Canada: By Market Size, By Type, 2016–2023 (Kilotons)
Table 65 Canada: By Market Size, By Application, 2016–2023 (USD Million)
Table 66 Canada: By Market Size, By Application, 2016–2023 (Kilotons)
Table 67 Mexico: By Market Size, By Type, 2016–2023 (USD Million)
Table 68 Mexico: By Market Size, By Type, 2016–2023 (Kilotons)
Table 69 Mexico: By Market Size, By Application, 2016–2023 (USD Million)
Table 70 Mexico: By Market Size, By Application, 2016–2023 (Kilotons)
Table 71 Europe: By Market Size, By Country, 2016–2023 (USD Million)
Table 72 Europe: By Market Size, By Country, 2016–2023 (Million Tons)
Table 73 Europe: By Market Size, By Type, 2016–2023 (USD Million)
Table 74 Europe: By Market Size, By Type, 2016–2023 (Million Tons)
Table 75 Europe: By Market Size, By Application, 2016–2023 (USD Million)
Table 76 Europe: By Market Size, By Application, 2016–2023 (Million Tons)
Table 77 Germany: By Market Size, By Type, 2016–2023 (USD Million)
Table 78 Germany: By Market Size, By Type, 2016–2023 (Kilotons)
Table 79 Germany: By Market Size, By Application, 2016–2023 (USD Million)
Table 80 Germany: By Market Size, By Application, 2016–2023 (Kilotons)
Table 81 UK: By Market Size, By Type, 2016–2023 (USD Million)
Table 82 UK: By Market Size, By Type, 2016–2023 (Kilotons)
Table 83 UK: By Market Size, By Application, 2016–2023 (USD Million)
Table 84 UK: By Market Size, By Application, 2016–2023 (Kilotons)
Table 85 Poland: By Market Size, By Type, 2016–2023 (USD Million)
Table 86 Poland: By Market Size, By Type, 2016–2023 (Kilotons)
Table 87 Poland: By Market Size, By Application, 2016–2023 (USD Million)
Table 88 Poland: By Market Size, By Application, 2016–2023 (Kilotons)
Table 89 Spain: By Market Size, By Type, 2016–2023 (USD Million)
Table 90 Spain: By Market Size, By Type, 2016–2023 (Kilotons)
Table 91 Spain: By Market Size, By Application, 2016–2023 (USD Million)
Table 92 Spain: By Market Size, By Application, 2016–2023 (Kilotons)
Table 93 France: By Market Size, By Type, 2016–2023 (USD Million)
Table 94 France: By Market Size, By Type, 2016–2023 (Kilotons)
Table 95 France: By Market Size, By Application, 2016–2023 (USD Million)
Table 96 France: By Market Size, By Application, 2016–2023 (Kilotons)
Table 97 Italy: By Market Size, By Type, 2016–2023 (USD Million)
Table 98 Italy: By Market Size, By Type, 2016–2023 (Kilotons)
Table 99 Italy: By Market Size, By Application, 2016–2023 (USD Million)
Table 100 Italy: By Market Size, By Application, 2016–2023 (Kilotons)
Table 101 Rest of Europe: By Market Size, By Type, 2016–2023 (USD Million)
Table 102 Rest of Europe: By Market Size, By Type, 2016–2023 (Kilotons)
Table 103 Rest of Europe: By Market Size, By Application, 2016–2023 (USD Million)
Table 104 Rest of Europe: By Market Size, By Application, 2016–2023 (Kilotons)
Table 105 Middle East & Africa: By Market Size, By Country, 2016–2023 (USD Million)
Table 106 Middle East & Africa: By Market Size, By Country, 2016–2023 (Million Tons)
Table 107 Middle East & Africa: By Market Size, By Type, 2016–2023 (USD Million)
Table 108 Middle East & Africa: By Market Size, By Type, 2016–2023 (Million Tons)
Table 109 Middle East & Africa: By Market Size, By Application, 2016–2023 (USD Million)
Table 110 Middle East & Africa: By Market Size, By Application, 2016–2023 (Million Tons)
Table 111 South Africa: By Market Size, By Type, 2016–2023 (USD Million)
Table 112 South Africa: By Market Size, By Type, 2016–2023 (Kilotons)
Table 113 South Africa: By Market Size, By Application, 2016–2023 (USD Million)
Table 114 South Africa: By Market Size, By Application, 2016–2023 (Kilotons)
Table 115 Saudi Arabia: By Market Size, By Type, 2016–2023 (USD Million)
Table 116 Saudi Arabia: By Market Size, By Type, 2016–2023 (Kilotons)
Table 117 Saudi Arabia: By Market Size, By Application, 2016–2023 (USD Million)
Table 118 Saudi Arabia: By Market Size, By Application, 2016–2023 (Kilotons)
Table 119 Rest of Middle East & Africa: By Market Size, By Type, 2016–2023 (USD Million)
Table 120 Rest of Middle East & Africa: By Market Size, By Type, 2016–2023 (Kilotons)
Table 121 Rest of Middle East & Africa: By Market Size, By Application, 2016–2023 (USD Million)
Table 122 Rest of Middle East & Africa: By Market Size, By Application, 2016–2023 (Kilotons)
Table 123 South America: By Market Size, By Country, 2016–2023 (USD Million)
Table 124 South America: By Market Size, By Country, 2016–2023 (Million Tons)
Table 125 South America: By Market Size, By Type, 2016–2023 (USD Million)
Table 126 South America: By Market Size, By Type, 2016–2023 (Million Tons)
Table 127 South America: By Market Size, By Application, 2016–2023 (USD Million)
Table 128 South America: By Market Size, By Application, 2016–2023 (Million Tons)
Table 129 Brazil: By Market Size, By Type, 2016–2023 (USD Million)
Table 130 Brazil: By Market Size, By Type, 2016–2023 (Million Tons)
Table 131 Brazil: By Market Size, By Application, 2016–2023 (USD Million)
Table 132 Brazil: By Market Size, By Application, 2016–2023 (Million Tons)
Table 133 Argentina: By Market Size, By Type, 2016–2023 (USD Million)
Table 134 Argentina: By Market Size, By Type, 2016–2023 (Million Tons)
Table 135 Argentina: By Market Size, By Application, 2016–2023 (USD Million)
Table 136 Argentina: By Market Size, By Application, 2016–2023 (Million Tons)
Table 137 Rest of South America: By Market Size, By Type, 2016–2023 (USD Million)
Table 138 Rest of South America: By Market Size, By Type, 2016–2023 (Million Tons)
Table 139 Rest of South America: By Market Size, By Application, 2016–2023 (USD Million)
Table 140 Rest of South America: By Market Size, By Application, 2016–2023 (Million Tons)
Table 141 Expansions, 2012-2018
Table 142 Acquisitions, 2017-2018
Table 143 Agreements, 2014-2016
Table 144 Joint Ventures, 2016
Table 145 Partnerships, 2017
List of Figures (32 Figures)
Figure 1 Fly Ash Market Segmentation
Figure 2 Fly Ash Market: Research Design
Figure 3 Breakdown of Primary Interviews
Figure 4 Bottom-Up Approach
Figure 5 Top-Down Approach
Figure 6 Fly Ash Market: Data Triangulation
Figure 7 Class F Segment Projected to Lead Fly Ash Market Between 2018 and 2023
Figure 8 Portland Cement & Concrete Segment Projected to Lead Fly Ash Market During Forecast Period
Figure 9 Asia Pacific Estimated to Lead Fly Ash Market in 2018
Figure 10 Growth of Construction Industry Expected to Drive Fly Ash Market Between 2018 and 2023
Figure 11 Fly Ash Market in Asia Pacific Projected to Grow at Highest CAGR During Forecast Period
Figure 12 Class F Application Segment Estimated to Account for Largest Share of Asia Pacific Fly Ash Market in 2018
Figure 13 Portland Cement & Concrete Segment Estimated to Account for Largest Share of Fly Ash Market Across All Regions in 2018
Figure 14 China Projected to Lead Fly Ash Market Between 2018 and 2023
Figure 15 Drivers, Restraints, Opportunities, and Challenges in the Fly Ash Market
Figure 16 Fly Ash Market: Porter’s Five Forces Analysis
Figure 17 Fly Ash Market, By Type, 2018 & 2023 (USD Million)
Figure 18 Portland Cement & Concrete Segment to Lead Fly Ash Market During Forecast Period
Figure 19 Fly Ash Market: Country-Wise Growth
Figure 20 Asia Pacific Fly Ash Market Snapshot
Figure 21 North America Fly Ash Market Snapshot
Figure 22 Europe Fly Ash Market Snapshot
Figure 23 Middle East & Africa Fly Ash Market Snapshot
Figure 24 South America Fly Ash Market Snapshot
Figure 25 Companies in the Fly Ash Market Adopted Organic and Inorganic Growth Strategies Between 2012 and 2018
Figure 26 Fly Ash Market Ranking, By Company, 2018
Figure 27 Boral Limited: Company Snapshot
Figure 28 Boral Limited: SWOT Analysis
Figure 29 Charah Solutions: SWOT Analysis
Figure 30 Cemex: Company Snapshot
Figure 31 Cemex: SWOT Analysis
Figure 32 Lafarge North America: SWOT Analysis


Growth opportunities and latent adjacency in Fly Ash Market