Feed Amino Acids Market by Type (Lysine, Methionine, Threonine, Tryptophan), Livestock (Ruminants, Swine, Poultry, Aquaculture), Form (Dry, Liquid), and Region (North America, Europe, Asia Pacific, South America and RoW) - Forecast to 2022


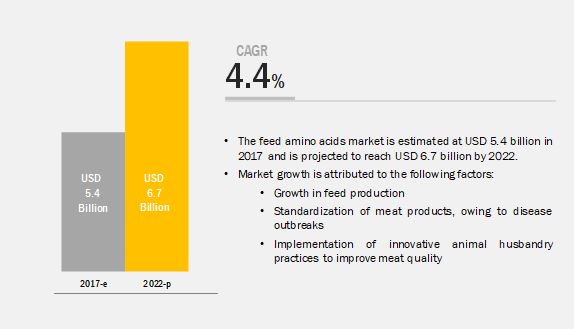
MarketsandMarkets forecasts the feed amino acids market to grow from USD 5.4 billion in 2017 to USD 6.7 billion by 2022, at a Compound Annual Growth Rate (CAGR) of 4.4% during the forecast period. The major factors that are expected to be driving the market are standardization of meat products owing to disease outbreaks, growth in feed production, and implementation of innovative animal husbandry practices to improve meat quality. The objective of the report is to define, describe, and forecast the feed amino acid market size based on type, livestock, source, form, and region.
Attractive Opportunities in the Feed Amino Acids Market
Source: Investor Presentation, Secondary Literature, Expert Interviews, and MarketsandMarkets Analysis
By type, the threonine segment is expected to grow at the highest growth rate during the forecast period
Among the types segment, the threonine segment is expected to grow at the highest CAGR during the forecast period. The primary purpose of adding threonine in feed is to enhance protein synthesis and weight gain. Apart from this, it also helps in maintaining immunity and gut integrity. Its deficiency impacts animal growth and could result in digestive problems. L-threonine also helps in better utilization of lysine, optimizes feed formulations, and reduces the cost of animal production and nitrogen excretion. Such factors drive the threonine segment of the market.
By livestock, the poultry segment to record the largest market share during the forecast period
The poultry livestock type recorded largest market share in the 2016. Growth in concerns about animal health and rise in awareness about the benefits of amino acids in feedstuffs have led to an exponential growth of the poultry feed amino acids market. On a global level, the total poultry production has been increasing; with the rise in poultry production and consumption, it has become important for meat producers to focus more on the quality of meat.
Source: Investor Presentation, Secondary Literature, Expert Interviews, and MarketsandMarkets Analysis
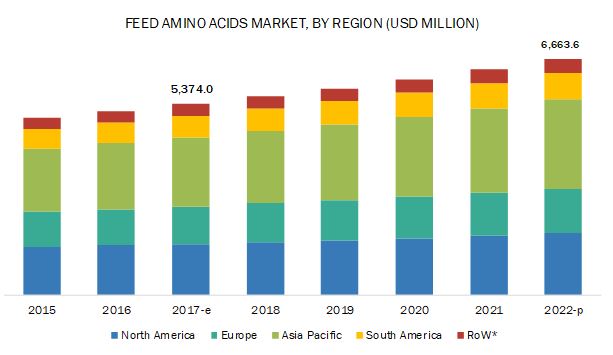
Asia Pacific to account for the largest market size during the forecast period.
Asia Pacific is expected to hold the largest market size in the market during the forecast period, followed by the North American region. The highest market share of Asia Pacific is due to the rapid industrialization and urbanization has helped in increasing the per capita income of the people of its region, and the increase in disposable income levels has led to the growth in demand of the protein-rich food. There has been a decrease in the number of feed mills, particularly in countries such as India, South Korea, and Vietnam, by around 39%, 18%, and 13%, respectively, in 2016, when compared to that of 2015. This reduction in the number of feed mills reflects that there has been a consolidation of agricultural and feed production, in spite of the continuous growth in the consumption of animal protein. This drives the feed amino acids market in the region.
Market Dynamics
Growth in feed production
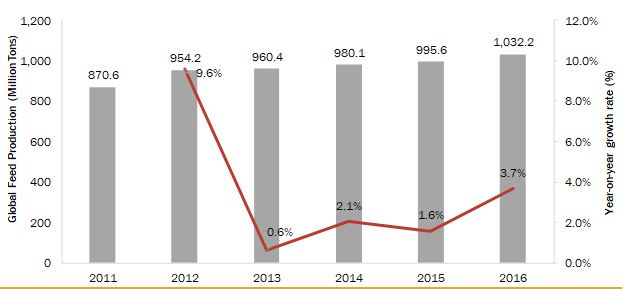
The global feed production has increased consistently in the recent past, driven primarily by the demand side factors, including an increase in livestock production & consumption and the resultant population. Other factors that impact the volume of feed production include the increase in commercialization of livestock rearing practices, particularly in the developing economies.
Global Feed Production Trend, 2011–2016 (Million Tons)
Source: 2017 Alltech Global Feed Survey
According to the 2017 Alltech Global Feed Survey, the global feed production crossed the billion-ton mark in 2016, and over the period 2011–16, the production in terms of volume increased by over 160 million tons.
Asia Pacific—owing to its large livestock population—accounted for the highest feed production of over 367.6 million tons, while Europe, North America, Latin America, and the Middle East & Africa followed with a production of 249.4 million tons, 191.1 million tons, 157.5 million tons, and 66.6 million tons, respectively.
China was the largest producer of feed globally, with a volume production of over 187.2 million tons in 2016. It was followed by the US, which registered a feed production of about 169.7 million tons in the same year.
Owing to the growth in awareness about the benefits and the rise in acceptance, the penetration rate of feed additives among feed products is slated to increase, provided that any adverse regulatory stance does not have an impact on the growth. Assuming that the inclusion rate of amino acids in feed (amount of amino acid per unit of feed) remains constant in the future, the growth of the global feed industry and rise in the penetration of additives are expected to drive the market for amino acids, which has a direct correlation with the feed production volume.
Alternative protein sources
There are several feed sources that can provide amino acids such as corn grain, corn by-products, and dried distillers’ grains. Soybean meal is usually the most economical source of high-quality protein. It contains less methionine as compared to the needs of a dairy cow for optimal production. Seaweed is a marine alga found in coastal regions and is a renewable natural resource of protein for animal feed. It is rich in minerals, vitamins, and fatty acids, which improve feed quality, thereby decreasing the cost. Sunflower meal is produced by extracting oil from its flower seed. It contains high fiber content and is therefore used in limited quantities.
The high-protein content and cost-efficiency of these alternative sources could act as a restraint for the growth of the amino acids market.
Growth in awareness among consumers about BSE
Traditionally, bone & meat meal were used in feed to provide minerals, protein, vitamins, and energy. Ruminant’s remains were also fed to cattle that contain a protein named prion. It was found to be the root cause of bovine spongiform encephalopathy (BSE), also known as mad cow disease. The major symptoms of the disease were change in the behavior, aggression toward others, head held low, loss of milk yield, and nervousness. It can be easily transmitted to human beings by the intake of contaminated carcasses. Generally, cattle suffering from this disease lose coordination of their legs and body movement. BSE was first suspected in the UK in 1986, followed by North America, Asia, and Europe. Europe in the nineties was struggling with BSE, which paralyzed the animal industry.
In 1997, the FDA prohibited the usage of mammalian protein in animal feed given to ruminants due to the tougher hygiene requirement. This forced the dairy farmers to limit the usage of animal protein, such as blood meal in feed, which accelerated the usage of amino acids in ruminant feed. In several countries, food safety laws are implemented to regain consumer trust in the supply chain. Thus, amino acids have a good opportunity of becoming an ideal replacement for bone and meat meal.
Sustainability of feed and livestock chain
The global feed industry is focusing on improving feed efficiency by improving the feed conversion rates for all major livestock and farmed fish species. The feed and livestock industries can achieve sustainability by developing a harmonized environmental footprint methodology, based on the “life-cycle analysis,” involving the entire chain. The development of common metrics can also help to calculate a broader range of resource efficiency indicators. Efficient usage of feed ingredients can support the reduction of the environmental impact of livestock farming through resource-efficient feed production. Use of co-products from other processing industries can reduce the pressure on land-grown crops.
Scope of the Report
|
Report Metric |
Details |
|
Market size available for years |
2016–2022 |
|
Base year considered |
2016 |
|
Forecast period |
2017–2022 |
|
Forecast units |
Million (USD) |
|
Segments covered |
Type (lysine, methionine, threonine, tryptophan, others), Livestock (ruminants, poultry, swine, aquatic animals, others), Source (natural, and synthetic), Form (dry, liquid), and Region |
|
Geographies covered |
North America, Europe, Asia Pacific, South America, and RoW |
|
Companies covered |
ADM, Sumitomo, Evonik, Ajinomoto Co. Inc., CJ Cheiljedang, ADISSEO, Phibro, Meihua Holdings, Kemin, Global Bio-Chem, Novus, and Sunrise Nutrachem |
The research report categorizes the feed amino acids to forecast the revenues and analyze the trends in each of the following sub-segments:
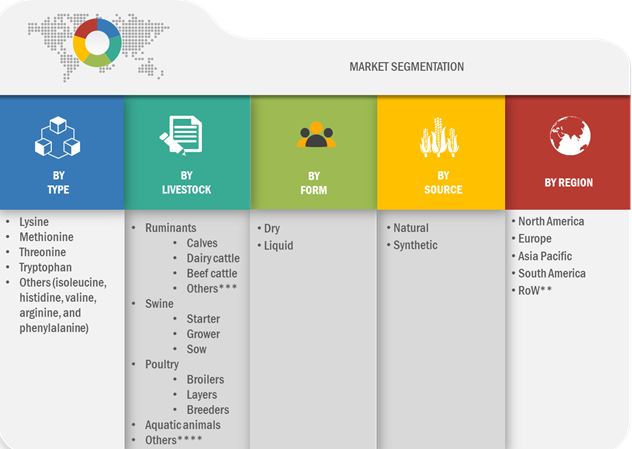
The Feed Amino Acid Market, By Type:
- Lysine
- Methionine
- Threonine
- Tryptophan
- Others
The Feed Amino Acids Market By Livestock:
- Ruminants
- Swine
- Poultry
- Aquatic animals
- Others
The Market By Form:
- Dry
- Liquid
The Feed Amino Acids Market By Source:
- Natural
- Synthetic
The Market By Region:
- North America
- Europe
- Asia Pacific
- South America
- RoW
Key Market Players
ADM, Sumitomo, Evonik, CJ CheilJedang, Ajinomoto, Adisseo, Phibro, Kemin, Global Bio-Chem, Novus, MEIHUA HOLDINGS, and Sunrise Nutrachem. ADM, Sumitomo, Evonik, CJ CheilJedang, and Ajinomoto, which are focusing on expanding their market base in the feed amino acids market. This is successfully achieved with the assistance of numerous market strategies adopted by these companies, which includes mergers & acquisitions, new product launches, agreements, partnerships, collaborations, expansions, regulatory approvals and other strategies.
Recent Developments
-
In January 2017, CJ CheilJedang launched "cysteine," a functional amino acid created with the eco-friendly biological fermentation process, based on raw sugar and glucose. Cysteine is used widely in food additives, seasoning products, and baked goods, as well as in pet food.
-
In August 2017, Ajinomoto Co., Inc. signed an agreement with Meihua Holdings (China), a manufacturer of amino acid-related products, to delegate the manufacture of feed-use lysine and feed-use threonine through Ajinomoto Animal Nutrition Group, Inc. (AANG) (Japan), a consolidated subsidiary of Ajinomoto Co., Inc.
-
In August Meihua Group and Ajinomoto (Tokyo) signed an agreement for the supply of amino acids. Under this agreement, Ajinomoto’s threonine, lysine, and other feed amino acid products sold worldwide were authorized to the Meihua Group for supply.
-
In June 2017, ADM entered into a strategic collaboration with Anco Animal Nutrition Competence (Austria). This allowed ADM to offer amino acid products offered under the Anco’s line of specialty feed ingredients.
-
In October 2017, Sumitomo set up an animal feed analysis capabilities center at the Latin America Research Center, operated by its Group company, Sumitomo Chemical Brazil, which provides technical support services for feed millers who are customers of Sumitomo Chemical’s methionine business.
-
In December 2017, ADM set up building a new, state-of-the-art feed facility to replace its current plant in Columbus, Nebraska. The new facility featured expanded warehouse space to serve customers more quickly and efficiently. This new production line provided a range of products for cattle, dairy cows, and horses. It aims to complete this plant by early 2018.
Critical questions the report answers:
-
Where will all these developments take the industry in the long term?
-
What are the upcoming trends for the feed amino acids market?
-
Which segment provides the most opportunity for growth?
-
Who are the leading vendors operating in this market?
-
What are the opportunities for new market entrants?
To speak to our analyst for a discussion on the above findings, click Speak to Analyst
 Exclusive indicates content/data unique to MarketsandMarkets and not available with any competitors.
Table of Contents
1 Introduction
1.1 Objectives Of the Study
1.2 Market Definition
1.3 Study Scope
1.4 Periodization Considered
1.5 Currency Considered
1.6 Unit Considered
1.7 Stakeholders
1.8 Inclusions & Exclusions
2 Research Methodology
2.1 Research Data
2.1.1 Secondary Research
2.1.2 Primary Research
2.1.2.1 Key Data From Primary Sources
2.1.2.2 Market Data From Primary Sources
2.1.2.3 Breakdown Of Primaries
2.2 Market Size Estimation
2.3 Factor Analysis
2.3.1 Introduction
2.3.2 Demand-Side Analysis
2.3.3 Increase in Global Meat Consumption
2.3.4 Supply-Side Analysis
2.4 Market Size Estimation
2.5 Market Breakdown & Data Triangulation
2.6 Research Assumptions
2.7 Limitations
3 Executive Summary
4 Premium Insights
4.1 Attractive Opportunities in the Market
4.2 North America: Feed Amino Acids Market, By Country, 2018
4.3 Feed Amino Acids Market, By Type and Region, 2018
4.4 Feed Amino Acids Market: Key Countries
5 Market Overview
5.1 Introduction
5.2 Market Dynamics
5.2.1 Drivers
5.2.1.1 Growth in Feed Production
5.2.1.2 Implementation Of Innovative Animal Husbandry Practices To Improve Meat Quality
5.2.1.3 Standardization Of Meat Products Owing To Disease Outbreaks
5.2.1.4 Increase in Support From Governments and Environmentalists
5.2.1.5 Multiple Benefits Associated With Amino Acid Supplementation in Feed
5.2.2 Restraints
5.2.2.1 Alternative Protein Sources
5.2.2.2 Stringent Regulatory Framework
5.2.3 Opportunities
5.2.3.1 Growth in Awareness Among Consumers
5.2.3.2 Increase in Demand for Nutritional Supplements for Monogastric Animals
5.2.4 Challenges
5.2.4.1 Sustainability Of Feed and Livestock Chain
5.3 Value Chain Analysis
5.4 Raw Material Analysis
5.4.1 Total Production Of Feed Ingredients and their Usage in Feed
5.4.2 Price Analysis Of Feed Raw Materials
5.5 Regulations
5.5.1 European Union
5.5.2 US
5.5.3 China
5.5.4 Canada
5.5.5 Brazil
5.5.6 Japan
5.5.7 South Africa
5.6 Adjacent Market Scenario
6 Yc & Ycc Shift
6.1 Yc & Ycc Shift: Hot Bets Impacting New Reveneu Sources
7 Feed Amino Acids Market, By Type
7.1 Introduction
7.2 Lysine
7.2.1 Lysine Increases Feed Efficiency, Increases Digestibility, and Consequently, the Relative Biological Value
7.3 Methionine
7.3.1 Methionine in the Animal Body Can Cause Muscle Atrophy, Velocity Reduction, Decreased Bone Strength, and Fatty Liver
7.4 Threonine
7.4.1 It Enhance Protein Synthesis. Apart From This, It Also Helps in Immunity and Gut Integrity
7.5 Tryptophan
7.5.1 Deficiency Of Tryptophan Affects the Growth Of Animals
7.6 Others
8 Feed Amino Acid Market, By Livestock
8.1 Introduction
8.2 Poultry
8.2.1 Lysine and Methionine Are Some Of the Major Amino Acids Used in Poultry Feed for Better Quality and Quantity Production
8.2.2 Broilers
8.2.3 Layers
8.2.4 Bredders
8.3 Ruminants
8.3.1 Amino Acids Are Fed To Ruminants Due To the Several Advantages and Health Benefits
8.3.2 Calf
8.3.3 Dairy
8.3.4 Beef
8.3.5 Others
8.4 Swine
8.4.1 Soybean Meal Is Usually the Most Economical Source Of High-Quality Protein Fed To Swine
8.4.2 Starter
8.4.3 Grower
8.4.4 Sow
8.5 Aquatic Animals
8.5.1 the Deficiency Of Amino Acids Disturbs Transportation and Storage Of Lipid in the Fish
8.6 Equine
8.6.1 the Addition Of These Amino Acids Not Only Aids in Improving Feed Quality By Improving Feed Intake, But Also Aids in Protecting the Feed Quality
8.7 Pets
8.7.1 Amino Acids Enhance the Body Metabolism, and Contribute To the Development and Growth Of Immune and Reproductive Systems
9 Feed Amino Acids Market, By form
9.1 Introduction
9.2 Dry
9.2.1 Easy Handling and Storability, Usage in A Wide Range Of Livestock Applications, and Lower Manufacturing Costs Are Key Factors Driving the Dry Segment
9.3 Liquid
9.3.1 The Unavailability Of Liquid Feed Amino Acids in Countries in Rest Of the World (Row) Leads To the Smaller Share Of This Segment in the Market
10 Feed Amino Acids Market, By Source
10.1 Introduction
10.2 Natural
10.2.1 There Is An Increasing Demand for Natural Amino Acids for Organic Feed Demand.
10.3 Synthetic
10.3.1 Synthetic Amino Acids (0.1%-0.3%), When Added To Animal Feeds, Help in Saving As Much As 2%-3% Units Of Dietary Protein.
11 Feed Amino Acids Market, By Region
11.1 Introduction
11.2 North America
11.2.1 US
11.2.2 Canada
11.3 Europe
11.3.1 Russia
11.3.2 France
11.3.3 UK
11.3.4 Spain
11.3.5 Italy
11.3.6 Germany
11.3.7 Netherlands
11.3.8 Rest Of Europe
11.4 Asia Pacific
11.4.1 China
11.4.2 India
11.4.3 Japan
11.4.4 South Korea
11.4.5 Australia & New Zealand
11.4.6 Rest Of Asia Pacific
11.5 Latin America
11.5.1 Brazil
11.5.2 Argentina
11.5.3 Mexico
11.5.4 Rest Of Latin America
11.6 Rest Of The World (Row)
11.6.1 Middle East
11.6.2 Africa
12 Competitive Landscape
12.1 Overview
12.2 Competitive Leadership Mapping (Overall Market)
12.2.1 Visionary Leaders
12.2.2 Dynamic Differentiators
12.2.3 Innovators
12.2.4 Emerging Companies
12.3 Ranking Of Key Players, 2018
12.4 Competitive Scenario
12.4.1 Expansions
12.4.2 Acquisitions
12.4.3 Joint Ventures
13 Company Profiles
13.1 Adisseo France Sas.
13.2 Ajinomoto Co. Inc.
13.3 Evonik Ind
13.4 Sumitomo Chemical Company Limited
13.5 Archer Daniels Midland Company (ADM)
13.6 Cj Cheiljedang
13.7 Land O’lakes, Inc
13.8 Meihua Holdings
13.9 Global Bio-Chem
13.10 Novus
13.11 Sunrise Nutrachem.
13.12 Advanced Animal Nutrition Pty Ltd.
14 Appendix
14.1 Discussion Guide
14.2 Knowledge Store: Marketsandmarkets’ Subscription Portal
14.3 Available Customizations
14.4 Related Reports
14.5 Author Details
List of Tables (112 Tables)
Table 1 US Dollar Exchange Rate Considered for Study, 2014–2016
Table 2 Deadline for the Submission Of the Application Of Reevaluation
Table 3 Order Of Limiting Amino Acids
Table 4 Feed Amino Acids Market Size, By Type, 2015–2022 (USD Million)
Table 5 Market Size, By Type, 2015–2022 (KT)
Table 6 Lysine: Amino Acids Market Size, By Region, 2015–2022 (USD Million)
Table 7 Methionine: Amino Acids Market Size, By Region, 2015–2022 (USD Million)
Table 8 Threonine: Amino Acids Market Size, By Region, 2015–2022 (USD Million)
Table 9 Tryptophan: Amino Acids Market Size, By Region, 2015–2022 (USD Million)
Table 10 Other Types: Amino Acids Market Size, By Region, 2015–2022 (USD Million)
Table 11 Lysine: Amino Acids Market Size, By Source, 2015–2022 (USD Million) 55
Table 12 Methionine: Amino Acids Market Size, By Source, 2015–2022 (USD Million)
Table 13 Threonine: Amino Acids Market Size, By Source, 2015–2022 (USD Million)
Table 14 Tryptophan: Amino Acids Market Size, By Source, 2015–2022 (USD Million)
Table 15 Others: Amino Acids Market Size, By Source, 2015–2022 (USD Million)
Table 16 Feed Amino Acids Market Size, By Livestock, 2015–2022 (USD Million)
Table 17 Market Size, By Livestock, 2015–2022 (KT)
Table 18 Feed Amino Acids for Ruminants Market Size, By Type, 2015–2022 (USD Million)
Table 19 Feed Amino Acids for Ruminants Market Size, By Region, 2015–2022 (USD Million)
Table 20 Feed Amino Acids for Ruminants Market Size, By Region, 2015–2022 (KT)
Table 21 Feed Amino Acids for Poultry Market Size, By Type, 2015–2022 (USD Million)
Table 22 Feed Amino Acids for Poultry Market Size, By Region, 2015–2022 (USD Million)
Table 23 Feed Amino Acids for Poultry Market Size, By Region, 2015–2022 (KT)
Table 24 Feed Amino Acids for Swine Market Size, By Type, 2015–2022 (USD Million)
Table 25 Feed Amino Acids for Swine Market Size, By Region, 2015–2022 (USD Million)
Table 26 Feed Amino Acids for Swine Market Size, By Region, 2015–2022 (KT)
Table 27 Feed Amino Acids for Aquaculture Market Size, By Type, 2015–2022 (USD Million)
Table 28 Feed Amino Acids for Aquaculture Market Size, By Region, 2015–2022 (USD Million)
Table 29 Feed Amino Acids for Aquaculture Market Size, By Region, 2015–2022 (KT)
Table 30 Feed Amino Acids for Others Market Size, By Region, 2015–2022 (USD Million)
Table 31 Feed Amino Acids for Others Market Size, By Region, 2015–2022 (KT)
Table 32 Feed Amino Acids Market Size, By Form, 2015–2022 (USD Million)
Table 33 Market Size, By Form, 2015–2022 (KT)
Table 34 Dry Feed Amino Acids Market Size, By Region, 2015–2022 (USD Million)
Table 35 Liquid Feed Amino Acids Market Size, By Region, 2015–2022 (USD Million)
Table 36 Feed Amino Acids Market Size, By Source, 2015–2022 (USD Million)
Table 37 Market Size, By Source, 2015–2022 (KT)
Table 38 Dry Feed Amino Acids Market Size, By Region, 2015–2022 (USD Million)
Table 39 Liquid Feed Amino Acids Market Size, By Region, 2015–2022 (USD Million)
Table 40 Feed Amino Acids Market Size, By Region, 2015–2022 (USD Million)
Table 41 Market Size, By Region, 2015–2022 (KT)
Table 42 North America: Feed Amino Acids Market Size, By Country, 2015–2022 (USD Million)
Table 43 North America: Market Size, By Country, 2015–2022 (KT)
Table 44 North America: Market Size, By Type, 2015–2022 (USD Million)
Table 45 North America: Market Size, By Livestock, 2015–2022 (USD Million)
Table 46 North America: Market Size, By Livestock, 2015–2022 (KT)
Table 47 North America: Market Size, By Form, 2015–2022 (USD Million)
Table 48 North America: Market Size, By Source 2022 (USD Million)
Table 49 North America: Feed Amino Acids Market Size, By Source 2022 (KT)
Table 50 Us: Feed Amino Acids Market Size, By Livestock, 2015–2022 (USD Million)
Table 51 Canada: Feed Amino Acids Market Size, By Livestock, 2015–2022 (USD Million)
Table 52 Mexico: Feed Amino Acids Market Size, By Livestock, 2015–2022 (USD Million)
Table 53 Europe: Feed Amino Acids Market Size, By Country, 2015–2022 (USD Million)
Table 54 Europe: Market Size, By Country, 2015–2022 (KT)
Table 55 Europe: Market Size, By Type, 2015–2022 (USD Million)
Table 56 Europe: Market Size, By Livestock, 2015–2022 (USD Million)
Table 57 Europe: Market Size, By Livestock, 2015–2022 (KT)
Table 58 Europe: Market Size, By Form, 2015–2022 (USD Million)
Table 59 Europe: Market Size, By Source 2022 (USD Million)
Table 60 Europe: Market Size, By Source 2022 (KT)
Table 61 Spain: Feed Amino Acids Market Size, By Livestock, 2015–2022 (USD Million)
Table 62 Russia: Market Size, By Livestock, 2015–2022 (USD Million)
Table 63 Germany: Feed Amino Acids Market Size, By Livestock, 2015–2022 (USD Million)
Table 64 France: Feed Amino Acids Market Size, By Livestock, 2015–2022 (USD Million)
Table 65 Italy: Feed Amino Acids Market Size, By Livestock, 2015–2022 (USD Million)
Table 66 UK: Feed Amino Acids Market Size, By Livestock, 2015–2022 (USD Million)
Table 67 Rest Of Europe: Feed Amino Acids Market Size, By Livestock, 2015–2022 (USD Million)
Table 68 Asia Pacific: Feed Amino Acids Market Size, By Country, 2015–2022 (USD Million)
Table 69 Asia Pacific: Market Size, By Country, 2015–2022 (KT)
Table 70 Asia Pacific: Market Size, By Type, 2015–2022 (USD Million)
Table 71 Asia Pacific: Market Size, By Livestock, 2015–2022 (USD Million)
Table 72 Asia Pacific: Market Size, By Livestock, 2015–2022 (KT)
Table 73 Asia Pacific: Market Size, By Form, 2015–2022 (USD Million)
Table 74 Asia Pacific: Market Size, By Source 2022 (USD Million)
Table 75 Asia Pacific: Market Size, By Source 2022 (KT)
Table 76 China: Feed Amino Acids Market Size, By Livestock, 2015–2022 (USD Million)
Table 77 India: Feed Amino Acids Market Size, By Livestock, 2015–2022 (USD Million)
Table 78 Japan: Feed Amino Acids Market Size, By Livestock, 2015–2022 (USD Million)
Table 79 Thailand: Feed Amino Acids Market Size, By Livestock, 2015–2022 (USD Million)
Table 80 Indonesia: Feed Amino Acids Market Size, By Livestock, 2015–2022 (USD Million)
Table 81 Australia & New Zealand: Feed Amino Acids Market Size, By Livestock, 2015–2022 (USD Million) Table 82 South Korea: Feed Amino Acids Market Size, By Livestock, 2015–2022 (USD Million)
Table 83 Vietnam: Feed Amino Acids Market Size, By Livestock, 2015–2022 (USD Million)
Table 84 Rest Of Asia Pacific: Feed Amino Acids Market Size, By Livestock, 2015–2022 (USD Million)
Table 85 South America: Feed Amino Acids Market Size, By Country, 2015–2022 (USD Million)
Table 86 South America: Market Size, By Country, 2015–2022 (KT)
Table 87 South America:Market Size, By Type, 2015–2022 (USD Million)
Table 88 South America: Market Size, By Livestock, 2015–2022 (USD Million)
Table 89 South America: Market Size, By Livestock, 2015–2022 (KT)
Table 90 South America: Market Size, By Form, 2015–2022 (USD Million)
Table 91 South America: Market Size, By Source 2022 (USD Million)
Table 92 South America: Market Size, By Source 2022 (KT)
Table 93 Brazil: Feed Amino Acids Market Size, By Livestock, 2015–2022 (USD Million)
Table 94 Argentina: Feed Amino Acids Market Size, By Livestock, 2015–2022 (USD Million)
Table 95 Chile: Feed Amino Acids Market Size, By Livestock, 2015–2022 (USD Million)
Table 96 Rest Of South America: Feed Amino Acids Market Size, By Livestock, 2015–2022 (USD Million)
Table 97 Row: Feed Amino Acids Market Size, By Region, 2015–2022 (USD Million)
Table 98 Row: Market Size, By Region, 2015–2022 (KT)
Table 99 Row: Market Size, By Type, 2015–2022 (USD Million)
Table 100 Row: Market Size, By Livestock, 2015–2022 (USD Million)
Table 101 Row: Market Size, By Livestock, 2015–2022 (KT)
Table 102 Row: Market Size, By Form, 2015–2022 (USD Million)
Table 103 Row: Market Size, By Source 2022 (USD Million)
Table 104 Row: Market Size, By Source 2022 (KT)
Table 105 Middle East: Feed Amino Acids Market Size, By Livestock, 2015–2022 (USD Million)
Table 106 Africa: Feed Amino Acids Market Size, By Livestock, 2015–2022 (USD Million)
Table 107 Mergers & Acquisitions, 2013–2017
Table 108 New Product Launches, 2014–2017
Table 109 Agreements, Partnerships, and Collaborations, 2013–2017
Table 110 Expansions & Investments, 2016–2017
Table 111 Regulatory Approvals, 2014–2016
Table 112 Others, 2012–2017
List of Figures (53 Figures)
Figure 1 Market Segmentation
Figure 2 Feed Amino Acids: Livestock Segmentation
Figure 3 Geographic Segmentation
Figure 4 Research Design
Figure 5 Breakdown Of Primaries: By Company, Designation, and Region
Figure 6 Market Size Estimation Methodology: Bottom-Up Approach
Figure 7 Market Size Estimation Methodology: Top-Down Approach
Figure 8 Data Triangulation Methodology
Figure 9 Feed Amino Acids Market Size, By Type, 2017 vs 2022
Figure 10 Market Size, By Livestock, 2017 vs 2022
Figure 11 Market Size, By Form, 2017 vs 2022
Figure 12 Market Size, By Region, 2016
Figure 13 Growing Meat and Dairy Product Industries To Drive the Feed Amino Acid Market
Figure 14 Lysine Segment Is Estimated To Record the Largest Share Across All Regions in 2017
Figure 15 Poultry Segment To Account for the Largest Share In Asia Pacific in 2017
Figure 16 Poultry Estimated To Be the Largest Segment Across All Regions Except Europe in 2017
Figure 17 Asia Pacific Is Estimated To Be the Leading Region for Both forms in 2017
Figure 18 Global Livestock Production Index (2000–2013)
Figure 19 Animal-Based Product Consumption, By Commodity (1967–2030)
Figure 20 Livestock Population Count (2010 vs 2014)
Figure 21 Global Permanent Meadows and Pasture Land Area (1985–2014)
Figure 22 Global Meadows and Permanent Pasture Land Area, Decadal Average (1965–2014)
Figure 23 Feed Amino Acid Market: Drivers, Restraints, Opportunities, and Challenges
Figure 24 Global Feed Production Trend, 2011–2016 (Million Tons)
Figure 25 Regional Feed Production Snapshot, 2016 (Million Tons)
Figure 26 Leading Feed-Producing Countries, 2016 (Million Tons)
Figure 27 Value Chain Analysis
Figure 28 Supply Chain Analysis
Figure 29 Lysine Segment Is Projected To Dominate the Feed Amino Acids Market Through 2022
Figure 30 Asia Pacific Is Projected To Dominate the Lysine Segment Through 2022
Figure 31 Poultry Is Projected To Be the Fastest-Growing Segment Between 2017 & 2022
Figure 32 Asia Pacific Is Projected To Dominate the Market for Feed Amino Acids for Poultry Through 2022
Figure 33 Dry Segment Is Projected To Dominate the Market Through 2022
Figure 34 Asia Pacific Is Projected To Be the Fastest-Growing Market Between 2017 & 2022
Figure 35 Geographic Snapshot (2017–2022): Rapidly Growing Markets Are Emerging As New Hot Spots
Figure 36 North America: Feed Amino Acid Market Snapshot
Figure 37 Asia Pacific: Feed Amino Acids Market Snapshot
Figure 38 Key Developments By Leading Players In the Feed Amino Acid Market for 2012-2017
Figure 39 Feed Amino Acid Market Share, By Key Company, 2016
Figure 40 Geographical Revenue Mix Of Top Five Market Players
Figure 41 ADM: Company Snapshot
Figure 42 ADM : SWOT Analysis
Figure 43 Sumitomo: Company Snapshot
Figure 44 Sumitomo : SWOT Analysis
Figure 45 Evonik: Company Snapshot
Figure 46 Evonik: SWOT Analysis
Figure 47 Cj Cheiljedang: Company Snapshot
Figure 48 Cj Cheiljedang: SWOT Analysis
Figure 49 Ajinomoto Co., Inc.: Company Snapshot
Figure 50 Ajinomoto Co., Inc.: SWOT Analysis
Figure 51 Adisseo: Company Snapshot
Figure 52 Phibro: Company Snapshot
Figure 53 Global Bio-Chem: Company Snapshot


Growth opportunities and latent adjacency in Feed Amino Acids Market