Military Electro-Optics/Infrared (EO/IR) Systems Market

Military Electro-Optics/Infrared (EO/IR) Systems Market by Product Type (Handheld Systems, EO/IR Payloads), Platform, Component, Cooling Technology, Sensor Technology, Imaging Technology, Point of Sale, and Region - Global Forecast to 2028

Report Code: AS 2888 Apr, 2023, by marketsandmarkets.com

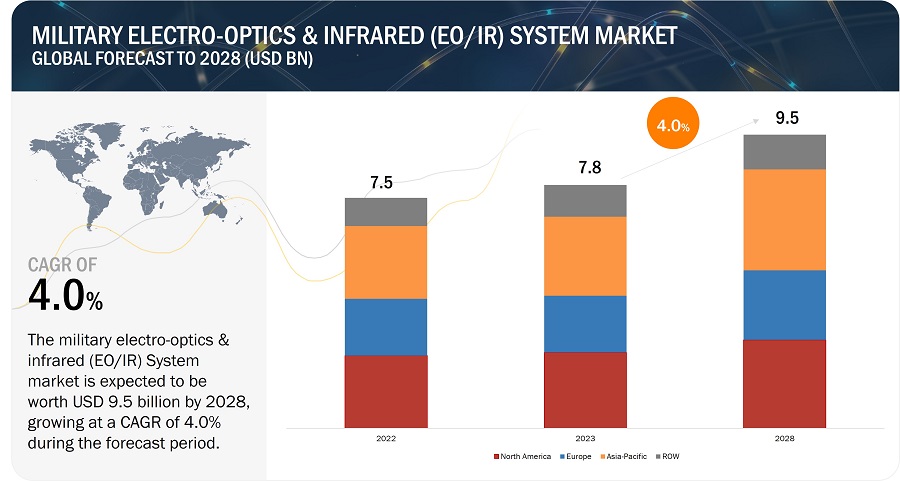
The Military Electro-optics & Infrared (EO/IR) System Market is estimated to be USD 7.8 billion in 2023 and is projected to reach USD 9.5 billion by 2028, at a CAGR of 4.0% from 2023 to 2028. The market is driven by factors such as different value chain levels for vendors, increased use of military electro-optics & infrared (EO/IR) System in military operations among others.
Military Electro-Optics/Infrared (EO/IR) Systems Market

Military Electro-Optics/Infrared (EO/IR) Systems Market

Military Electro-Optics/Infrared (EO/IR) Systems Market Forecast to 2028

To know about the assumptions considered for the study, Request for Free Sample Report

Military electro-optics & infrared (EO/IR) System Market Dynamics:

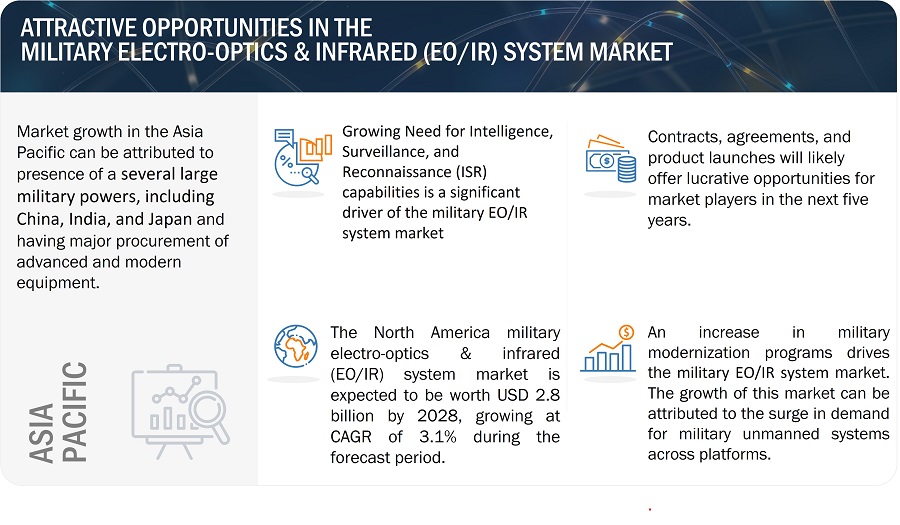
Drivers: Growing Need for Intelligence, Surveillance, and Reconnaissance (ISR)

The military requires reliable and accurate Intelligence, Surveillance, and Reconnaissance (ISR) capabilities to gather critical information about enemy forces, terrain, and other aspects of the battlefield. This information is crucial in determining the best course of action for military operations, as well as assessing the effectiveness of those operations. EO/IR sensors are a critical component of ISR capabilities, as they provide real-time situational awareness and surveillance capabilities. EO/IR sensors can detect, track, and identify potential threats in various lighting and weather conditions, providing critical information for military operations.

The growing need for ISR capabilities is driven by the changing nature of modern warfare. Militaries are increasingly facing asymmetrical threats, such as terrorism and insurgency, which require accurate and reliable intelligence to identify and neutralize potential threats. Furthermore, militaries are increasingly operating in urban environments, where traditional ISR methods may not be effective. In these environments, EO/IR sensors can provide valuable intelligence by detecting and tracking potential threats in real time. The demand for ISR capabilities is also driven by the need for increased efficiency in military operations. Accurate and reliable intelligence can help reduce the risks associated with military operations, as well as improve decision-making in critical situations.

Globally, the demand for robots is increasing as they are used for carrying out target acquisition and surveillance operations by defense forces of different countries. Companies like Northrup Grumman Corporation (US), L3Harris Technologies Inc. (US), IAI (Israel), and Elbit System (Israel), Raytheon Technologies Corporation (US), Thales Group (France), BAE System (UK) are developing military robots with intelligence, surveillance, reconnaissance (ISR), and target acquisition capabilities.

Overall, the growing need for ISR capabilities is a significant driver of the Military EOIR Market, as militaries continue to invest in advanced sensors that can provide real-time situational awareness and surveillance capabilities.

Restraints: Stagnant product life cycle

The life cycle for electro-optics/infrared systems varies from 10-15 years; these systems are upgraded post the mentioned time frame. Therefore, the market is prone to being stagnant in the technological front for a long time. The Military Electro optical and Infrared system market is also broadly dependent on the new line of aircraft and armored vehicles, as well as ships and submarines that are yet to be manufactured. In addition, the upgraded hardware or newly manufactured hardware might not be compatible with other parts of the EO/IR systems.

Opportunities: Integration of electro-optics/infrared systems with conventional military systems.

The military & defense community is currently facing the issue of obsolescence. The defense industry is a technology-driven industry; the need to upgrade systems in the defense industry is greater in comparison to other industries. Defense forces worldwide are required to support legacy systems, while constantly upgrading the existing systems with new technological capabilities. The best approach to preserve and extend the life of aging military systems is the addition of modern protocol devices. System manufacturers are currently focused on integrating electro-optics/infrared systems with traditional military systems. For instance, Wide Area Persistent Surveillance System (AWAPSS) manufactured by BAE Systems (UK) is integrated into an old in-service military aircraft for improved surveillance.

Challenges: Complexity involved in integration of EO/IR System with wide range of platforms.

Integrating a EO/IR system with standalone solutions to the desired level has always been a complex task. EO/IR system can be equipped with weapon gun systems, ISR system, CS4I System and their integration requires significant investments and power sources. The level of complexity increases with the decrease in the amount of space available on platforms. Thus, combat helicopters have the highest complications in integration, followed by armored vehicles and ships.

Military EO/IR systems must be integrated with other systems, including command and control systems, radar systems, and communications networks. This integration can be challenging and may require significant customization and testing to ensure compatibility and optimal performance.

Military Electro-Optics & Infrared (Eo/Ir) System Market Ecosystem
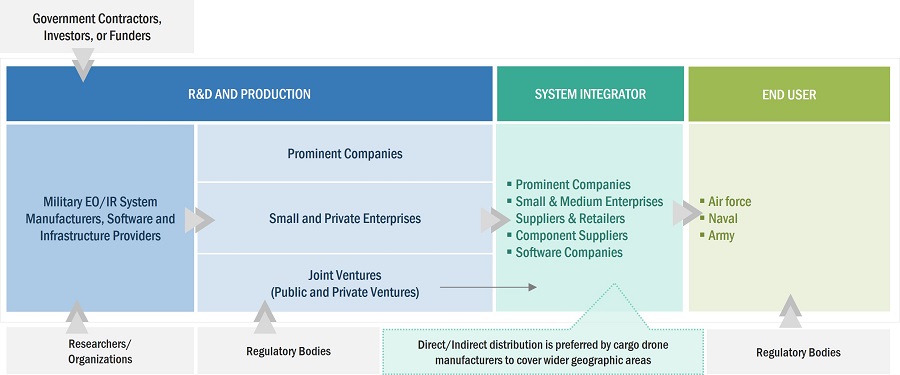
Military Electro-Optics/Infrared (EO/IR) Systems Market by Ecosystem

Based on product type, the handheld system segment is projected to grow at the highest CAGR in the military electro-optics & infrared (EO/IR) System market during the forecast period

Based on product type, the Military Electro-Optics & Infrared (EO/IR) System Industry has been segmented into handheld system and EO/IR payload. Need to support to soldiers in battlefield and to remote places is driving the handheld system of military electro-optics & infrared (EO/IR) System market.

Based on platform, the land segment is projected to grow at the highest CAGR in the military electro-optics & infrared (EO/IR) System during the forecast period

Based on platform, the Military Electro optical and Infrared system market has been segmented into land, airborne, naval. The land segment is expected to grow at a higher CAGR during the forecast period. The increasing need to vehicle and soldier system in military application is driving this segment of the market.

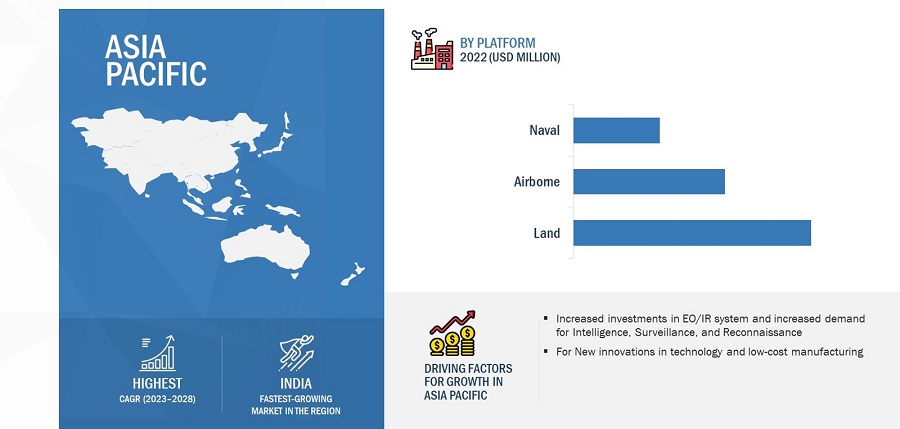
Asia Pacific is expected to account for the highest CAGR in the forecasted period and largest share in 2022.

The Asia Pacific is estimated to account for the highest CAGR in forecasted period and largest share in 2022. The countries in Asia Pacific region offers significant opportunities for EO/IR system manufacturers as this region has been upgrading its soldier system and modernization military equipment by establishing new developments in the EO/IR system market. Increasing EO/IR system investments in countries such as India, China and Japan are driving the growth of this region.
Military Electro-Optics/Infrared (EO/IR) Systems Market by Region

Military Electro-Optics/Infrared (EO/IR) Systems Market by Region

To know about the assumptions considered for the study, download the pdf brochure

Key Market Players

Major players operating in the Military Electro-Optics & Infrared (EO/IR) Companies include Northrop Grumman(US), Raytheon Technologies Corporation(US), L3Harris Technologies Inc. (US), Lockheed Martin Corporation (US) and Thales Group(France), Teledyne FLIR (US), Elbit System (Israel), BAE System (UK), Aselsan AS (Turkey).

Want to explore hidden markets that can drive new revenue in Military Electro-Optics/Infrared (EO/IR) Systems Market?

Scope of the Report

This research report categorizes

Report Metric

Details

Growth Rate

4.0%

Estimated Market Size in 2023

USD 7.8 Billion

Projected Market Size in 2028

USD 9.5 Billion

Market Size Available for Years

2019–2028

Base Year Considered

2022

Forecast Period

2023–2028

Forecast Units

Value (USD billion)

Segments Covered

Cooling Technology, Imaging Technology, Sensor Technology, Product Type, Platform, Component, Point of Sale, Region

Geographies Covered

North America, Europe, Asia Pacific, Rest of the World

Companies Covered

Northrop Grumman Corporation(US), Raytheon Technologies Corporation(US), L3Harris Technologies Inc.(US), Lockheed Martin Corporation (US), Thales Group (France), Aselsan AS (Turkey), Teledyne FLIR (US), BAE System (UK), Elbit System (Israel), Rheinmetall AG (Germany), Alpha Design Technologies (India)

Military Electro-Optics/Infrared (EO/IR) Systems Market Highlights

This research report categorizes the military EO/IR system market based on Cooling Technology, Imaging Technology, Sensor Technology, Product Type, Platform, Component, Point of Sale

Segment

Subsegment

By Cooling Technology:

  • Cooled
  • Uncooled

By Sensor Technology:

  • Staring Sensor
  • Scanning Sensor

By Component:

  • Human Machine Interfaces
  • Stabilization Units
  • Control Systems
  • Optics
  • Sensors
  • Processor

By Imaging Technology:

  • Multispectral
  • Hyperspectral

By Product Type:

  • Handheld System
  • EO/IR Payload

By Platform:

  • Land
    • Vehicle-Mounted
      • Combat Vehicles
      • Unmanned Ground Vehicles (UGVs)
    • Soldier System
  • Airborne
    • Attack Helicopters
    • Military Aircrafts
      • Fighter aircraft
      • Transport Aircraft
      • Special Mission Aircraft
    • Unmanned Aerial Vehicles (UAVs)
  • Naval
    • Combat Ships
    • Unmanned Surface Vehicles (USVs)

By Point of Sale:

  • OEM
  • Aftermarket

By Region:

  • North America
  • Europe
  • Asia Pacific
  • Rest of the World

Recent Developments

  • In February 2023, The US Marine Corps awarded the initial production and operations contract for the Next Generation Handheld Targeting System (NGHTS).  to Northrop Grumman Corporation. NGHTS is a portable targeting system that offers high-precision targeting and can function in locations without GPS.
  • In July 2022, According to the terms of a USD 22.6 million contract, Combat aircraft specialists at Lockheed Martin Corporation will purchase 22 360-degree electro-optical sensor systems from Raytheon Technologies Corporation for the US F-35 joint strike fighter. Six infrared (IR) cameras are positioned around the aircraft, and the electro-optical DAS gathers real-time, high-resolution imagery from these cameras and delivers it to the pilot's helmet-mounted display, giving them a 360-degree spherical view of the surroundings.
  • In October 2022, For the US Air Force Special Operations Command's AC-130J Ghostrider modernization program, L3Harris Technologies Inc. has provided an imaging system. L3Harris delivered its WESCAM MX-25D, the company's 6,000th such system, to act as the primary imaging asset for the heavy ground-attack aircraft. Electro-optical/infrared WESCAM MX-25D is a capability for intelligence, surveillance, and reconnaissance.

Frequently Asked Questions (FAQ):

To speak to our analyst for a discussion on the above findings, click Speak to Analyst

Exclusive indicates content/data unique to MarketsandMarkets and not available with any competitors.

TABLE OF CONTENTS
 
1 INTRODUCTION (Page No. - 25)
    1.1 STUDY OBJECTIVES 
    1.2 MARKET DEFINITION 
    1.3 STUDY SCOPE 
           1.3.1 MARKETS COVERED
                    FIGURE 1 MILITARY EO/IR SYSTEMS MARKET SEGMENTATION
           1.3.2 REGIONS COVERED
           1.3.3 YEARS CONSIDERED
    1.4 INCLUSIONS AND EXCLUSIONS 
           TABLE 1 INCLUSIONS AND EXCLUSIONS
    1.5 CURRENCY AND PRICING 
           TABLE 2 USD EXCHANGE RATES
    1.6 LIMITATIONS 
    1.7 MARKET STAKEHOLDERS 
    1.8 SUMMARY OF CHANGES 
 
2 RESEARCH METHODOLOGY (Page No. - 31)
    2.1 RESEARCH DATA 
           FIGURE 2 RESEARCH FLOW
           FIGURE 3 RESEARCH DESIGN
           2.1.1 SECONDARY DATA
           2.1.2 PRIMARY DATA
                    2.1.2.1 Key data from primary sources
                    2.1.2.2 Key primary sources
                               FIGURE 4 BREAKDOWN OF PRIMARY INTERVIEWS
    2.2 MARKET SIZE ESTIMATION 
           2.2.1 BOTTOM-UP APPROACH
                    TABLE 3 MARKET ESTIMATION PROCEDURE
                    FIGURE 5 BOTTOM-UP APPROACH
           2.2.2 TOP-DOWN APPROACH
           FIGURE 6 TOP-DOWN APPROACH
    2.3 FACTOR ANALYSIS 
           2.3.1 INTRODUCTION
           2.3.2 DEMAND-SIDE INDICATORS
                    2.3.2.1 Increased military spending in emerging economies
                               FIGURE 7 MILITARY EXPENDITURE, BY COUNTRY, 2019–2021 (USD BILLION)
                    2.3.2.2 Rising incidences of regional disputes
           2.3.3 SUPPLY-SIDE INDICATORS
                    2.3.3.1 Financial trends of major US defense contractors
           2.3.4 RECESSION IMPACT ANALYSIS
    2.4 DATA TRIANGULATION 
           FIGURE 8 MARKET BREAKDOWN AND DATA TRIANGULATION
           2.4.1 TRIANGULATION THROUGH PRIMARY AND SECONDARY RESEARCH
    2.5 GROWTH RATE ASSUMPTIONS 
    2.6 RESEARCH ASSUMPTIONS 
    2.7 RISKS 
 
3 EXECUTIVE SUMMARY (Page No. - 40)
    FIGURE 9 LAND SEGMENT TO REGISTER HIGHEST CAGR FROM 2023 TO 2028
    FIGURE 10 HANDHELD SYSTEMS TO BE FASTEST-GROWING SEGMENT BY 2028
    FIGURE 11 SENSORS TO EXCEED OTHER COMPONENTS DURING FORECAST PERIOD
    FIGURE 12 COOLED SEGMENT TO ACQUIRE LARGEST MARKET SHARE BY 2028
    FIGURE 13 MULTISPECTRAL SEGMENT TO HOLD MORE MARKET SHARE BY 2028
    FIGURE 14 OEM TO COMMAND LEADING MARKET POSITION IN 2023
    FIGURE 15 ASIA PACIFIC TO REGISTER HIGHEST CAGR DURING FORECAST PERIOD
 
4 PREMIUM INSIGHTS (Page No. - 45)
    4.1 ATTRACTIVE GROWTH OPPORTUNITIES FOR PLAYERS IN MILITARY EOIR MARKET 
           FIGURE 16 INCREASED ADOPTION OF UNMANNED SYSTEMS
    4.2 MILITARY EO/IR SYSTEMS MARKET, BY PLATFORM 
           FIGURE 17 AIRBORNE TO SURPASS OTHER SEGMENTS BY 2028
    4.3 MILITARY EO/IR SYSTEMS MARKET, BY PRODUCT TYPE 
           FIGURE 18 EO/IR PAYLOADS TO COMMAND MAJORITY SHARES DURING FORECAST PERIOD
    4.4 MILITARY EO/IR SYSTEMS MARKET, BY COMPONENT 
           FIGURE 19 SENSORS TO SECURE LEADING MARKET POSITION BY 2028
    4.5 MILITARY EOIR MARKET, BY SENSOR TECHNOLOGY 
           FIGURE 20 SCANNING SEGMENT TO HOLD LARGER SHARE DURING FORECAST PERIOD
    4.6 MILITARY EO/IR SYSTEMS MARKET, BY COUNTRY 
           FIGURE 21 INDIA TO BE FASTEST-GROWING COUNTRY FROM 2023 TO 2028
 
5 MARKET OVERVIEW (Page No. - 48)
    5.1 INTRODUCTION 
    5.2 MARKET DYNAMICS 
           FIGURE 22 MILITARY EO/IR SYSTEMS MARKET DYNAMICS
           5.2.1 DRIVERS
                    5.2.1.1 Advancements and enhancements in technology utilized for EO/IR
                    5.2.1.2 Significant investments in EO/IR systems by governments
                    5.2.1.3 Growing need for intelligence, surveillance, and reconnaissance (ISR) capabilities
                    5.2.1.4 Rise in military expenditure on advanced equipment
                               TABLE 4 DEFENSE EXPENDITURE OF MAJOR COUNTRIES, 2020 VS. 2021 (USD BILLION)
                               FIGURE 23 DEFENSE EXPENDITURE OF MAJOR COUNTRIES (%), 2020 VS. 2021
                    5.2.1.5 Advancements in EO/IR sensor technology
                    5.2.1.6 Deployment of EO/IR systems on unmanned platforms
           5.2.2 RESTRAINTS
                    5.2.2.1 Stagnant product life cycle
                    5.2.2.2 High development, production, and maintenance costs
           5.2.3 OPPORTUNITIES
                    5.2.3.1 Integration of EO/IR systems with conventional military systems
                    5.2.3.2 Surging adoption of unmanned systems across platforms
           5.2.4 CHALLENGES
                    5.2.4.1 Complexity involved in integrating EO/IR systems with different platforms
                    5.2.4.2 Impact of environmental factors on EO/IR systems
                    5.2.4.3 Developing efficient and cost-effective target and tracking systems
    5.3 TRENDS IMPACTING CUSTOMERS’ BUSINESSES 
           5.3.1 REVENUE SHIFT AND NEW REVENUE POCKETS FOR MILITARY EO/IR SYSTEM MANUFACTURERS
                    FIGURE 24 REVENUE SHIFT IN MILITARY EO/IR SYSTEMS MARKET
    5.4 RECESSION IMPACT ANALYSIS 
           5.4.1 IMPACT OF RECESSION ON MILITARY EO/IR SYSTEMS MARKET
                    FIGURE 25 RECESSION IMPACT ANALYSIS ON MILITARY EO/IR SYSTEMS MARKET
                    FIGURE 26 FACTORS IMPACTING MILITARY EO/IR SYSTEMS MARKET
    5.5 AVERAGE SELLING PRICE ANALYSIS 
           5.5.1 AVERAGE SELLING PRICE TREND
                    TABLE 5 AVERAGE SELLING PRICE OF MILITARY EO/IR SYSTEMS (USD)
                    TABLE 6 AVERAGE SELLING PRICE OF MAIN BATTLE TANKS (USD MILLION)
                    TABLE 7 AVERAGE SELLING PRICE OF INFANTRY FIGHTING VEHICLES (USD MILLION)
                    TABLE 8 AVERAGE SELLING PRICE OF ARMORED PERSONNEL CARRIERS (USD MILLION)
                    TABLE 9 AVERAGE SELLING PRICE OF MINE-RESISTANT AMBUSH-PROTECTED VEHICLES (USD MILLION)
                    TABLE 10 AVERAGE SELLING PRICE OF LIGHT-PROTECTED VEHICLES (USD MILLION)
    5.6 MILITARY EO/IR SYSTEMS VOLUME, BY REGION 
           TABLE 11 MILITARY EO/IR SYSTEMS VOLUME, BY REGION
    5.7 MARKET ECOSYSTEM 
           5.7.1 PROMINENT COMPANIES
           5.7.2 PRIVATE AND SMALL ENTERPRISES
           5.7.3 END USERS
           FIGURE 27 MILITARY EO/IR SYSTEMS MARKET ECOSYSTEM
           TABLE 12 MILITARY EO/IR SYSTEMS MARKET ECOSYSTEM
    5.8 VALUE CHAIN ANALYSIS 
           FIGURE 28 VALUE CHAIN ANALYSIS
    5.9 USE CASE ANALYSIS 
           5.9.1 USE CASE 1: APPLICATION OF EO/IR SYSTEMS IN MARITIME SECURITY AND SURVEILLANCE
                    TABLE 13 APPLICATION OF EO/IR SYSTEMS IN MARITIME SECURITY AND SURVEILLANCE
           5.9.2 USE CASE 2: EO/IR SYSTEMS FOR ISR CAPABILITIES IN UAVS
                    TABLE 14 EO/IR SYSTEMS FOR ISR CAPABILITIES IN UAVS
    5.10 TRADE ANALYSIS 
           5.10.1 IMPORT DATA FOR LAND VEHICLES, BY REGION, 2017−2020
           TABLE 15 ARMORED VEHICLES: REGION-WISE IMPORT DATA, 2017−2020 (USD)
           TABLE 16 TANKS AND OTHER ARMORED FIGHTING VEHICLES, MOTORIZED, WHETHER OR NOT FITTED WITH WEAPONS: COUNTRY-WISE EXPORTS, 2020−2021 (USD THOUSAND)
           TABLE 17 TANKS AND OTHER ARMORED FIGHTING VEHICLES, MOTORIZED, WHETHER OR NOT FITTED WITH WEAPONS: COUNTRY-WISE IMPORTS, 2020−2021 (USD THOUSAND)
    5.11 PORTER’S FIVE FORCES ANALYSIS 
           TABLE 18 PORTER’S FIVE FORCES ANALYSIS
           FIGURE 29 PORTER’S FIVE FORCES ANALYSIS
           5.11.1 THREAT OF NEW ENTRANTS
           5.11.2 THREAT OF SUBSTITUTES
           5.11.3 BARGAINING POWER OF SUPPLIERS
           5.11.4 BARGAINING POWER OF BUYERS
           5.11.5 INTENSITY OF COMPETITIVE RIVALRY
    5.12 KEY STAKEHOLDERS AND BUYING CRITERIA 
           5.12.1 KEY STAKEHOLDERS IN BUYING PROCESS
           FIGURE 30 INFLUENCE OF STAKEHOLDERS ON BUYING PROCESS, BY PLATFORM
           TABLE 19 INFLUENCE OF STAKEHOLDERS ON BUYING PROCESS, BY PLATFORM (%)
           5.12.2 BUYING CRITERIA
           FIGURE 31 KEY BUYING CRITERIA, BY PLATFORM
           TABLE 20 KEY BUYING CRITERIA, BY PLATFORM
    5.13 TARIFF AND REGULATORY LANDSCAPE 
           TABLE 21 NORTH AMERICA: REGULATORY BODIES, GOVERNMENT AGENCIES, AND OTHER AGENCIES
           TABLE 22 EUROPE: REGULATORY BODIES, GOVERNMENT AGENCIES, AND OTHER AGENCIES
           TABLE 23 ASIA PACIFIC: REGULATORY BODIES, GOVERNMENT AGENCIES, AND OTHER AGENCIES
           TABLE 24 MIDDLE EAST: REGULATORY BODIES, GOVERNMENT AGENCIES, AND OTHER AGENCIES
           TABLE 25 ROW: REGULATORY BODIES, GOVERNMENT AGENCIES, AND OTHER AGENCIES
    5.14 KEY CONFERENCES AND EVENTS, 2022–2023 
           TABLE 26 KEY CONFERENCES AND EVENTS, 2022−2023
 
6 INDUSTRY TRENDS (Page No. - 73)
    6.1 INTRODUCTION 
           FIGURE 32 INTRODUCTION OF TECHNOLOGY IN MILITARY APPLICATIONS, 1960–2020
    6.2 KEY TECHNOLOGY TRENDS 
           FIGURE 33 TECHNOLOGICAL TRENDS IN MILITARY EO/IR SYSTEMS MARKET
           6.2.1 ARTIFICIAL INTELLIGENCE AND MACHINE LEARNING
           6.2.2 HYPERSPECTRAL IMAGING
           6.2.3 SWIR (SHORT-WAVE INFRARED) IMAGING
           6.2.4 3D PRINTING
           6.2.5 AUGMENTED REALITY (AR) AND VIRTUAL REALITY (VR)
           6.2.6 MICRO-ELECTRO-MECHANICAL SYSTEMS (MEMS)
           6.2.7 HETEROGENEOUS INTEGRATION
           6.2.8 QUANTUM CASCADE LASERS (QCLS)
    6.3 IMPACT OF MEGATRENDS 
           6.3.1 INTRODUCTION OF INTERNET OF THINGS
           6.3.2 INTEGRATED BATTLEFIELDS WITH COLLABORATIVE COMBAT
           6.3.3 SHIFT IN GLOBAL ECONOMIC POWER
    6.4 SUPPLY CHAIN ANALYSIS 
           FIGURE 34 SUPPLY CHAIN ANALYSIS
 
7 MILITARY EO/IR SYSTEMS MARKET, BY COOLING TECHNOLOGY (Page No. - 81)
    7.1 INTRODUCTION 
           FIGURE 35 MILITARY EO/R MARKET, BY COOLING TECHNOLOGY, 2023–2028
           TABLE 27 MILITARY EO/IR SYSTEMS MARKET, BY COOLING TECHNOLOGY, 2019–2022 (USD MILLION)
           TABLE 28 MILITARY EO/IR SYSTEMS MARKET, BY COOLING TECHNOLOGY, 2023–2028 (USD MILLION)
    7.2 COOLED 
           7.2.1 LARGE-SCALE DEPLOYMENT IN SECURITY & SURVEILLANCE APPLICATIONS
    7.3 UNCOOLED 
           7.3.1 INCREASED USE ACROSS MILITARY PLATFORMS
 
8 MILITARY EO/IR SYSTEMS MARKET, BY SENSOR TECHNOLOGY (Page No. - 84)
    8.1 INTRODUCTION 
           FIGURE 36 MILITARY EO/IR SYSTEMS MARKET, BY SENSOR TECHNOLOGY, 2023–2028
           TABLE 29 MILITARY EO/IR SYSTEMS MARKET, BY SENSOR TECHNOLOGY, 2019–2022 (USD MILLION)
           TABLE 30 MILITARY EO/R MARKET, BY SENSOR TECHNOLOGY, 2023–2028 (USD MILLION)
    8.2 STARING 
           8.2.1 USED IN SURVEILLANCE AND TARGET ACQUISITION APPLICATIONS
    8.3 SCANNING 
           8.3.1 AUTONOMOUS AND ACCURATE TRACKING FEATURES
 
9 MILITARY EO/IR SYSTEMS MARKET, BY IMAGING TECHNOLOGY (Page No. - 87)
    9.1 INTRODUCTION 
           FIGURE 37 MILITARY EO/IR SYSTEMS MARKET, BY IMAGING TECHNOLOGY, 2023–2028
           TABLE 31 MILITARY EO/R MARKET, BY IMAGING TECHNOLOGY, 2019–2022 (USD MILLION)
           TABLE 32 MILITARY EO/IR SYSTEMS MARKET, BY IMAGING TECHNOLOGY, 2023–2028 (USD MILLION)
    9.2 MULTISPECTRAL 
           9.2.1 OPTIMIZING TACTICAL OPERATION THROUGH MULTISPECTRAL IMAGING CAPABILITIES
    9.3 HYPERSPECTRAL 
           9.3.1 DETECTING AND IDENTIFYING TARGETS WITH HYPERSPECTRAL IMAGING SYSTEMS
 
10 MILITARY EO/IR SYSTEMS MARKET, BY COMPONENT (Page No. - 90)
     10.1 INTRODUCTION 
             FIGURE 38 MILITARY EO/IR SYSTEMS MARKET, BY COMPONENT, 2023–2028
             TABLE 33 MILITARY EO/IR SYSTEMS MARKET, BY COMPONENT, 2019–2022 (USD MILLION)
             TABLE 34 MILITARY EO/R MARKET, BY COMPONENT, 2023–2028 (USD MILLION)
     10.2 HUMAN-MACHINE INTERFACES 
             10.2.1 ADVANCES IN TECHNOLOGY
     10.3 STABILIZATION UNITS 
             10.3.1 DEVELOPMENT OF MODERNIZED STABILIZATION UNITS
     10.4 CONTROL SYSTEMS 
             10.4.1 DEMAND FOR ADVANCED TURRET CONTROL UNITS
     10.5 SENSORS 
             10.5.1 INCREASING PROCUREMENT OF SENSORS
     10.6 OPTICS 
             10.6.1 WIDE APPLICABILITY OF OPTICS AND LENSES IN EO/IR SYSTEMS
     10.7 PROCESSORS 
             10.7.1 GROWING PREFERENCE FOR ADVANCED PROCESSING SYSTEMS
 
11 MILITARY EO/IR SYSTEMS MARKET, BY PRODUCT TYPE (Page No. - 95)
     11.1 INTRODUCTION 
             FIGURE 39 MILITARY EO/IR SYSTEMS MARKET, BY PRODUCT TYPE, 2023–2028
             TABLE 35 MILITARY EO/IR SYSTEMS MARKET, BY PRODUCT TYPE, 2019–2022 (USD MILLION)
             TABLE 36 MILITARY EO/R MARKET, BY PRODUCT TYPE, 2023–2028 (USD MILLION)
     11.2 HANDHELD SYSTEMS 
             11.2.1 INTEGRATED EO/IR CAPABILITIES WITH SOLDIER SYSTEMS FOR INCREASED MISSION EFFECTIVENESS
             11.2.2 DESIGNATORS
             11.2.3 RANGEFINDERS
             11.2.4 HANDHELD THERMAL IMAGERS
             11.2.5 WEAPON SCOPES & SIGHTS
     11.3 EO/IR PAYLOADS 
             11.3.1 HIGH DEMAND FOR SMALL, LIGHTWEIGHT, AND COMBAT-PROVEN PRODUCTS
             11.3.2 VEHICLE EO/IR
             11.2.3 RANGEFINDERS
             11.3.4 MARITIME EO/IR
 
12 MILITARY EO/IR SYSTEMS MARKET, BY PLATFORM (Page No. - 99)
     12.1 INTRODUCTION 
             FIGURE 40 MILITARY ELECTRO OPTICAL AND INFRARED SYSYTEM MARKET, BY PLATFORM, 2023–2028
             TABLE 37 MILITARY EO/IR SYSTEMS MARKET, BY PLATFORM, 2019–2022 (USD MILLION)
             TABLE 38 MILITARY EO/R MARKET, BY PLATFORM, 2023–2028 (USD MILLION)
     12.2 LAND 
             12.2.1 VEHICLE-MOUNTED
                        12.2.1.1 Demand for combat vehicles for offensive cross-country and security operations
                        12.2.1.2 Combat vehicles
                        12.2.1.3 Unmanned ground vehicles (UGVs)
             12.2.2 DISMOUNTED SOLDIER SYSTEMS
                        12.2.2.1 High demand for handheld tactical radios from defense forces
     12.3 AIRBORNE 
             12.3.1 MILITARY AIRCRAFT
                        12.3.1.1 Increased modernization programs by militaries
                        12.3.1.2 Fighter aircraft
                        12.3.1.3 Transport aircraft
                        12.3.1.4 Special mission aircraft
             12.3.2 ATTACK HELICOPTERS
                        12.3.2.1 EO/IR systems provide situational awareness and targeting capabilities
             12.3.3 UNMANNED AERIAL VEHICLES (UAV)
                        12.3.3.1 UAVs equipped with advanced EO/IR systems for enhanced surveillance and intelligence gathering
     12.4 NAVAL 
             12.4.1 COMBAT SHIPS
                        12.4.1.1 Increased use of frigates, corvettes, and destroyers
             12.4.2 UNMANNED SURFACE VEHICLES (USV)
                        12.4.2.1 High procurement of USVs
 
13 MILITARY EO/IR SYSTEMS MARKET, BY POINT OF SALE (Page No. - 105)
     13.1 INTRODUCTION 
             FIGURE 41 MILITARY EO/IR SYSTEMS MARKET, BY POINT OF SALE, 2023–2028
             TABLE 39 MILITARY EO/IR SYSTEMS MARKET, BY POINT OF SALE, 2019–2022 (USD MILLION)
             TABLE 40 MILITARY EO/IR SYSTEMS MARKET, BY POINT OF SALE, 2023–2028 (USD MILLION)
     13.2 OEM 
             13.2.1 DEVELOPMENT OF NEXT-GENERATION, ADVANCED MILITARY EO/IR SYSTEMS
     13.3 AFTERMARKET 
             13.3.1 UPGRADES TO EXISTING FLEET OF MILITARY GROUND VEHICLES
 
14 MILITARY EO/IR SYSTEMS MARKET, BY REGION (Page No. - 108)
     14.1 INTRODUCTION 
             FIGURE 42 ASIA PACIFIC CLAIMED LARGEST SHARE OF MILITARY EO/IR SYSTEMS MARKET IN 2023
     14.2 REGIONAL RECESSION IMPACT ANALYSIS 
             TABLE 41 REGIONAL RECESSION IMPACT ANALYSIS
             TABLE 42 MILITARY EO/IR SYSTEMS MARKET, BY REGION, 2019–2022 (USD MILLION)
             TABLE 43 MILITARY EO/IR SYSTEMS MARKET, BY REGION, 2023–2028 (USD MILLION)
     14.3 NORTH AMERICA 
             14.3.1 PESTLE ANALYSIS: NORTH AMERICA
             14.3.2 RECESSION IMPACT ANALYSIS: NORTH AMERICA
                        FIGURE 43 NORTH AMERICA: MILITARY EO/IR SYSTEMS MARKET SNAPSHOT
                        TABLE 44 NORTH AMERICA: MILITARY ELECTRO OPTICAL AND INFRARED SYSYTEM MARKET, BY PRODUCT TYPE, 2019–2022 (USD MILLION)
                        TABLE 45 NORTH AMERICA: MILITARY EO/R MARKET, BY PRODUCT TYPE, 2023–2028 (USD MILLION)
                        TABLE 46 NORTH AMERICA: MILITARY EO/IR SYSTEMS MARKET, BY COMPONENT, 2019–2022 (USD MILLION)
                        TABLE 47 NORTH AMERICA: MILITARY EO/IR SYSTEMS MARKET, BY COMPONENT, 2023–2028 (USD MILLION)
                        TABLE 48 NORTH AMERICA: MILITARY EO/R MARKET, BY PLATFORM, 2019–2022 (USD MILLION)
                        TABLE 49 NORTH AMERICA: MILITARY EO/IR SYSTEMS MARKET, BY PLATFORM, 2023–2028 (USD MILLION)
                        TABLE 50 NORTH AMERICA: MILITARY EO/IR SYSTEMS MARKET, BY POINT OF SALE, 2019–2022 (USD MILLION)
                        TABLE 51 NORTH AMERICA: MILITARY EO/R MARKET, BY POINT OF SALE, 2023–2028 (USD MILLION)
                        TABLE 52 NORTH AMERICA: MILITARY EO/IR SYSTEMS MARKET, BY COUNTRY, 2019–2022 (USD MILLION)
                        TABLE 53 NORTH AMERICA: MILITARY EO/R MARKET, BY COUNTRY, 2023–2028 (USD MILLION)
             14.3.3 US
                        14.3.3.1 Modernization programs and defense policies
                                     FIGURE 44 US: MILITARY SPENDING (USD BILLION) VS. GDP (%), 2016−2021
                                     TABLE 54 US: MILITARY EO/IR SYSTEMS MARKET, BY PRODUCT TYPE, 2019–2022 (USD MILLION)
                                     TABLE 55 US: MILITARY EO/IR SYSTEMS MARKET, BY PRODUCT TYPE, 2023–2028 (USD MILLION)
                                     TABLE 56 US: MILITARY EO/IR SYSTEMS MARKET, BY COMPONENT, 2019–2022 (USD MILLION)
                                     TABLE 57 US: MILITARY EO/IR SYSTEMS MARKET, BY COMPONENT, 2023–2028 (USD MILLION)
                                     TABLE 58 US: MILITARY EO/IR SYSTEMS MARKET, BY PLATFORM, 2019–2022 (USD MILLION)
                                     TABLE 59 US: MILITARY EO/IR SYSTEMS MARKET, BY PLATFORM, 2023–2028 (USD MILLION)
             14.3.4 CANADA
                        14.3.4.1 Increased R&D investments
                                     FIGURE 45 CANADA: MILITARY SPENDING (USD BILLION) VS. GDP (%), 2016−2021
                                     TABLE 60 CANADA: MILITARY EO/R MARKET, BY PRODUCT TYPE, 2019–2022 (USD MILLION)
                                     TABLE 61 CANADA: MILITARY EO/IR SYSTEMS MARKET, BY PRODUCT TYPE, 2023–2028 (USD MILLION)
                                     TABLE 62 CANADA: MILITARY EO/IR SYSTEMS MARKET, BY COMPONENT, 2019–2022 (USD MILLION)
                                     TABLE 63 CANADA: MILITARY EO/IR SYSTEMS MARKET, BY COMPONENT, 2023–2028 (USD MILLION)
                                     TABLE 64 CANADA: MILITARY EO/IR SYSTEMS MARKET, BY PLATFORM, 2019–2022 (USD MILLION)
                                     TABLE 65 CANADA: MILITARY EO/R MARKET, BY PLATFORM, 2023–2028 (USD MILLION)
     14.4 EUROPE 
             14.4.1 PESTLE ANALYSIS: EUROPE
             14.4.2 RECESSION IMPACT ANALYSIS: EUROPE
                        FIGURE 46 EUROPE: MILITARY EO/IR SYSTEMS MARKET SNAPSHOT
                        TABLE 66 EUROPE: MILITARY EO/IR SYSTEMS MARKET, BY PRODUCT TYPE, 2019–2022 (USD MILLION)
                        TABLE 67 EUROPE: MILITARY EO/IR SYSTEMS MARKET, BY PRODUCT TYPE, 2023–2028 (USD MILLION)
                        TABLE 68 EUROPE: MILITARY ELECTRO OPTICAL AND INFRARED SYSYTEM MARKET, BY COMPONENT, 2019–2022 (USD MILLION)
                        TABLE 69 EUROPE: MILITARY EO/IR SYSTEMS MARKET, BY COMPONENT, 2023–2028 (USD MILLION)
                        TABLE 70 EUROPE: MILITARY EO/IR SYSTEMS MARKET, BY PLATFORM, 2019–2022 (USD MILLION)
                        TABLE 71 EUROPE: MILITARY EO/IR SYSTEMS MARKET, BY PLATFORM, 2023–2028 (USD MILLION)
                        TABLE 72 EUROPE: MILITARY EO/IR SYSTEMS MARKET, BY POINT OF SALE, 2019–2022 (USD MILLION)
                        TABLE 73 EUROPE: MILITARY EO/IR SYSTEMS MARKET, BY POINT OF SALE, 2023–2028 (USD MILLION)
                        TABLE 74 EUROPE: MILITARY EO/IR SYSTEMS MARKET, BY COUNTRY, 2019–2022 (USD MILLION)
                        TABLE 75 EUROPE: MILITARY EO/IR SYSTEMS MARKET, BY COUNTRY, 2023–2028 (USD MILLION)
             14.4.3 UK
                        14.4.3.1 Rapid market expansion through advanced upgrade programs
                                     FIGURE 47 UK: MILITARY SPENDING (USD BILLION) VS. GDP (%), 2016−2020
                                     TABLE 76 UK: MILITARY EO/IR SYSTEMS MARKET, BY PRODUCT TYPE, 2019–2022 (USD MILLION)
                                     TABLE 77 UK: MILITARY EO/IR SYSTEMS MARKET, BY PRODUCT TYPE, 2023–2028 (USD MILLION)
                                     TABLE 78 UK: MILITARY EO/R MARKET, BY COMPONENT, 2019–2022 (USD MILLION)
                                     TABLE 79 UK: MILITARY EO/IR SYSTEMS MARKET, BY COMPONENT, 2023–2028 (USD MILLION)
                                     TABLE 80 UK: MILITARY EO/IR SYSTEMS MARKET, BY PLATFORM, 2019–2022 (USD MILLION)
                                     TABLE 81 UK: MILITARY EO/IR SYSTEMS MARKET, BY PLATFORM, 2023–2028 (USD MILLION)
             14.4.4 FRANCE
                        14.4.4.1 Procurement of new-generation combat vehicles for defense forces
                                     FIGURE 48 FRANCE: MILITARY SPENDING (USD BILLION) VS. GDP (%), 2016−2020
                                     TABLE 82 FRANCE: MILITARY EO/IR SYSTEMS MARKET, BY PRODUCT TYPE, 2019–2022 (USD MILLION)
                                     TABLE 83 FRANCE: MILITARY EO/IR SYSTEMS MARKET, BY PRODUCT TYPE, 2023–2028 (USD MILLION)
                                     TABLE 84 FRANCE: MILITARY EO/IR SYSTEMS MARKET, BY COMPONENT, 2019–2022 (USD MILLION)
                                     TABLE 85 FRANCE: MILITARY EO/R MARKET, BY COMPONENT, 2023–2028 (USD MILLION)
                                     TABLE 86 FRANCE: MILITARY EO/IR SYSTEMS MARKET, BY PLATFORM, 2019–2022 (USD MILLION)
                                     TABLE 87 FRANCE: MILITARY EO/IR SYSTEMS MARKET, BY PLATFORM, 2023–2028 (USD MILLION)
             14.4.5 GERMANY
                        14.4.5.1 Major global exporter of armored vehicles
                                     FIGURE 49 GERMANY: MILITARY SPENDING (USD BILLION) VS. GDP (%), 2016−2020
                                     TABLE 88 GERMANY: MILITARY EO/IR SYSTEMS MARKET, BY PRODUCT TYPE, 2019–2022 (USD MILLION)
                                     TABLE 89 GERMANY: MILITARY EO/IR SYSTEMS MARKET, BY PRODUCT TYPE, 2023–2028 (USD MILLION)
                                     TABLE 90 GERMANY: MILITARY EO/IR SYSTEMS MARKET, BY COMPONENT, 2019–2022 (USD MILLION)
                                     TABLE 91 GERMANY: MILITARY EO/IR SYSTEMS MARKET, BY COMPONENT, 2023–2028 (USD MILLION)
                                     TABLE 92 GERMANY: MILITARY EO/IR SYSTEMS MARKET, BY PLATFORM, 2019–2022 (USD MILLION)
                                     TABLE 93 GERMANY: MILITARY EO/IR SYSTEMS MARKET, BY PLATFORM, 2023–2028 (USD MILLION)
             14.4.6 RUSSIA
                        14.4.6.1 Advanced naval fleet provides opportunities for naval EO/IR payloads
                                     TABLE 94 RUSSIA: MILITARY EO/IR SYSTEMS MARKET, BY PRODUCT TYPE, 2019–2022 (USD MILLION)
                                     TABLE 95 RUSSIA: MILITARY EO/IR SYSTEMS MARKET, BY PRODUCT TYPE, 2023–2028 (USD MILLION)
                                     TABLE 96 RUSSIA: MILITARY EO/IR SYSTEMS MARKET, BY COMPONENT, 2019–2022 (USD MILLION)
                                     TABLE 97 RUSSIA: MILITARY EO/IR SYSTEMS MARKET, BY COMPONENT, 2023–2028 (USD MILLION)
                                     TABLE 98 RUSSIA: MILITARY EO/IR SYSTEMS MARKET, BY PLATFORM, 2019–2022 (USD MILLION)
                                     TABLE 99 RUSSIA: MILITARY EO/IR SYSTEMS MARKET, BY PLATFORM, 2023–2028 (USD MILLION)
             14.4.7 ITALY
                        14.4.7.1 Robust presence of major defense players
                                     FIGURE 50 ITALY: MILITARY SPENDING (USD BILLION) VS. GDP (%), 2016–2020
                                     TABLE 100 ITALY: MILITARY EO/IR SYSTEMS MARKET, BY PRODUCT TYPE, 2019–2022 (USD MILLION)
                                     TABLE 101 ITALY: MILITARY EO/IR SYSTEMS MARKET, BY PRODUCT TYPE, 2023–2028 (USD MILLION)
                                     TABLE 102 ITALY: MILITARY EO/IR SYSTEMS MARKET, BY COMPONENT, 2019–2022 (USD MILLION)
                                     TABLE 103 ITALY: MILITARY EO/R MARKET, BY COMPONENT, 2023–2028 (USD MILLION)
                                     TABLE 104 ITALY: MILITARY EO/IR SYSTEMS MARKET, BY PLATFORM, 2019–2022 (USD MILLION)
                                     TABLE 105 ITALY: MILITARY EO/IR SYSTEMS MARKET, BY PLATFORM, 2023–2028 (USD MILLION)
             14.4.8 REST OF EUROPE
                        14.4.8.1 Significant improvement and strengthening of military power
                                     TABLE 106 REST OF EUROPE: MILITARY EO/IR SYSTEMS MARKET, BY PRODUCT TYPE, 2019–2022 (USD MILLION)
                                     TABLE 107 REST OF EUROPE: MILITARY ELECTRO OPTICAL AND INFRARED SYSYTEM MARKET, BY PRODUCT TYPE, 2023–2028 (USD MILLION)
                                     TABLE 108 REST OF EUROPE: MILITARY EO/IR SYSTEMS MARKET, BY COMPONENT, 2019–2022 (USD MILLION)
                                     TABLE 109 REST OF EUROPE: MILITARY EO/IR SYSTEMS MARKET, BY COMPONENT, 2023–2028 (USD MILLION)
                                     TABLE 110 REST OF EUROPE: MILITARY EO/R MARKET, BY PLATFORM, 2019–2022 (USD MILLION)
                                     TABLE 111 REST OF EUROPE: MILITARY EO/IR SYSTEMS MARKET, BY PLATFORM, 2023–2028 (USD MILLION)
     14.5 ASIA PACIFIC 
             14.5.1 PESTLE ANALYSIS: ASIA PACIFIC
             14.5.2 RECESSION IMPACT ANALYSIS: ASIA PACIFIC
                        FIGURE 51 ASIA PACIFIC: MILITARY EO/IR SYSTEMS MARKET SNAPSHOT
                        TABLE 112 ASIA PACIFIC: MILITARY EO/IR SYSTEMS MARKET, BY PRODUCT TYPE, 2019–2022 (USD MILLION)
                        TABLE 113 ASIA PACIFIC: MILITARY ELECTRO OPTICAL AND INFRARED SYSYTEM MARKET, BY PRODUCT TYPE, 2023–2028 (USD MILLION)
                        TABLE 114 ASIA PACIFIC: MILITARY EO/IR SYSTEMS MARKET, BY COMPONENT, 2019–2022 (USD MILLION)
                        TABLE 115 ASIA PACIFIC: MILITARY EO/IR SYSTEMS MARKET, BY COMPONENT, 2023–2028 (USD MILLION)
                        TABLE 116 ASIA PACIFIC: MILITARY EO/R MARKET, BY PLATFORM, 2019–2022 (USD MILLION)
                        TABLE 117 ASIA PACIFIC: MILITARY EO/IR SYSTEMS MARKET, BY PLATFORM, 2023–2028 (USD MILLION)
                        TABLE 118 ASIA PACIFIC: MILITARY EO/IR SYSTEMS MARKET, BY POINT OF SALE, 2019–2022 (USD MILLION)
                        TABLE 119 ASIA PACIFIC: MILITARY ELECTRO OPTICAL AND INFRARED SYSYTEM MARKET, BY POINT OF SALE, 2023–2028 (USD MILLION)
                        TABLE 120 ASIA PACIFIC: MILITARY EO/IR SYSTEMS MARKET, BY COUNTRY, 2019–2022 (USD MILLION)
                        TABLE 121 ASIA PACIFIC: MILITARY EO/IR SYSTEMS MARKET, BY COUNTRY, 2023–2028 (USD MILLION)
             14.5.3 CHINA
                        14.5.3.1 Increased investments to strengthen military
                                     FIGURE 52 CHINA: MILITARY SPENDING (USD BILLION) VS. GDP (%), 2016−2021
                                     TABLE 122 CHINA: MILITARY EO/IR SYSTEMS MARKET, BY PRODUCT TYPE, 2019–2022 (USD MILLION)
                                     TABLE 123 CHINA: MILITARY EO/IR SYSTEMS MARKET, BY PRODUCT TYPE, 2023–2028 (USD MILLION)
                                     TABLE 124 CHINA: MILITARY ELECTRO OPTICAL AND INFRARED SYSYTEM MARKET, BY COMPONENT, 2019–2022 (USD MILLION)
                                     TABLE 125 CHINA: MILITARY EO/IR SYSTEMS MARKET, BY COMPONENT, 2023–2028 (USD MILLION)
                                     TABLE 126 CHINA: MILITARY ELECTRO OPTICAL AND INFRARED SYSYTEM MARKET, BY PLATFORM, 2019–2022 (USD MILLION)
                                     TABLE 127 CHINA: MILITARY EO/IR SYSTEMS MARKET, BY PLATFORM, 2023–2028 (USD MILLION)
             14.5.4 INDIA
                        14.5.4.1 Growing procurement of combat vehicles
                                     FIGURE 53 INDIA: MILITARY SPENDING (USD BILLION) VS. GDP (%), 2016−2021
                                     TABLE 128 INDIA: MILITARY EO/R MARKET, BY PRODUCT TYPE, 2019–2022 (USD MILLION)
                                     TABLE 129 INDIA: MILITARY EO/IR SYSTEMS MARKET, BY PRODUCT TYPE, 2023–2028 (USD MILLION)
                                     TABLE 130 INDIA: MILITARY ELECTRO OPTICAL AND INFRARED SYSYTEM MARKET, BY COMPONENT, 2019–2022 (USD MILLION)
                                     TABLE 131 INDIA: MILITARY EO/IR SYSTEMS MARKET, BY COMPONENT, 2023–2028 (USD MILLION)
                                     TABLE 132 INDIA: MILITARY ELECTRO OPTICAL AND INFRARED SYSYTEM MARKET, BY PLATFORM, 2019–2022 (USD MILLION)
                                     TABLE 133 INDIA: MILITARY EO/IR SYSTEMS MARKET, BY PLATFORM, 2023–2028 (USD MILLION)
             14.5.5 AUSTRALIA
                        14.5.5.1 Manufacturing and modernization of RWS and combat fleet with advanced military EO/IR systems
                                     FIGURE 54 AUSTRALIA: MILITARY SPENDING (USD BILLION) VS. GDP (%), 2016−2020
                                     TABLE 134 AUSTRALIA: MILITARY EO/IR SYSTEMS MARKET, BY PRODUCT TYPE, 2019–2022 (USD MILLION)
                                     TABLE 135 AUSTRALIA: MILITARY EO/IR SYSTEMS MARKET, BY PRODUCT TYPE, 2023–2028 (USD MILLION)
                                     TABLE 136 AUSTRALIA: MILITARY ELECTRO OPTICAL AND INFRARED SYSYTEM MARKET, BY COMPONENT, 2019–2022 (USD MILLION)
                                     TABLE 137 AUSTRALIA: MILITARY EO/IR SYSTEMS MARKET, BY COMPONENT, 2023–2028 (USD MILLION)
                                     TABLE 138 AUSTRALIA: MILITARY ELECTRO OPTICAL AND INFRARED SYSYTEM MARKET, BY PLATFORM, 2019–2022 (USD MILLION)
                                     TABLE 139 AUSTRALIA: MILITARY EO/IR SYSTEMS MARKET, BY PLATFORM, 2023–2028 (USD MILLION)
             14.5.6 JAPAN
                        14.5.6.1 High-end indigenous military technologies
                                     FIGURE 55 JAPAN: MILITARY SPENDING (USD BILLION) VS. GDP (%), 2016−2020
                                     TABLE 140 JAPAN: MILITARY EO/R MARKET, BY PRODUCT TYPE, 2019–2022 (USD MILLION)
                                     TABLE 141 JAPAN: MILITARY EO/IR SYSTEMS MARKET, BY PRODUCT TYPE, 2023–2028 (USD MILLION)
                                     TABLE 142 JAPAN: MILITARY EO/IR SYSTEMS MARKET, BY COMPONENT, 2019–2022 (USD MILLION)
                                     TABLE 143 JAPAN: MILITARY EO/IR SYSTEMS MARKET, BY COMPONENT, 2023–2028 (USD MILLION)
                                     TABLE 144 JAPAN: MILITARY EO/IR SYSTEMS MARKET, BY PLATFORM, 2019–2022 (USD MILLION)
                                     TABLE 145 JAPAN: MILITARY EO/IR SYSTEMS MARKET, BY PLATFORM, 2023–2028 (USD MILLION)
             14.5.7 SOUTH KOREA
                        14.5.7.1 Increasing use of robotics technologies
                                     FIGURE 56 SOUTH KOREA: MILITARY SPENDING (USD BILLION) VS. GDP (%), 2016−2020
                                     TABLE 146 SOUTH KOREA: MILITARY EO/IR SYSTEMS MARKET, BY PRODUCT TYPE, 2019–2022 (USD MILLION)
                                     TABLE 147 SOUTH KOREA: MILITARY EO/R MARKET, BY PRODUCT TYPE, 2023–2028 (USD MILLION)
                                     TABLE 148 SOUTH KOREA: MILITARY ELECTRO OPTICAL AND INFRARED SYSYTEM MARKET, BY COMPONENT, 2019–2022 (USD MILLION)
                                     TABLE 149 SOUTH KOREA: MILITARY EO/IR SYSTEMS MARKET, BY COMPONENT, 2023–2028 (USD MILLION)
                                     TABLE 150 SOUTH KOREA: MILITARY ELECTRO OPTICAL AND INFRARED SYSYTEM MARKET, BY PLATFORM, 2019–2022 (USD MILLION)
                                     TABLE 151 SOUTH KOREA: MILITARY EO/IR SYSTEMS MARKET, BY PLATFORM, 2023–2028 (USD MILLION)
             14.5.8 REST OF ASIA PACIFIC
                        14.5.8.1 Procurement of handheld systems for soldiers
                                     TABLE 152 REST OF ASIA PACIFIC: MILITARY ELECTRO OPTICAL AND INFRARED SYSYTEM MARKET, BY PRODUCT TYPE, 2019–2022 (USD MILLION)
                                     TABLE 153 REST OF ASIA PACIFIC: MILITARY EO/IR SYSTEMS MARKET, BY PRODUCT TYPE, 2023–2028 (USD MILLION)
                                     TABLE 154 REST OF ASIA PACIFIC: MILITARY EO/R MARKET, BY COMPONENT, 2019–2022 (USD MILLION)
                                     TABLE 155 REST OF ASIA PACIFIC: MILITARY ELECTRO OPTICAL AND INFRARED SYSYTEM MARKET, BY COMPONENT, 2023–2028 (USD MILLION)
                                     TABLE 156 REST OF ASIA PACIFIC: MILITARY EO/IR SYSTEMS MARKET, BY PLATFORM, 2019–2022 (USD MILLION)
                                     TABLE 157 REST OF THE WORLD: MILITARY EO/IR SYSTEMS MARKET, BY PLATFORM, 2023–2028 (USD MILLION)
     14.6 ROW 
             14.6.1 RECESSION IMPACT ANALYSIS: ROW
                        TABLE 158 ROW: MILITARY ELECTRO OPTICAL AND INFRARED SYSYTEM MARKET, BY PRODUCT TYPE, 2019–2022 (USD MILLION)
                        TABLE 159 ROW: MILITARY EO/IR SYSTEMS MARKET, BY PRODUCT TYPE, 2023–2028 (USD MILLION)
                        TABLE 160 ROW: MILITARY ELECTRO OPTICAL AND INFRARED SYSYTEM MARKET, BY COMPONENT, 2019–2022 (USD MILLION)
                        TABLE 161 ROW: MILITARY EO/R MARKET, BY COMPONENT, 2023–2028 (USD MILLION)
                        TABLE 162 ROW: MILITARY EO/IR SYSTEMS MARKET, BY PLATFORM, 2019–2022 (USD MILLION)
                        TABLE 163 ROW: MILITARY EO/IR SYSTEMS MARKET, BY PLATFORM, 2023–2028 (USD MILLION)
                        TABLE 164 ROW: MILITARY EO/IR SYSTEMS MARKET, BY POINT OF SALE, 2019–2022 (USD MILLION)
                        TABLE 165 ROW: MILITARY EO/IR SYSTEMS MARKET, BY POINT OF SALE, 2023–2028 (USD MILLION)
                        TABLE 166 ROW: MILITARY EO/IR SYSTEMS MARKET, BY REGION, 2019–2022 (USD MILLION)
                        TABLE 167 ROW: MILITARY EO/IR SYSTEMS MARKET, BY REGION, 2023–2028 (USD MILLION)
             14.6.2 MIDDLE EAST & AFRICA
                        14.6.2.1 Social unrest and market instability
                                     TABLE 168 MIDDLE EAST & AFRICA: MILITARY ELECTRO OPTICAL AND INFRARED SYSYTEM MARKET, BY PRODUCT TYPE, 2019–2022 (USD MILLION)
                                     TABLE 169 MIDDLE EAST & AFRICA: MILITARY EO/IR SYSTEMS MARKET, BY PRODUCT TYPE, 2023–2028 (USD MILLION)
                                     TABLE 170 MIDDLE EAST & AFRICA: MILITARY EO/R MARKET, BY COMPONENT, 2019–2022 (USD MILLION)
                                     TABLE 171 MIDDLE EAST & AFRICA: MILITARY EO/IR SYSTEMS MARKET, BY COMPONENT, 2023–2028 (USD MILLION)
                                     TABLE 172 MIDDLE EAST & AFRICA: MILITARY ELECTRO OPTICAL AND INFRARED SYSYTEM MARKET, BY PLATFORM, 2019–2022 (USD MILLION)
                                     TABLE 173 MIDDLE EAST & AFRICA: MILITARY EO/IR SYSTEMS MARKET, BY PLATFORM, 2023–2028 (USD MILLION)
             14.6.3 LATIN AMERICA
                        14.6.3.1 Increased demand for unmanned military ground vehicles
                                     TABLE 174 LATIN AMERICA: MILITARY EO/IR SYSTEMS MARKET, BY PRODUCT TYPE, 2019–2022 (USD MILLION)
                                     TABLE 175 LATIN AMERICA: MILITARY EO/IR SYSTEMS MARKET, BY PRODUCT TYPE, 2023–2028 (USD MILLION)
                                     TABLE 176 LATIN AMERICA: MILITARY EO/R MARKET, BY COMPONENT, 2019–2022 (USD MILLION)
                                     TABLE 177 LATIN AMERICA: MILITARY EO/IR SYSTEMS MARKET, BY COMPONENT, 2023–2028 (USD MILLION)
                                     TABLE 178 LATIN AMERICA: MILITARY EO/IR SYSTEMS MARKET, BY PLATFORM, 2019–2022 (USD MILLION)
                                     TABLE 179 LATIN AMERICA: MILITARY EO/IR SYSTEMS MARKET, BY PLATFORM, 2023–2028 (USD MILLION)
 
15 COMPETITIVE LANDSCAPE (Page No. - 166)
     15.1 INTRODUCTION 
             TABLE 180 KEY DEVELOPMENTS BY LEADING PLAYERS IN MILITARY EO/IR SYSTEMS MARKET, 2019–2022
     15.2 RANKING ANALYSIS, 2022 
             FIGURE 57 MARKET RANKING OF TOP FIVE PLAYERS, 2022
     15.3 MARKET SHARE ANALYSIS, 2022 
             FIGURE 58 MARKET SHARE OF TOP FIVE PLAYERS, 2022
             TABLE 181 MILITARY EO/IR SYSTEMS MARKET: DEGREE OF COMPETITION
     15.4 REVENUE ANALYSIS, 2022 
             FIGURE 59 REVENUE OF TOP FIVE PLAYERS, 2022
     15.5 COMPETITIVE BENCHMARKING 
             TABLE 182 COMPANY PRODUCT FOOTPRINT ANALYSIS
             TABLE 183 PLATFORM FOOTPRINT ANALYSIS
             TABLE 184 REGION FOOTPRINT ANALYSIS
     15.6 COMPANY EVALUATION MATRIX 
             15.6.1 STARS
             15.6.2 EMERGING LEADERS
             15.6.3 PERVASIVE PLAYERS
             15.6.4 PARTICIPANTS
                        FIGURE 60 MILITARY EO/IR SYSTEMS MARKET: COMPANY EVALUATION MATRIX, 2022
     15.7 STARTUP/SME EVALUATION MATRIX 
             15.7.1 PROGRESSIVE COMPANIES
             15.7.2 RESPONSIVE COMPANIES
             15.7.3 DYNAMIC COMPANIES
             15.7.4 STARTING BLOCKS
                        FIGURE 61 MILITARY EO/IR SYSTEMS MARKET: STARTUP/SME EVALUATION MATRIX, 2022
     15.8 COMPETITIVE SCENARIO 
             15.8.1 MARKET EVALUATION FRAMEWORK
             15.8.2 PRODUCT LAUNCHES/DEVELOPMENTS
                        TABLE 185 MILITARY EO/IR SYSTEMS MARKET: PRODUCT LAUNCHES/DEVELOPMENTS, SEPTEMBER 2019–NOVEMBER 2022
             15.8.3 DEALS
                        TABLE 186 MILITARY EO/IR SYSTEMS MARKET: DEALS, JANUARY 2019–FEBRUARY 2023
 
16 COMPANY PROFILES (Page No. - 187)
     16.1 INTRODUCTION 
(Business overview, Products/Solutions/Services offered, Recent developments & MnM View)*  
     16.2 KEY PLAYERS 
             16.2.1 NORTHROP GRUMMAN CORPORATION
                        TABLE 187 NORTHROP GRUMMAN CORPORATION: BUSINESS OVERVIEW
                        FIGURE 62 NORTHROP GRUMMAN CORPORATION: COMPANY SNAPSHOT
                        TABLE 188 NORTHROP GRUMMAN CORPORATION: PRODUCTS/SOLUTIONS/SERVICES OFFERED
                        TABLE 189 NORTHROP GRUMMAN CORPORATION: PRODUCT LAUNCHES
                        TABLE 190 NORTHROP GRUMMAN CORPORATION: DEALS
             16.2.2 RAYTHEON TECHNOLOGIES CORPORATION
                        TABLE 191 RAYTHEON TECHNOLOGIES CORPORATION: BUSINESS OVERVIEW
                        FIGURE 63 RAYTHEON TECHNOLOGIES CORPORATION: COMPANY SNAPSHOT
                        TABLE 192 RAYTHEON TECHNOLOGIES CORPORATION: PRODUCTS/SOLUTIONS/SERVICES OFFERED
                        TABLE 193 RAYTHEON TECHNOLOGIES CORPORATION: PRODUCT LAUNCHES
                        TABLE 194 RAYTHEON TECHNOLOGIES CORPORATION: DEALS
             16.2.3 L3HARRIS TECHNOLOGIES INC.
                        TABLE 195 L3HARRIS TECHNOLOGIES INC.: BUSINESS OVERVIEW
                        FIGURE 64 L3HARRIS TECHNOLOGIES INC.: COMPANY SNAPSHOT
                        TABLE 196 L3HARRIS TECHNOLOGIES INC.: PRODUCTS/SOLUTIONS/SERVICES OFFERED
                        TABLE 197 L3HARRIS TECHNOLOGIES INC.: PRODUCT LAUNCHES
                        TABLE 198 L3HARRIS TECHNOLOGIES INC.: DEALS
             16.2.4 LOCKHEED MARTIN CORPORATION
                        TABLE 199 LOCKHEED MARTIN CORPORATION: BUSINESS OVERVIEW
                        FIGURE 65 LOCKHEED MARTIN CORPORATION: COMPANY SNAPSHOT
                        TABLE 200 LOCKHEED MARTIN CORPORATION: PRODUCTS/SOLUTIONS/SERVICES OFFERED
                        TABLE 201 LOCKHEED MARTIN CORPORATION: PRODUCT LAUNCHES
                        TABLE 202 LOCKHEED MARTIN CORPORATION: DEALS
             16.2.5 THALES GROUP
                        TABLE 203 THALES GROUP: BUSINESS OVERVIEW
                        FIGURE 66 THALES GROUP: COMPANY SNAPSHOT
                        TABLE 204 THALES GROUP: PRODUCTS/SOLUTIONS/SERVICES OFFERED
                        TABLE 205 THALES GROUP: DEALS
             16.2.6 ELBIT SYSTEMS LTD.
                        TABLE 206 ELBIT SYSTEMS LTD.: BUSINESS OVERVIEW
                        FIGURE 67 ELBIT SYSTEMS LTD.: COMPANY SNAPSHOT
                        TABLE 207 ELBIT SYSTEMS LTD.: PRODUCTS/SOLUTIONS/SERVICES OFFERED
                        TABLE 208 ELBIT SYSTEMS LTD.: PRODUCT LAUNCHES
                        TABLE 209 ELBIT SYSTEMS LTD.: DEALS
             16.2.7 RHEINMETALL AG
                        TABLE 210 RHEINMETALL AG: BUSINESS OVERVIEW
                        FIGURE 68 RHEINMETALL AG: COMPANY SNAPSHOT
                        TABLE 211 RHEINMETALL AG: PRODUCTS/SOLUTIONS/SERVICES OFFERED
                        TABLE 212 RHEINMETALL AG.: DEALS
             16.2.8 LEONARDO
                        TABLE 213 LEONARDO: BUSINESS OVERVIEW
                        FIGURE 69 LEONARDO: COMPANY SNAPSHOT
                        TABLE 214 LEONARDO: PRODUCTS/SOLUTIONS/SERVICES OFFERED
                        TABLE 215 LEONARDO: DEALS
             16.2.9 BAE SYSTEMS
                        TABLE 216 BAE SYSTEMS: BUSINESS OVERVIEW
                        FIGURE 70 BAE SYSTEMS: COMPANY SNAPSHOT
                        TABLE 217 BAE SYSTEMS: PRODUCTS/SOLUTIONS/SERVICES OFFERED
             16.2.10 KONGSBERG
                        TABLE 218 KONGSBERG: BUSINESS OVERVIEW
                        FIGURE 71 KONGSBERG: COMPANY SNAPSHOT
                        TABLE 219 KONGSBERG: PRODUCTS/SOLUTIONS/SERVICES OFFERED
             16.2.11 SAAB AB
                        TABLE 220 SAAB AB: BUSINESS OVERVIEW
                        FIGURE 72 SAAB AB: COMPANY SNAPSHOT
                        TABLE 221 SAAB AB: PRODUCTS/SOLUTIONS/SERVICES OFFERED
             16.2.12 ISRAEL AEROSPACE INDUSTRIES (IAI)
                        TABLE 222 ISRAEL AEROSPACE INDUSTRIES: BUSINESS OVERVIEW
                        FIGURE 73 ISRAEL AEROSPACE INDUSTRIES: COMPANY SNAPSHOT
                        TABLE 223 ISRAEL AEROSPACE INDUSTRIES: PRODUCTS/SOLUTIONS/SERVICES OFFERED
                        TABLE 224 ISRAEL AEROSPACE INDUSTRIES: DEALS
             16.2.13 HENSOLDT
                        TABLE 225 HENSOLDT: BUSINESS OVERVIEW
                        FIGURE 74 HENSOLDT: COMPANY SNAPSHOT
                        TABLE 226 HENSOLDT: PRODUCTS/SERVICES/SOLUTIONS OFFERED
             16.2.14 ASELSAN A.S.
                        TABLE 227 ASELSAN A.S.: BUSINESS OVERVIEW
                        FIGURE 75 ASELSAN A.S.: COMPANY SNAPSHOT
                        TABLE 228 ASELSAN A.S.: PRODUCTS/SOLUTIONS/SERVICES OFFERED
                        TABLE 229 ASELSAN A.S.: DEALS
             16.2.15 TELEDYNE FLIR
                        TABLE 230 TELEDYNE FLIR: BUSINESS OVERVIEW
                        TABLE 231 TELEDYNE FLIR: PRODUCTS/SOLUTIONS/SERVICES OFFERED
                        TABLE 232 TELEDYNE FLIR: PRODUCT LAUNCHES
                        TABLE 233 TELEDYNE FLIR: DEALS
             16.2.16 TEXTRON INC.
                        TABLE 234 TEXTRON INC.: BUSINESS OVERVIEW
                        FIGURE 76 TEXTRON INC.: COMPANY SNAPSHOT
                        TABLE 235 TEXTRON INC.: PRODUCTS/SOLUTIONS/SERVICES OFFERED
             16.2.17 SAFRAN ELECTRONICS AND DEFENSE
                        TABLE 236 SAFRAN ELECTRONICS AND DEFENSE: BUSINESS OVERVIEW
                        TABLE 237 SAFRAN ELECTRONICS AND DEFENSE: PRODUCTS/SOLUTIONS/SERVICES OFFERED
                        TABLE 238 SAFRAN ELECTRONICS AND DEFENSE: DEALS
*Details on Business overview, Products/Solutions/Services offered, Recent developments & MnM View might not be captured in case of unlisted companies.  
     16.3 OTHER PLAYERS 
             16.3.1 LYNRED
                        TABLE 239 LYNRED: COMPANY OVERVIEW
             16.3.2 INFINITI ELECTRO OPTICS
                        TABLE 240 INFINITI ELECTRO OPTICS: COMPANY OVERVIEW
             16.3.3 RAFAEL ADVANCED DEFENSE SYSTEMS
                        TABLE 241 RAFAEL ADVANCED DEFENSE SYSTEMS: COMPANY OVERVIEW
             16.3.4 VECTORNAV TECHNOLOGIES
                        TABLE 242 VECTORNAV TECHNOLOGIES: COMPANY OVERVIEW
             16.3.5 ASCENT VISION TECHNOLOGIES
                        TABLE 243 ASCENT VISION TECHNOLOGIES: COMPANY OVERVIEW
             16.3.6 HARRIS AERIAL
                        TABLE 244 HARRIS AERIAL: COMPANY OVERVIEW
             16.3.7 MERCURY SYSTEMS
                        TABLE 245 MERCURY SYSTEMS: COMPANY OVERVIEW
             16.3.8 ALPHA DESIGN TECHNOLOGIES
                        TABLE 246 ALPHA DESIGN TECHNOLOGIES: COMPANY OVERVIEW
 
17 APPENDIX (Page No. - 244)
     17.1 DISCUSSION GUIDE 
     17.2 KNOWLEDGESTORE: MARKETSANDMARKETS’ SUBSCRIPTION PORTAL 
     17.3 CUSTOMIZATION OPTIONS 
     17.4 RELATED REPORTS 
     17.5 AUTHOR DETAILS 


The research study conducted on the military electro-optics & infrared (EO/IR) system market involved extensive use of secondary sources, including directories, databases of articles, journals on military EO/IR system, company newsletters, and information portals such as Hoover’s, Bloomberg, and Factiva to identify and collect information useful for this extensive, technical, market-oriented, and commercial study of the military EO/IR system market. Primary sources are several industry experts from the core and related industries, alliances, organizations, Original Equipment Manufacturers (OEMs), vendors, suppliers, and technology developers. These sources relate to all segments of the value chain of the military EO/IR system market.

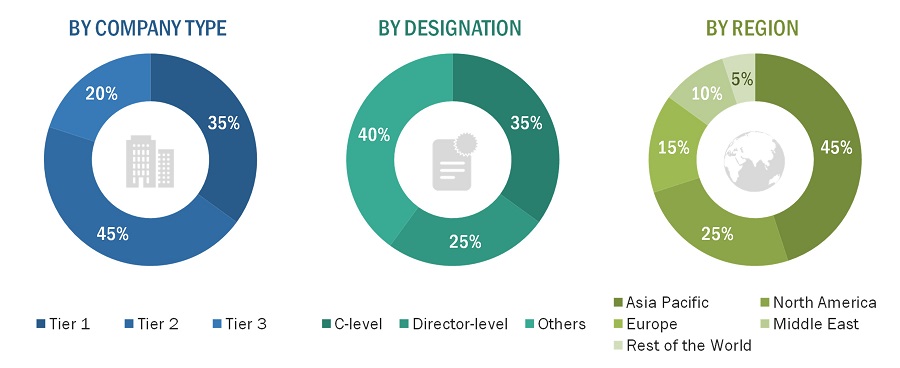
In-depth interviews were conducted with various primary respondents, including key industry participants, subject-matter experts, C-level executives of key market players, and industry consultants, among others, to obtain and verify critical qualitative and quantitative information and to assess future prospects of the market.

Secondary Research

In the secondary research process, various secondary sources were referred to identify and collect information for this study on the military electro-optics & infrared (EO/IR) system market. Secondary sources included annual reports, press releases, and investor presentations of companies; white papers and certified publications; articles from recognized authors; manufacturer's associations; directories; and databases. Secondary research was mainly used to obtain key information about the supply chain of the military electro-optics & infrared (EO/IR) system industry, the monetary chain of the market, the total pool of key players, market classification and segmentation according to the industry trends to the bottom-most level, regional markets, and key developments from both market- and technology-oriented perspectives.

Primary Research

Extensive primary research was conducted to obtain qualitative and quantitative information for this report on the military electro-optics & infrared (EO/IR) system market. Several primary interviews were conducted with the market experts from both demand- and supply-side across major regions, namely, North America, Europe, Asia Pacific, the Middle East, Latin America, and Africa. Primary sources from the supply-side included industry experts such as business development managers, sales heads, technology and innovation directors, and related key executives from various key companies and organizations operating in the military electro-optics & infrared (EO/IR) system market.
Military Electro-Optics/Infrared (EO/IR) Systems Market Size, and Share

To know about the assumptions considered for the study, download the pdf brochure

Market Size Estimation

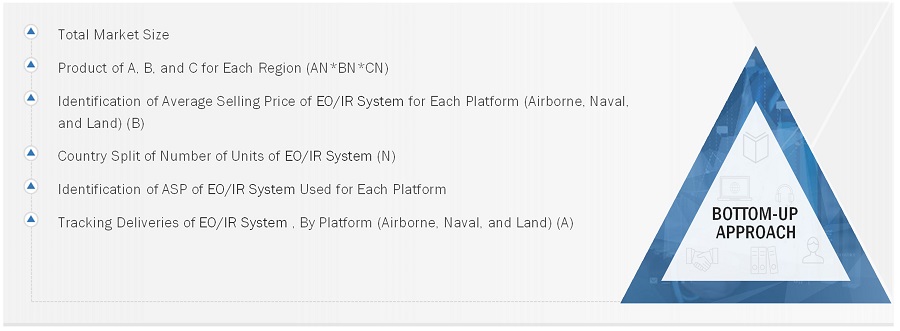
The military electro-optics & infrared (EO/IR) system market is an emerging one due to the growing demand for intelligence, surveillance and  Reconnaissance. Both top-down and bottom-up approaches were used to estimate and validate the size of the military electro-optics & infrared (EO/IR) system market. The research methodology used to estimate the market size also included the following details:

Key players were identified through secondary research, and their market ranking was determined through primary and secondary research. This included a study of annual and financial reports of the top market players and extensive interviews of leaders, including CEOs, directors, and marketing executives. All percentage shares, splits, and breakdowns were determined using secondary sources and verified through primary sources. All possible parameters that affect the markets covered in this research study were accounted for, viewed in extensive detail, verified through primary research, and analyzed to obtain the final quantitative and qualitative data. This data was consolidated, enhanced with detailed inputs, analyzed by MarketsandMarkets, and presented in this report.

Market size estimation methodology: Bottom-up approach
Military Electro-Optics/Infrared (EO/IR) Systems Market Size, and Bottom-up Approach

Market size estimation methodology: Top down approach

Military Electro-Optics/Infrared (EO/IR) Systems Market Size, and Top Down Approach

Data Triangulation

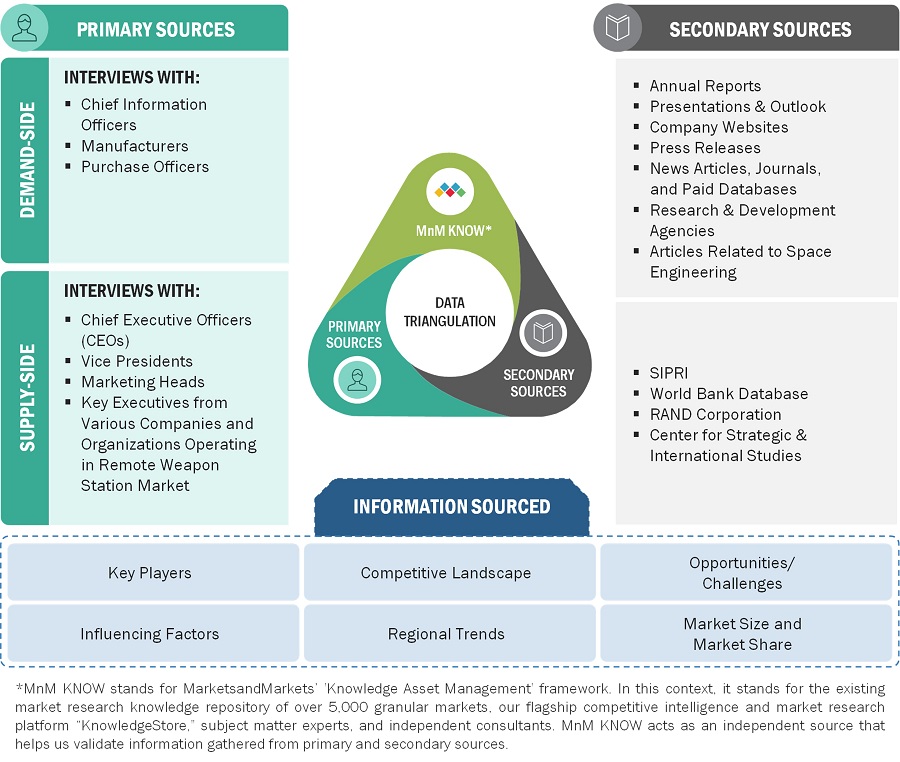
After arriving at the overall size of the military electro-optics & infrared (EO/IR) system market from the market size estimation process explained above, the total market was split into several segments and subsegments. The data triangulation and market breakdown procedures explained below were implemented, wherever applicable, to complete the overall market engineering process and arrive at the estimated sizes of different market segments and subsegments. The data was triangulated by studying various factors and trends from both the demand and supply sides. Additionally, the market size was validated using both the top-down and bottom-up approaches
Military Electro-Optics/Infrared (EO/IR) Systems Market Size, and Triangulation

Market Definition

EO/IR stands for Electro-Optical/Infrared, and it refers to technologies that use both visible light and infrared radiation to capture images and gather information about a scene or target. In the military context, EO/IR systems are often used for surveillance, reconnaissance, and targeting. Electro-optical systems use visible light to capture images, like a digital camera. These systems may include cameras, telescopes, and other optical devices. Infrared systems, on the other hand, capture images based on heat radiation, allowing them to detect objects even in low light or obscured conditions. Together, EO/IR systems can provide a comprehensive view of a scene, allowing military operators to gather information and make decisions about potential threats. They are often used in aircraft, drones, and ground-based systems for various military applications, including border security, force protection, and intelligence gathering.

Key Stakeholders

  • Senior Management
  • End User
  • Finance/Procurement Department
  • R&D Department

Report Objectives

  • To define, describe, and forecast the size of the military electro-optics & infrared (EO/IR) system market based on platform, weapon type, component, application, mobility, technology, and region from 2023 to 2028.
  • To forecast the size of various segments of the market with respect to major regions, namely, North America, Europe, Asia Pacific, and the Rest of the World (RoW), which comprises the Middle East, Latin America & Africa
  • To identify and analyze key drivers, restraints, opportunities, and challenges influencing the growth of the military electro-optics & infrared (EO/IR) system market across the globe.
  • To strategically analyze micromarkets1 with respect to individual growth trends, prospects, and their contribution to the military electro-optics & infrared (EO/IR) system market
  • To analyze opportunities for stakeholders in the market by identifying key market trends
  • To analyze competitive developments such as contracts, acquisitions and expansions, agreements, joint ventures and partnerships, new product launches, and Research & Development (R&D) activities in the military electro-optics & infrared (EO/IR) system market
  • To provide a detailed competitive landscape of the -market, in addition to an analysis of business and corporate strategies adopted by leading market players.
  • To strategically profile key market players and comprehensively analyze their core competencies2.

Available customizations

Along with the market data, MarketsandMarkets offers customizations as per the specific needs of companies. The following customization options are available for the report:

Product Analysis

  • Product matrix, which gives a detailed comparison of the product portfolio of each company

Regional Analysis

  • Further breakdown of the market segments at country-level

Company Information

  • Detailed analysis and profiling of additional market players (up to 5)
Custom Market Research Services

We will customize the research for you, in case the report listed above does not meet with your exact requirements. Our custom research will comprehensively cover the business information you require to help you arrive at strategic and profitable business decisions.

Request Customization

Instant Answers with GPT - Ask Now!

Ask real questions. Get complete answers !
Report Code
AS 2888
Published ON
Apr, 2023
Choose License Type
BUY NOW
  • SHARE
X
Request Customization
Speak to Analyst
Speak to Analyst
OR FACE-TO-FACE MEETING
PERSONALIZE THIS RESEARCH
  • Triangulate with your Own Data
  • Get Data as per your Format and Definition
  • Gain a Deeper Dive on a Specific Application, Geography, Customer or Competitor
  • Any level of Personalization
REQUEST A FREE CUSTOMIZATION
LET US HELP YOU!
  • What are the Known and Unknown Adjacencies Impacting the Military Electro-Optics/Infrared (EO/IR) Systems Market
  • What will your New Revenue Sources be?
  • Who will be your Top Customer; what will make them switch?
  • Defend your Market Share or Win Competitors
  • Get a Scorecard for Target Partners
CUSTOMIZED WORKSHOP REQUEST
knowledgestore logo

Want to explore hidden markets that can drive new revenue in Military Electro-Optics/Infrared (EO/IR) Systems Market?

Find Hidden Markets
  • Call Us
  • +1-888-600-6441 (Corporate office hours)
  • +1-888-600-6441 (US/Can toll free)
  • +44-800-368-9399 (UK office hours)
CONNECT WITH US
ABOUT TRUST ONLINE
©2024 MarketsandMarkets Research Private Ltd. All rights reserved
DMCA.com Protection Status
Website Feedback