Driveline Market for Electric & Hybrid Vehicle by Architecture (Series, Parallel, Power split), Transmission (AT, DCT, E-CVT), Motor Output (45-100, 101-250, >250kW), Final Drive, Drive Type, Power Electronics, Vehicle Type, Region - Global Forecast to 2025


The driveline market was valued at USD 16.09 Billion in 2016 and is projected to reach USD 63.32 Billion by 2025, at a CAGR of 16.92% during the forecast period.
Objectives of the study
- To define and segment the global driveline market, and forecast the market size (2015–2025), in terms of volume (‘000 units) and value (USD million)
- To understand the global market, and forecast the market size by value and volume, based on Architecture at regional level
- To understand the global driveline market, and forecast the market size by value and volume, by transmission at regional level
- To understand the global market, and forecast the market size by value and volume, by Final drive at regional level
- To understand the global market, by drive types
- To understand the global market, and forecast the market size by value and volume, by Power electronics system at regional level
- To understand the global driveline market, and forecast the market size by value and volume, by Motor power output at regional level
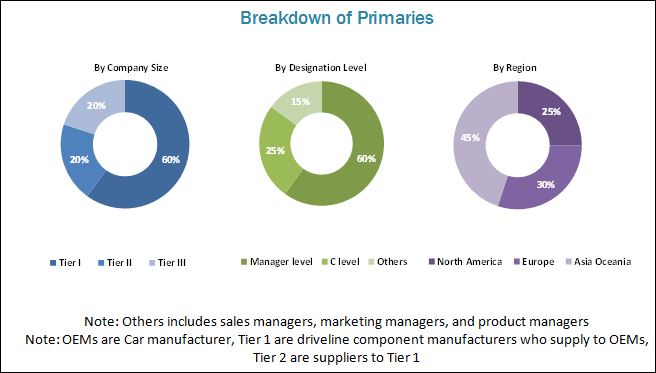
The research methodology used in the report involves various secondary sources including auto industry organizations and automotive associations such as European Automobile Manufacturers' Association (ACEA) and The International Council on Clean Transportation (ICCT) as well as paid databases and directories. Experts from related industries and suppliers have been interviewed to understand the future trends of this market. A bottom-up approach was used to estimate and validate the size of the global market and to estimate the size of various other dependent submarkets . The market size, by volume, of the driveline for electric and hybrid vehicle, has been derived by identifying the country-wise sales of electric and hybrid vehicles. This has been further categorized by architecture, such as series, parallel, and power split. This has been further segmented into systems such as transmission system, power electronics, and final drive to get the country-wise market for systems, in terms of volume. All percentage shares split and breakdowns have been determined using secondary sources and verified through primary sources and analyzed to gain the final quantitative and qualitative data. The data has been consolidated, enhanced with detailed inputs and analysis from MarketsandMarkets, and presented in this report.
The below figure shows the break-up of the profile of industry experts who participated in primary discussions.
To know about the assumptions considered for the study, download the pdf brochure
The ecosystem of driveline market consists of manufacturers such as ZF (Germany), Schaeffler (Germany), GKN (UK), BorgWarner (US), and Robert Bosch (Germany); OEMs such as Volkswagen (Germany), Ford Motors (US), Toyota Motors (Japan), Mahindra & Mahindra (India); and equipment manufacturer associations such as Automotive Component Manufacturers Association of India (ACMA), Japan Automotive Manufacturers Association (JAMA), and European Automobile Manufacturers' Association (ACEA).
Target Audience
- Hybrid driveline Manufacturers or Suppliers
- Electric driveline Manufacturers or Suppliers
- Original Equipment Manufacturers (OEM)
- Raw Material Suppliers for Hybrid System Manufacturers
- Traders, Distributors, and Suppliers of Hybrid Systems/Components
- Regional Automobile Associations
- Component Manufacturers of Hybrid Systems/Components
Scope of the Report
By Architecture
By Vehicle Type
By Power Electronics
By Final Drive
By Transmission Type
By Drive Type
By Motor Output
By Region
- Series driveline
- Parallel driveline
- Power split driveline
- Electric driveline
- Hybrid electric vehicle (HEV)
- Plug-in hybrid electric vehicle (PHEV)
- Electric vehicle (EV)
- Inverter
- Converter
- Power control unit (PCU)
- Differential
- E-axle
- Automatic transmission (AT)
- Dual Clutch Transmission (DCT)
- E-CVT
- Front wheel drive (FWD)
- Rear wheel drive (RWD)
- All-wheel drive (AWD)
- 45 — 100 kW
- 101 — 250 kW
- >250 kW
- North America
- Asia Oceania
- Europe
- RoW
Available Customizations
With the given market data, MarketsandMarkets offers customizations in accordance with the company’s specific needs.
Global Market, by vehicle type & architecture, 2015–2025
(The countries to be studied are China, Japan, India, South Korea, Germany, and France, Italy, The Netherlands, Norway, UK, US, Canada, Mexico, Brazil, Russia, and South Africa)
Global Market, by architecture & system, 2015–2025
- Series, by vehicle type (HEV, PHEV, BEV)
- Parallel, by vehicle type (HEV, PHEV, BEV)
- Power split, by vehicle type (HEV, PHEV, BEV)
- EV Driveline, by vehicle type (HEV, PHEV, BEV)
- Series, by system (Power Electronics, Motor, Transmission, Final Drive)
- Parallel, by system (Power Electronics, Motor, Transmission, Final Drive)
- Power split, by system (Power Electronics, Motor, Transmission, Final Drive)
- EV Driveline, by system (Power Electronics, Motor, Transmission, Final Drive)
The driveline market for electric and hybrid vehicle is estimated to be USD 18.14 Billion in 2017and is projected to reach USD 63.32 Billion by 2025, at a CAGR of 16.92% from 2017 to 2025. The increasing demand for higher fuel efficiency and stringent emission regulations by governments across the world have forced manufacturers to adopt the hybrid and electric vehicle technology.
Technological advancement in the field of electric and hybrid drivelines such as regenerative braking, automatic start-stop, E-axle, and E-CVT are the major driving forces for the electric and hybrid driveline. The choice of technology varies for a Hybrid Electric Vehicle(HEV), Plug-in Hybrid Electric Vehicle (PHEV), or Battery Electric Vehicle (BEV). Hence, the market is dependent on the sales of hybrid and electric vehicles. The increasing sales of electric and hybrid vehicles are driving the market for the electric and hybrid driveline.
The study segments the driveline market for the electric and hybrid vehicle by architecture type. HEV market is projected to have the largest market share owing to its huge acceptance from customers across the globe. The parallel architecture for hybrid vehicle was estimated to grow at the fastest rate during the forecast period owing to its benefits such as better efficiency and less complexity.
The study segments the driveline market for electric and hybrid vehicle by power electronics. The electric and hybrid vehicle driveline is equipped with both inverters and converter and because of which both the market by volume is expected to grow with the same rate. The power control unit on the other side is a new technology which combines the inverters and converters in a single unit and is expected to grow at the fastest rate during the forecasted period.
In another segment of the study, the E-CVT market is estimated to showcase the largest market volume, which is anticipated to rise due to rapid adoption in the Asian market. In terms of value, DCT is expected to be the fastest growing segment during the forecast period, the reason being its rapid adoption in luxury and sports cars. Europe is the largest market for DCT. Over the forecast period, market for final drive is dominated by differential; while in the near future, E-axle is expected to gain market share at the fastest rate due to its benefit in weight reduction and efficiency improvement of the driveline.
The performance of a motor is measured by its output, which is known as the traction output. The motor output varies from 12 kW to >250 kW and depends on the vehicle specification. The 45 to 100 kW market is estimated to showcase the largest market volume over the forecast period due to high adoption in the Asian region. In terms of value, the >250 kW segment is expected to be the fastest growing segment during the forecast period.
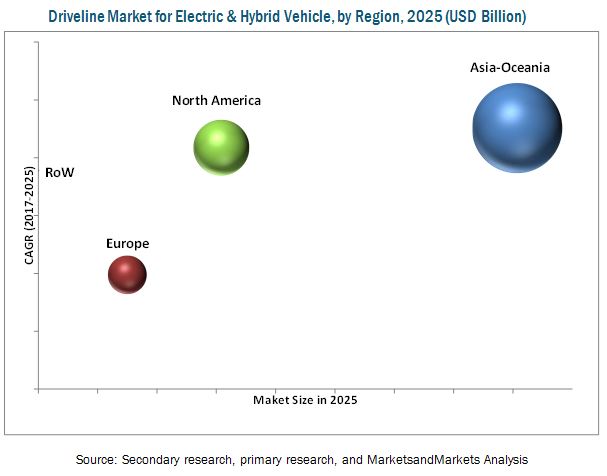
Asia Oceania is expected to be the largest and the fastest growing market. The major reason for the fastest growth is heavy production and sales of hybrid and electric vehicles in the region. Also, the rising per capita income of the region’s widespread consumer base has created a favorable environment for the growth of the electric and hybrid vehicle market in Asia Oceania. China is one of the leaders in auto component exports.
The major factors hindering the growth of driveline market are the high cost of technology as compared to conventional IC engine-powered driveline and the lack of infrastructure development for charging in developing countries.
Driveline manufacturers have adopted the strategies of new product development and geographical expansion to gain traction in the global driveline market. The key market players are ZF (Germany), Schaeffler (Germany), GKN (UK), BorgWarner (US), and Robert Bosch (Germany).
To speak to our analyst for a discussion on the above findings, click Speak to Analyst
 Exclusive indicates content/data unique to MarketsandMarkets and not available with any competitors.
Table of Contents
1 Introduction (Page No. - 15)
1.1 Objectives of the Study
1.2 Market Definition
1.3 Market Scope
1.3.1 Years Considered for the Study
1.4 Currency
1.5 Package Size
1.6 Limitations
1.7 Stakeholders
2 Research Methodology (Page No. - 19)
2.1 Research Data
2.2 Secondary Data
2.2.1 Key Secondary Sources
2.3 Primary Data
2.4 Factor Analysis
2.4.1 Introduction
2.4.2 Demand-Side Analysis
2.4.2.1 Rising Demand for Hybrid & Electric Vehicles
2.4.2.2 Government Support for Electric and Hybrid Vehicles
2.4.3 Supply-Side Analysis
2.4.3.1 Technological Advancement With Focus on Convenience & Comfort Systems in Vehicle
2.5 Market Size Estimation
2.6 Market Breakdown & Data Triangulation
2.7 Assumptions
3 Executive Summary (Page No. - 28)
4 Premium Insights (Page No. - 36)
4.1 Attractive Opportunities in the Driveline Market for Electric & Hybrid Vehicles
4.2 Market, By Architecture
4.3 Market, By Driveline Systems
4.4 Market, By Vehicle Type
4.5 Market, By Final Drive Type
4.6 Market, By Motor Output
4.7 Market, By Transmission Type
4.8 Market, By Power Electronics
4.9 Market, By Country
5 Market Overview (Page No. - 42)
5.1 Introduction
5.2 Market Dynamics
5.2.1 Drivers
5.2.1.1 Increasing Trend of Parallel Hybrid Architecture Over Other Driveline Architectures
5.2.1.2 Adoption of Advanced Technologies Such as E-Axle and E-CVT in Electric Vehicles
5.2.2 Restraints
5.2.2.1 Difficulty in Achieving and Maintaining Optimum Power-To-Weight Ratio is Hindering the Growth of Electric Vehicles
5.2.3 Opportunity
5.2.3.1 Increase in Demand for Electric Buses and Trucks
5.2.3.2 Use of Alternate Materials for Overall Weight Reduction to Open New Avenues in Electric Vehicles Technologies
5.2.4 Challenges
5.2.4.1 Inadequate Charging Infrastructure for Electric Vehicles in Developing Countries
5.3 Macro Indicators
5.3.1 Introduction
5.3.1.1 Full Electric Vehicle Sales as A Percentage of Total Electric Vehicle Sales
5.3.1.2 GDP (USD Billion)
5.3.1.3 GNP Per Capita, Atlas Method (USD)
5.3.1.4 GDP Per Capita PPP (USD)
5.3.2 US
5.3.3 China
5.3.4 Japan
6 Global Driveline Market, By Vehicle Type (Page No. - 53)
Note - The Chapter Is Further Segmented At Regional Level and Considered Regions Are Asia Oceania, Europe, North America, and RoW
6.1 Introduction
6.2 Hybrid Vehicles (HEV)
6.3 Plug-In Electric Hybrid (PHEV)
6.4 Battery Electric Vehicle (BEV)
7 Global Driveline Market, By Power Electronics (Page No. - 60)
Note - The Chapter is Further Segmented at Regional Level and Considered Regions are Asia Oceania, Europe, North America, and RoW
7.1 Introduction
7.2 Inverter
7.3 Converter
7.4 Power Control Unit
8 Global Driveline Market, By Transmission Type (Page No. - 66)
Note - The Chapter is Further Segmented at Regional Level and Considered Regions are Asia Oceania, Europe, North America, and RoW
8.1 Introduction
8.2 Automatic Transmission (AT)
8.3 Dual Clutch Transmission (DCT)
8.4 Electronic Continuously Variable Transmission (E-CVT)
9 Global Driveline Market, By Final Drive (Page No. - 73)
Note - The Chapter is Further Segmented at Regional Level and Considered Regions are Asia Oceania, Europe, North America, and RoW
9.1 Introduction
9.2 Differential
9.3 E-Axle
10 Global Driveline Market, By Motor Output (Page No. - 79)
Note - The Chapter is Further Segmented at Regional Level and Considered Regions are Asia Oceania, Europe, North America, and RoW
10.1 Introduction
10.2 45–100 kW
10.3 101–250 kW
10.4 >250 kW
11 Global Driveline Market, By Drive Type (Page No. - 85)
11.1 Introduction
11.2 Front Wheel Drive (FWD)
11.3 Rear Wheel Drive (RWD)
11.4 All Wheel Drive (AWD)
12 Global Driveline Market, By Architecture (Page No. - 91)
Note - The Chapter is Further Segmented at Regional Level and Considered Regions are Asia Oceania, Europe, North America, and RoW
12.1 Introduction
12.2 Series
12.3 Parallel
12.4 Power Split
12.5 EV Driveline
13 Global Driveline Market, By Region (Page No. - 98)
Note - The Chapter is Further Segmented at Regional & Country Level By Architecture - Series, Parallel, Power Split, and EV Driveline
13.1 Introduction
13.2 Asia Oceania
13.2.1 China
13.2.2 India
13.2.3 Japan
13.2.4 South Korea
13.3 Europe
13.3.1 Germany
13.3.2 France
13.3.3 Italy
13.3.4 Netherland
13.3.5 UK
13.4 North America
13.4.1 US
13.4.2 Canada
13.4.3 Mexico
13.5 Rest of the World (RoW)
13.5.1 Brazil
13.5.2 Russia
14 Competitive Landscape (Page No. - 120)
14.1 Overview
14.2 Driveline for Electric & Hybrid Vehicle: Market Ranking Analysis
14.3 Competitive Scenario
14.3.1 Expansion
14.3.2 Supply Contracts
14.3.3 New Product Launches/Developments
14.3.4 Partnership/Joint Ventures
14.3.5 Mergers & Acquisitions
15 Company Profiles (Page No. - 125)
(Overview, Product Offerings, SWOT Analysis, MnM View)*
15.1 GKN
15.2 Schaeffler
15.3 ZF
15.4 Robert Bosch
15.5 Borgwarner
15.6 Hitachi
15.7 Continental
15.8 Delphi
15.9 Denso
15.10 Valeo
*Details on Overview, Product Offerings, SWOT Analysis, MnM View Might Not Be Captured in Case of Unlisted Companies.
16 Appendix (Page No. - 150)
16.1 Insights of Industry Experts
16.2 Discussion Guide
16.3 Knowledge Store: Marketsandmarkets’ Subscription Portal
16.4 Introducing RT: Real Time Market Intelligence
16.5 Available Customizations
16.5.1 Driveline for Electric and Hybrid Vehicle, By Vehicle Type & Architecture, 2015-2025
16.5.1.1 Series Driveline for Electric and Hybrid Vehicle, By Vehicle Type (HEV, PHEV, BEV)
16.5.1.2 Parallel Driveline for Electric and Hybrid Vehicle, By Vehicle Type (HEV, PHEV, BEV)
16.5.1.3 Power Split Driveline for Electric and Hybrid Vehicle, By Vehicle Type (HEV, PHEV, BEV)
16.5.1.4 EV Driveline for Electric and Hybrid Vehicle, By Vehicle Type (HEV, PHEV, BEV)
16.5.2 Driveline for Electric and Hybrid Vehicle, By Architecture & System, 2015-2025
16.5.2.1 Series Driveline for Electric and Hybrid Vehicle, By System (Power Electronics, Motor, Transmission, Final Drive)
16.5.2.2 Parallel Driveline for Electric and Hybrid Vehicle, By System (Power Electronics, Motor, Transmission, Final Drive)
16.5.2.3 Power Split Driveline for Electric and Hybrid Vehicle, By System (Power Electronics, Motor, Transmission, Final Drive)
16.5.2.4 EV Driveline for Electric and Hybrid Vehicle, By System (Power Electronics, Motor, Transmission, Final Drive)
16.6 Related Reports
16.7 Author Details
List of Tables (97 Tables)
Table 1 Currency Exchange Rates (Per USD)
Table 2 Government Subsidies for Electric & Hybrid Vehicles
Table 3 Global Driveline Market: Research Assumption
Table 4 Hybrid Drivelines Comparison
Table 5 Top HEV & PHEV Models With Advanced Technologies and Sales, 2016
Table 6 Battery Type vs Power-To-Weight Ratio
Table 7 Power Output-To-Vehicle Weight
Table 8 Market, By Vehicle Type, 2015–2025 (’000 Units)
Table 9 Market, By Vehicle Type, 2015–2025 (USD Million)
Table 10 HEV Market for Electric & Hybrid Driveline, By Region, 2015–2025 (’000 Units)
Table 11 HEV Market for Electric & Hybrid Driveline, By Region, 2015–2025 (USD Million)
Table 12 PHEV Market for Electric & Hybrid Driveline, By Region, 2015–2025 (’000 Units)
Table 13 PHEV Market for Electric & Hybrid Driveline, By Region, 2015–2025 (USD Million)
Table 14 BEV Market for Electric & Hybrid Driveline, By Region, 2015–2025 (’000 Units)
Table 15 BEV Market for Electric & Hybrid Driveline, By Region, 2015–2025 (USD Million)
Table 16 Power Electronics Market for Electric & Hybrid Driveline, By Component, 2015–2025 (’000 Units)
Table 17 Power Electronics Market for Electric & Hybrid Driveline, By Component, 2015–2025 (USD Million)
Table 18 Inverter Market for Electric & Hybrid Driveline, By Region, 2015–2025 (’000 Units)
Table 19 Inverter Market for Electric & Hybrid Driveline, By Region, 2015–2025 (USD Million)
Table 20 Converter Market for Electric & Hybrid Driveline, By Region, 2015–2025 (’000 Units)
Table 21 Converter Market for Electric & Hybrid Driveline, By Region, 2015–2025 (USD Million)
Table 22 PCU Market for Electric & Hybrid Driveline, By Region, 2015–2025 (’000 Units)
Table 23 PCU Market for Electric & Hybrid Driveline, By Region, 2015–2025 (USD Million)
Table 24 Driveline Market, By Transmission Type, 2015–2025 (’000 Units)
Table 25 Market, By Transmission Type, 2015–2025 (USD Million)
Table 26 AT Market for Electric & Hybrid Driveline, By Region, 2015–2025 (’000 Units)
Table 27 AT Market for Electric & Hybrid Driveline, By Region, 2015–2025 (USD Million)
Table 28 DCT Market for Electric & Hybrid Driveline, By Region, 2015–2025 (’000 Units)
Table 29 DCT Market for Electric & Hybrid Driveline, By Region, 2015–2025 (USD Million)
Table 30 E-CVT Market for Electric & Hybrid Driveline, By Region, 2015–2025 (’000 Units)
Table 31 E-CVT Market for Electric & Hybrid Driveline, By Region, 2015–2025 (USD Million)
Table 32 Final Drive Market for Electric & Hybrid Driveline, By Final Drive Type, 2015–2025 (’000 Units)
Table 33 Final Drive Market for Electric & Hybrid Driveline, By Final Drive Type, 2015–2025 (USD Million)
Table 34 Differential Market for Electric & Hybrid Driveline, By Region, 2015–2025 (’000 Units)
Table 35 Differential Market for Electric & Hybrid Driveline, By Region, 2015–2025 (USD Million)
Table 36 E-Axle Market for Electric & Hybrid Driveline, By Region, 2015–2025 (’000 Units)
Table 37 E-Axle Market for Electric & Hybrid Driveline, By Region, 2015–2025 (USD Million)
Table 38 Motors Used in BEV, HEV, & PHEV
Table 39 Motor Market for Electric & Hybrid Driveline, By Motor Output Type, 2015–2025 (’000 Units)
Table 40 Motor Market for Electric & Hybrid Driveline, By Motor Output Type, 2015–2025 (USD Million)
Table 41 45–100 kW Motor Market for Electric & Hybrid Driveline, By Region, 2015–2025 (’000 Units)
Table 42 45 –100 kW Motor Market for Electric & Hybrid Driveline, By Region, 2015–2025 (USD Million)
Table 43 101–250 kW Motor Market for Electric & Hybrid Driveline, By Region, 2015–2025 (’000 Units)
Table 44 101–250 kW Motor Market for Electric & Hybrid Driveline, By Region, 2015–2025 (USD Million)
Table 45 >250kw Motor Market for Electric & Hybrid Driveline, By Region, 2015—2025 (’000 Units)
Table 46 >250kw Motor Market for Electric & Hybrid Driveline, By Region, 2015—2025 (USD Million)
Table 47 Global Driveline Market, By Drive Type, 2015—2025 (’000 Units)
Table 48 Global Market, By Drive Type, 2015—2025 (USD Million
Table 49 FWD: Driveline for Electric & Hybrid Vehicles, By Region, 2015—2025 (’000 Units)
Table 50 FWD: Driveline for Electric & Hybrid Vehicles, By Region, 2015—2025 (USD Million)
Table 51 RWD: Driveline for Electric & Hybrid Vehicles, By Region, 2015—2025 (’000 Units)
Table 52 RWD: Driveline for Electric & Hybrid Vehicles, By Region, 2015—2025 (USD Million)
Table 53 AWD: Driveline for Electric & Hybrid Vehicles, By Region, 2015—2025 (’000 Units)
Table 54 AWD: Driveline for Electric & Hybrid Vehicles, By Region, 2015—2025 (USD Million)
Table 55 Global Driveline Market, By Architecture, 2015–2025 (’000 Units)
Table 56 Global Market, By Architecture, 2015–2025 (USD Million)
Table 57 Series: Driveline for Electric & Hybrid Vehicles, By Region, 2015–2025 (’000 Units)
Table 58 Series: Driveline for Electric & Hybrid Vehicles, By Region, 2015–2025 (USD Million)
Table 59 Parallel: Driveline for Electric & Hybrid Vehicles, By Region, 2015–2025 (’000 Units)
Table 60 Parallel: Driveline for Electric & Hybrid Vehicles, By Region, 2015–2025 (USD Million)
Table 61 Power Split: Driveline for Electric & Hybrid Vehicles, By Region, 2015–2025 (’000 Units)
Table 62 Power Split: Driveline for Electric & Hybrid Vehicles, By Region, 2015–2025 (USD Million)
Table 63 EV Driveline: Driveline for Electric & Hybrid Vehicles, By Region, 2015–2025 (’000 Units)
Table 64 EV Driveline: Driveline for Electric & Hybrid Vehicles, By Region, 2015–2025 (USD Million)
Table 65 China: Driveline for Electric & Hybrid Vehicles, By Architecture, 2015–2025 (’000 Units)
Table 66 China: Driveline for Electric & Hybrid Vehicles, By Architecture, 2015–2025 (USD Million)
Table 67 India: Driveline for Electric and Hybrid Vehicle, By Architecture, 2015–2025 (’000 Units)
Table 68 India: Driveline for Electric & Hybrid Vehicles, By Architecture, 2015–2025 (USD Millions)
Table 69 Japan: Driveline for Electric and Hybrid Vehicle, By Architecture, 2015–2025 (000 Units)
Table 70 Japan: Driveline for Electric & Hybrid Vehicles, By Architecture, 2015–2025 (USD Million)
Table 71 South Korea: Driveline for Electric & Hybrid Vehicles, By Architecture, 2015–2025 (’000 Units)
Table 72 South Korea: Driveline for Electric and Hybrid Vehicle, By Architecture, 2015–2025 (USD Million)
Table 73 Germany: Driveline for Electric & Hybrid Vehicles, By Architecture, 2015-2025 (’000 Units)
Table 74 Germany: Driveline for Electric and Hybrid Vehicle, By Architecture, 2015–2025 (USD Million)
Table 75 France: Driveline for Electric & Hybrid Vehicles, By Architecture, 2015-2025 (’000 Units)
Table 76 France: Driveline for Electric and Hybrid Vehicle, By Architecture, 2015-2025 (USD Million)
Table 77 Italy: Driveline for Electric & Hybrid Vehicles, By Architecture, 2015-2025 (’000 Units)
Table 78 Italy: Driveline for Electric and Hybrid Vehicle, By Architecture, 2015-2025 (USD Million)
Table 79 Netherland: Driveline for Electric & Hybrid Vehicles, By Architecture, 2015-2025 (’000 Units)
Table 80 Netherland: Driveline for Electric and Hybrid Vehicle, By Architecture, 2015-2025 (USD Million)
Table 81 UK: Driveline for Electric & Hybrid Vehicles, By Architecture, 2015-2025 (’000 Units)
Table 82 UK: Driveline for Electric and Hybrid Vehicle, By Architecture, 2015-2025 (USD Million)
Table 83 US: Driveline for Electric & Hybrid Vehicles, By Architecture, 2015-2025 (’000 Units)
Table 84 US: Driveline for Electric and Hybrid Vehicle, By Architecture, 2015-2025 (USD Million)
Table 85 Canada: Driveline for Electric & Hybrid Vehicles, By Architecture, 2015-2025 (’000 Units)
Table 86 Canada: Driveline for Electric and Hybrid Vehicle, By Architecture, 2015-2025 (USD Million)
Table 87 Mexico: Driveline for Electric & Hybrid Vehicles, By Architecture, 2015-2025 (’000 Units)
Table 88 Mexico: Driveline for Electric and Hybrid Vehicle, By Architecture, 2015-2025 (USD Million)
Table 89 Brazil: Driveline for Electric & Hybrid Vehicles, By Architecture, 2015-2025 (’000 Units)
Table 90 Brazil: Driveline for Electric and Hybrid Vehicle, By Architecture, 2015-2025 (USD Million)
Table 91 Russia: Driveline for Electric & Hybrid Vehicles, By Architecture, 2015-2025 (’000 Units)
Table 92 Russia: Driveline for Electric and Hybrid Vehicle, By Architecture, 2015-2025 (USD Million)
Table 93 Expansions, 2016–2017
Table 94 Supply Contract, 2015–2017
Table 95 New Product Launches/Developments, 2017
Table 96 Partnership/Joint Ventures, 2015–2017
Table 97 Mergers & Acquisitions, 2015–2017
List of Figures (52 Figures)
Figure 1 Market Segmentation
Figure 2 Market: Research Design
Figure 3 Breakdown of Primary Interviews: By Company Type, Designation, & Region
Figure 4 Electric and Hybrid Vehicles are Expected to Have Significant Demand in Near Future
Figure 5 Bottom-Up Approach
Figure 6 Data Triangulation
Figure 7 Global Market, By Architecture, 2017 vs 2025 (USD Billion)
Figure 8 Global Market, By Vehicle Type, 2017 vs 2025 (USD Billion)
Figure 9 Global Market, By Power Electronics, 2017 vs 2025
Figure 10 Global Market, By Final Drive, 2017 vs 2025 (USD Billion)
Figure 11 Global Market, By Transmission Type, 2017 vs 2025
Figure 12 Global Market, By Drive Type, 2017–2025 (USD Billion)
Figure 13 Global Market, By Motor Output, 2017 vs 2025 (USD Billion)
Figure 14 Global Market, By Region, 2017–2025 (USD Billion)
Figure 15 Increasing Demand for Electric & Hybrid Vehicles to Boost the Global Driveline Market During the Forecast Period
Figure 16 Parallel Architecture Market to Grow at A Faster Rate During the Forecast Period
Figure 17 Motor Systems to Be the Largest Market By 2025
Figure 18 Hybrid Electric Vehicle (HEV) to Be the Largest Market
Figure 19 E-Axle Segment to Grow at A Faster Rate Compared to the Differential Segment
Figure 20 45—100 kW Motor Output Type to Remain the Largest Market During the Forecast Period
Figure 21 E-CVT to Remain the Largest Market During the Forecast Period
Figure 22 Power Control Unit (PCU) to Be the Largest Market in Power Electronics During the Forecast Period
Figure 23 Owing to the Limited Penetration of Electric & Hybrid Vehicles, India to Be the Fastest Growing Market for Driveline By 2025, By Value
Figure 24 Driveline for Electric & Hybrid Vehicles: Market Dynamics
Figure 25 US: Parallel vs Hybrid Architecture, 2011–2014 (’000 Units)
Figure 26 Electric Bus and Truck Sales, ’000 Units (2015–2022)
Figure 27 Country-Wise Public Charge Points Per Million Population
Figure 28 Rising Sales of Electric and Hybrid Commercial Vehicles to Play A Pivotal Role During the Forecast Period
Figure 29 Domestic Demand Expected to Play A Crucial Role Owing to A Host of Chinese Domestic Carmakers
Figure 30 Falling GNI Per Capita Could Imply Further Flourishing of Japan's OEM's Overseas
Figure 31 Global Market, By Vehicle Type 2017 vs 2025 (USD Million)
Figure 32 Power Electronics Market for Electric & Hybrid Driveline, By Component (USD Million)
Figure 33 Global Driveline Market, By Transmission Type 2017 vs 2025 (USD Million)
Figure 34 Final Drive Market for Electric & Hybrid Driveline, By Final Drive Type, 2017 vs 2025 (USD Million)
Figure 35 Motor Market for Electric & Hybrid Driveline, By Motor Output 2017 vs 2025 (USD Million)
Figure 36 Global Market, By Drive Type (USD Million)
Figure 37 Global Market, By Architecture, 2017 vs 2025 (USD Million)
Figure 38 Global Market, By Region, 2017 vs 2025 (USD Million)
Figure 39 Asia Oceania: Market Snapshot
Figure 40 North America: Market Snapshot
Figure 41 Companies Adopted Expansions as the Key Growth Strategy, 2013–2017
Figure 42 Driveline for Electric & Hybrid Vehicle, Market Ranking, 2016
Figure 43 GKN: Company Snapshot
Figure 44 Schaeffler: Company Snapshot
Figure 45 ZF: Company Snapshot
Figure 46 Bosch: Company Snapshot
Figure 47 Borgwarner: Company Snapshot
Figure 48 Hitachi: Company Snapshot
Figure 49 Continental: Company Snapshot
Figure 50 Delphi: Company Snapshot
Figure 51 Denso: Company Snapshot
Figure 52 Valeo: Company Snapshot


Growth opportunities and latent adjacency in Driveline Market
We are looking for engineering houses who can help us on xEV systems like inverters, battery management systems, Onboard chargers, DC/DC converters.
I would like to check the market size and sales volume of EVs and charging infrastructure around the world.